. 2021 Jun 22;118(25):e2015005118.
doi: 10.1073/pnas.2015005118.

Haplotype tagging reveals parallel formation of hybrid races in two butterfly species

Affiliations

Haplotype tagging reveals parallel formation of hybrid races in two butterfly species

Joana I Meier et al. Proc Natl Acad Sci U S A. .

Abstract

Genetic variation segregates as linked sets of variants or haplotypes. Haplotypes and linkage are central to genetics and underpin virtually all genetic and selection analysis. Yet, genomic data often omit haplotype information due to constraints in sequencing technologies. Here, we present "haplotagging," a simple, low-cost linked-read sequencing technique that allows sequencing of hundreds of individuals while retaining linkage information. We apply haplotagging to construct megabase-size haplotypes for over 600 individual butterflies (Heliconius erato and H. melpomene), which form overlapping hybrid zones across an elevational gradient in Ecuador. Haplotagging identifies loci controlling distinctive high- and lowland wing color patterns. Divergent haplotypes are found at the same major loci in both species, while chromosome rearrangements show no parallelism. Remarkably, in both species, the geographic clines for the major wing-pattern loci are displaced by 18 km, leading to the rise of a novel hybrid morph in the center of the hybrid zone. We propose that shared warning signaling (Müllerian mimicry) may couple the cline shifts seen in both species and facilitate the parallel coemergence of a novel hybrid morph in both comimetic species. Our results show the power of efficient haplotyping methods when combined with large-scale sequencing data from natural populations.

Keywords: butterfly; genomes; haplotypes; hybrid zone; population genetics.


Conflict of interest statement

Competing interest statement: M.K., A.D., and Y.F.C. declare competing financial interests in the form of patent and employment by the Max Planck Society. The European Research Council provides funding for the research but no other competing interests.

Figures
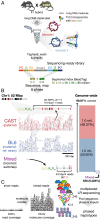
Fig. 1.
Fig. 1.
Haplotagging enables population-scale LR sequencing. (A) Principles of haplotagging. Microbeads coated with barcoded transposon adaptors enable simultaneous molecular barcoding and Tn5-mediated fragmentation of long DNA molecules into sequencing-ready libraries after PCR amplification, all in a single tube. This technique takes advantage of the tendency of DNA to interact only with a single bead in solution (Inset). A key feature of haplotagging is that each bead is uniformly coated with a single segmental barcode combination (“beadTag”) made up of four segments of 96 barcodes each (designated “B,” “D,” olive and “C,” “A,” green at the standard i5/7 index positions of the Illumina Nextera design). Across beads, the four segments represent up to 964 or 85 million beadTags. Thus, DNA molecules wrapped around a single bead can be reconstructed from individual short reads that share the same beadTag. (B) Haplotagging in an F1 hybrid mouse between the reference strain C57BL/6 (BL6) and CAST/EiJ (CAST), with detailed view at Chr1: 52 to 52.5 Mbp. Each molecule is represented by a gray bar connecting short reads (colored bars for CAST, red; or BL6, blue) sharing a single beadTag (e.g., A30C94B16D20 tags a 116-kbp molecule carrying a CAST allele). All but one molecule in this window match perfectly to CAST or BL6 alleles. Genome wide, 99.97% of all reconstructed molecules correspond to CAST or BL6 haplotypes (2 million correct versus 538 incorrect molecules). (C) Vast expansion in molecular versus read coverage for whole-population haplotyping. LR molecules typically span tens of kilobases, compared to ∼500 bp short reads. The increased overlap among molecules often lead to >10-fold increase in molecular coverage (an average of 0.81 reads overlapping a given position versus an average of 23.2 molecules here; SI Appendix, Table S4). In a large population, LR data allow both accurate haplotype reconstruction using pooled read depths and accurate imputation by leveraging linkage information, even with input read coverage reduced to 0.07× (SI Appendix, Fig. S3B). Bead and Tn5 image modified with permission from Zinkia Entertainment, S.A./Pocoyo.
Fig. 2.
Fig. 2.
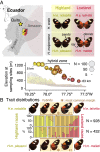
Parallel hybrid zones in a pair of Müllerian comimicking Heliconius butterflies. (A) In eastern Ecuador, butterflies of the species H. erato and H. melpomene occur in the transition zone between the Andes (up to 1,307 m elevation, “Highland”) and the Amazon basin (376 m, “Lowland”) as distinctive races with major wing color pattern differences (labeled as “bands,” “dennis,” and “ray”). Heliconius butterflies are unpalatable and share warning wing patterns (Müllerian comimicry) (18). We sampled a total of 1,360 butterflies of both species along an 83-km transect consisting of 35 sampling sites across the double hybrid zones (kilometers 19 to 59; symbols scaled to sample size and colors indicate elevation) and 12 additional off-transect sites (SI Appendix, Table S5). (B) Proportions of butterflies displaying the highland double-band phenotype (H. erato notabilis and H. melpomene plesseni: yellow) and lowland dennisray patterns (H. erato lativitta and H. melpomene malleti: red) as well as hybrid patterns (F1 and beyond: orange; ✻, most common morph; SI Appendix, Fig. S4B; gray: sites with no specimen in one species) at sampling sites along the transect.
Fig. 3.
Fig. 3.
Highly parallel patterns of differentiation at genomic regions underlying wing color patterns. (A) Major peaks of differentiation are shared across H. erato and H. melpomene (as indicated by FST; H. melpomene data are plotted at its homologous H. erato coordinates). FST values of 10-kbp windows assigned to the high differentiation state by the HMM analysis are shown in black, others in gray. The three most strongly differentiated regions in each pair of subspecies all show strong association with color pattern differences [−log10(P): −log10(P value) of the likelihood ratio test, most strongly associated SNP per 10-kbp window shown]. (B and C) Detailed view at the four loci with strongest differentiation in H. erato (B) and H. melpomene (C). At all four major loci, the races also differ in nucleotide diversity (π; Δπ=πhighland – πlowland), whereby the highland races (H. erato notabilis and H. melpomene plesseni) consistently show greater reduction in diversity than the lowland races (H. erato lativitta and H. melpomene malleti), indicative of strongest selection in the highland races in both species. Compared to the Δπ values of all genomic 50-kbp windows, the four major loci are among the most negative 1% in both species (SI Appendix, Fig. S10). Stronger selection among highland races than lowland races is also supported by haplotype-based selection statistics such as absolute normalized integrated haplotype score (|iHS|) and the ω-statistic. Three of the four major loci in each species are associated with major color patterns, and all fall into the vicinity of the genes WntA (forewing band number), vvl (forewing band shape in H. erato, ref. 25), cortex (yellow spot at the forewing [fw] base in both species and distribution of red scales in H. melpomene likely controlled by domeless/washout [dome]), and optix (presence of red either as forewing patch and hindwing bar and rays [DennisRay] or in forewing band) in H. erato (B) and in H. melpomene (C) (for details see SI Appendix, Figs. S9 and S12 and Datasets S4 and S5).
Fig. 4.
Fig. 4.
Distinct structural rearrangements across the parallel hybrid zones. (A) Locations of major structural rearrangements (translocations and inversions) in the two Heliconius hybrid zones. Chromosome homologs are shown in pairs, with lines connecting syntenic positions between H. erato (gray) and H. melpomene (red; lines: dark gray bars mark scaffold boundaries; circles mark major inversions or translocations). In contrast to the parallelism at divergent peaks shown in Fig. 3, major structural rearrangements tend to be unique for each species. (B) Detection of a major inversion on H. erato Chr2. The average LR molecule spans multiple 10-kbp windows. Thus, the extent of beadTag sharing across windows (10 kbp here) can reveal discrepancies between the physical molecules and the reference assembly as well as across populations. The triangular matrix shows a heatmap of barcode sharing (color indicates genome-wide percentile) juxtaposed against genetic distance (FST) across the pure notabilis and lativitta races. Inversions appear as a “bow-tie”–shaped pattern across the inverted junction boundaries (L, left boundary of the inversion; R, right boundary of the inversion; out/in, outside or inside of the inversion; Leftin/Rightout and Leftout/Rightin, zoomed inset). This inversion coincides with a plateau of elevated genetic distance across the notabilis and lativitta races. Dotted lines mark the inferred inversion boundaries at Herato0204:172503-1290057. Molecules from three individuals representing the three inversion collinear versus heterokaryotypes are shown (inferred inversion indicated with curved arrows). (C) The Chr2 inversion shows a clinal distribution across the notabilislativitta hybrid zone (frequency of wild-type [WT] karyotype: WT, blue dots; fitted cline: blue line; confidence interval: gray envelope).
Fig. 5.
Fig. 5.
Müllerian comimicry and the emergence of a hybrid race due to mirrored cline displacement of color traits. (A) Major color traits segregating across the Ecuadorian hybrid zones show a clinal distribution of haplotype frequencies along the transect in both H. erato (Left) and H. melpomene (Right). There is strong agreement in cline fits between haplotype frequencies (filled circles; cline: colored lines with 95% confidence envelope) and phenotype frequencies (diamonds and dashed lines). The gene optix (red) controls the red color pattern (see Fig. 3 and SI Appendix, Fig. S5 E and F) and shows a steeper and west-shifted cline compared to WntA (yellow), which controls the number of forewing bands (Fig. 3). (B) Clines are mirrored at both optix (Left) and WntA (Right) loci between H. erato (filled circles and colored lines) and its H. melpomene comimic (empty circles and gray lines). (C) Emergence of a novel hybrid morph in the middle of the hybrid zone. Due to the displaced clines, hybrid H. erato butterflies (Left; orange symbols and lines; middle wings) can display the highland notabilis double band (Left; yellow) along with the lowland lativitta dennis and rays (Right; red). This hybrid morph carries homozygous WntAH/H and optixL/L genotypes and is therefore true breeding. Simulation results show the frequencies of the four morphs, assuming complete dominance at two loci. Morph i has fitness 1 + si (PiQI ), which increases linearly with its own frequency, Pi. Even when clines at the two loci start fully coincident, they can shift apart and produce displaced clines over time (here, generation 1,000), if there is a fitness advantage to one of the hybrid genotypes, here sA -; bb = 0.25, and the rest having si = 0.1.

References

    1. Barton N. H., Keightley P. D., Understanding quantitative genetic variation. Nat. Rev. Genet. 3, 11–21 (2002). - PubMed
    1. Seehausen O., et al. ., Genomics and the origin of species. Nat. Rev. Genet. 15, 176–192(2014). - PubMed
    1. Sella G., Barton N. H., Thinking about the evolution of complex traits in the era of genome-wide association studies. Annu. Rev. Genomics Hum. Genet. 20, 461–493(2019). - PubMed
    1. Tewhey R., Bansal V., Torkamani A., Topol E. J., Schork N. J., The importance of phase information for human genomics. Nat. Rev. Genet. 12, 215–223(2011). - PMC - PubMed
    1. Garud N. R., Messer P. W., Buzbas E. O., Petrov D. A., Recent selective sweeps in North American Drosophila melanogaster show signatures of soft sweeps. PLoS Genet. 11, e1005004(2015). - PMC - PubMed

Publication types