. 2021 Jun 22;118(25):e2017364118.
doi: 10.1073/pnas.2017364118.

Dissecting and modeling photic and melanopsin effects to predict sleep disturbances induced by irregular light exposure in mice

Affiliations

Dissecting and modeling photic and melanopsin effects to predict sleep disturbances induced by irregular light exposure in mice

Jeffrey Hubbard et al. Proc Natl Acad Sci U S A. .

Abstract

Artificial lighting, day-length changes, shift work, and transmeridian travel all lead to sleep-wake disturbances. The nychthemeral sleep-wake cycle (SWc) is known to be controlled by output from the central circadian clock in the suprachiasmatic nuclei (SCN), which is entrained to the light-dark cycle. Additionally, via intrinsically photosensitive retinal ganglion cells containing the photopigment melanopsin (Opn4), short-term light-dark alternations exert direct and acute influences on sleep and waking. However, the extent to which longer exposures typically experienced across the 24-h day exert such an effect has never been clarified or quantified, as disentangling sustained direct light effects (SDLE) from circadian effects is difficult. Recording sleep in mice lacking a circadian pacemaker, either through transgenesis (Syt10cre/creBmal1fl/- ) or SCN lesioning and/or melanopsin-based phototransduction (Opn4-/- ), we uncovered, contrary to prevailing assumptions, that the contribution of SDLE is as important as circadian-driven input in determining SWc amplitude. Specifically, SDLE were primarily mediated (>80%) through melanopsin, of which half were then relayed through the SCN, revealing an ancillary purpose for this structure, independent of its clock function in organizing SWc. Based on these findings, we designed a model to estimate the effect of atypical light-dark cycles on SWc. This model predicted SWc amplitude in mice exposed to simulated transequatorial or transmeridian paradigms. Taken together, we demonstrate this SDLE is a crucial mechanism influencing behavior on par with the circadian system. In a broader context, these findings mandate considering SDLE, in addition to circadian drive, for coping with health consequences of atypical light exposure in our society.

Keywords: circadian and noncircadian; melanopsin; photoperiods; phototransduction; sleep–wake cycle.


Conflict of interest statement

The authors declare no competing interest.

Figures

Fig. 1.
Fig. 1.
Melanopsin-based SDLE contributes to approximately one-third of the SWc amplitude. (A) Dynamics of the accumulated differences demonstrate that Opn4−/− mice lose 2 h of NREMS per day, with a maximum effect (1.5 h) during the light period (average of 2 consecutive days under LD12:12). (B) NREMS amount during light period under LD12:12 (Left) is decreased in Opn4−/− and similar to that during subjective light period under DD in both genotypes (Right). (C) SWc amplitude in Opn4+/+ and Opn4−/− mice under DD did not differ. These observations demonstrate that sleep loss during the light period and subsequent SWc amplitude decreases in Opn4−/− mice result from a lack of Opn4-based SDLE and not from a reduction in circadian signal. DD: sham Opn4+/+ n = 5; sham Opn4−/− n = 7. Asterisks denote significant post hoc differences after ANOVA between LD conditions (blue) and the genotype (red).
Fig. 2.
Fig. 2.
SCN-independent direct effects of light determine about one-quarter of SWc amplitude. (A) Effects of the L pulse administered during the habitual dark period (ZT 15 to 16) on c-Fos immunoreactivity in the SCN of the different mice genotypes. c-Fos immunoreactive cells are labeled in red and AVP immunoreactive cells in green. Light pulse– (+LP; at ZT 15 to 16) induced c-FOS immunoreactivity (red) in the SCN in (i) Syt10Cre/CreBmal1+/− controls. Light-induced c-Fos immunoreactivity was partially conserved in the retino-recipient (core) but absent in the clock output region (shell) in (iii) Syt10Cre/CreBmal1fl/- demonstrating the alteration of SCN response to photic information. No c-FOS induction was seen in the absence of a light pulse in both Syt10Cre/CreBmal1+/− controls (−LP; ii) and Syt10Cre/CreBmal1fl/- (−LP; iv). Moreover, in Syt10Cre/CreBmal1fl/-, AVP expression (a marker of clock output in the shell part of the SCN, green) is abolished in the SCN (v) (that remains structurally intact; vi: DAPI staining, gray) but not in surrounding areas (iiiv). AVP expression in the SCN is preserved in Syt10Cre/CreBmal1+/− (i, ii, and vii). (Scale bars, 100 µm in A, iiv, 500 µm in A, vvii.) (Bottom Right) Histogram represents quantification of light-induced c-FOS expression in SCN neurons (viii). The light pulse–induced c-Fos in the SCN in similar proportion in all control groups (Syt10Cre/CreBmal1+/−, WT). WT n = 6; Syt10Cre/CreBmal1+/− n = 8; and Syt10Cre/CreBmal1fl/- n = 6. Data are expressed as mean ± SEM. Two-way ANOVA: Plight pulse ≤ 0.001; Pgenotype ≤ 0.001, post hoc t test: *P < 0.05). Raw multichannel images are available (see ref. 40). (B) Difference in NREMS amounts between subjective light and dark periods (SW amplitude) under DD conditions in Syt10Cre/CreBmal1fl/- mice and their controls. SW amplitude of SCN-disabled mice (Syt10Cre/CreBmal1fl/-) did not significantly differ from zero confirming SW arrhythmicity in these mice. Values represent means ± SEM. (C) Time course of NREMS in SCNx, Syt10Cre/CreBmal1fl/-, and their controls for 2 d under LD12:12. (D) SWc amplitude under LD in SCN-invalidated mice and their controls (amplitude defined as the difference in NREMS amounts between light [day] and dark [night] periods, average of 2 consecutive d under LD12:12). The lack of a functional SCN/clock affects the SWc by reducing its amplitude by 1.8 h in SCNx mice (LD NREMS difference: 39 ± 13 min) and by 1.7 h in SCN-disabled mutants (LD NREMS difference: 40 ± 16 min). Immunohistochemistry experiments: n = 3 to 4 per group/condition. ECoG experiments: sham Opn4+/+ n = 9; SCNx Opn4+/+ n = 10; WT n = 7; Syt10Cre/CreBmal1+/− n = 7; and Syt10Cre/CreBmal1fl/- n = 10. Psi symbols denote Opn4 genotype post hoc differences, delta denote SCN condition post hoc difference, and beta denote Bmal1 versus control post hoc difference.
Fig. 3.
Fig. 3.
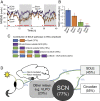
The SCN, beyond its clock function, mediates part of the sustained direct effects of light. (A) Time course of NREMS during LD12:12 showed sham and SCNx Opn4−/− mice were significantly different (two-way repeated measures ANOVA, group x time; P < 0.001) as the time course of NREMS over 24 hr is flattened. (B) SWc amplitude between sham and SCNx mice with or without melanopsin. SCNx Opn4−/− do not significantly differ from zero. (C) Intergroup differences in SWc amplitude to calculate percentage contributions to SWc amplitude of the different pathways involved. (D) Respective contribution (%) of the different pathways involved in shaping the SWc: contribution of CE versus SDLE (boxes), SCN versus other brain relays, and SDLE contribution mediated by melanopsin- (blue) versus rod/cones-based (green) photoreception (Materials and Methods). The red squares (line) in A represent significant post hoc differences between groups. Asterisks represent paired t test significance from sham WT mice. LD12:12: sham Opn4+/+ n = 9; sham Opn4−/− n = 7; SCNx Opn4+/+ n = 10; and SCNx Opn4−/− n = 8.
Fig. 4.
Fig. 4.
Prediction of nychthemeral NREMS distribution under simulated transequatorial and transmeridian jet lag. (A) Time course of NREMS in WT mice under 48 h of LD12:12 followed by 4 d under LD8:16, simulating a transequatorial travel, with observed values (blue; min/2 h) and predicted values (orange; min/2 h). (B) SWc amplitude from prediction (orange) and from recorded animals (blue) under baseline (first 2 d under LD12:12) followed by 4 d under LD8:16. (C) Time course of NREMS in WT mice under 48 h of LD12:12 followed by 7 d under a simulated 8-h westward “jet lag”. The predicted values of daily NREMS distribution (purple) based on the model integrating a shift of 1.1/12 h described in Fig. 3D, combining CE (blue) and SDLE (green), are shown. Daily NREMS distributions are obtained from sleep recordings (red) and are expressed as min/3 h. SH = shift (jet lag). (D) SWc amplitude under baseline (BL; LD12:12) and simulated 8-h westward and “jet lag” conditions across experimental (EXP) days. A linear regression of SWc amplitude is plotted to illustrate resynchronization to the new LD (R2 = 0.99). The values in red obtained from recorded animals perfectly fit the predicted values in purple (one-way repeated measures ANOVA, Pgroup x time = 0.28). The dashed line represents the average baseline value at 100%. All values represent mean ± SEM, LD8:16: n = 7; jet lag: n = 9.

References

    1. Bedrosian T. A., Nelson R. J., Influence of the modern light environment on mood. Mol. Psychiatry 18, 751–757 (2013). - PubMed
    1. Falbe J., et al. ., Sleep duration, restfulness, and screens in the sleep environment. Pediatrics 135, e367–e375 (2015). - PMC - PubMed
    1. Stephenson K. M., Schroder C. M., Bertschy G., Bourgin P., Complex interaction of circadian and non-circadian effects of light on mood: Shedding new light on an old story. Sleep Med. Rev. 16, 445–454 (2012). - PubMed
    1. Vandewalle G., Maquet P., Dijk D. J., Light as a modulator of cognitive brain function. Trends Cogn. Sci. 13, 429–438 (2009). - PubMed
    1. Kilic U., Hubbard J., Bourgin P., “Circadian rhythm sleep disorders, 5. Treatment” in Sleep Medicine Textbook, Bassetti C., Dogas Z., Peigneux P., Eds. (European Sleep Research Society, 2014), pp. 357–368.

Publication types