. 2021 Jun 22;118(25):e2020955118.
doi: 10.1073/pnas.2020955118.

Niche adaptation promoted the evolutionary diversification of tiny ocean predators

Affiliations

Niche adaptation promoted the evolutionary diversification of tiny ocean predators

Francisco Latorre et al. Proc Natl Acad Sci U S A. .

Abstract

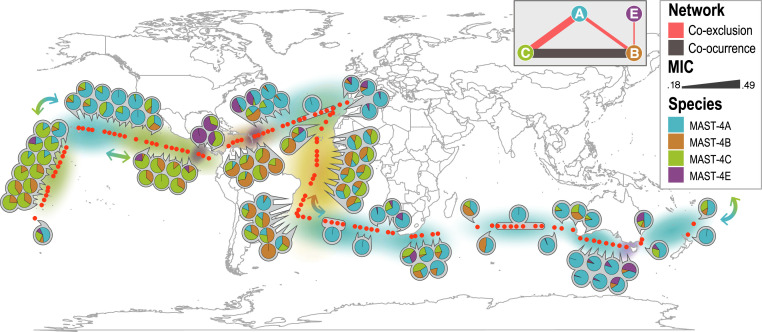
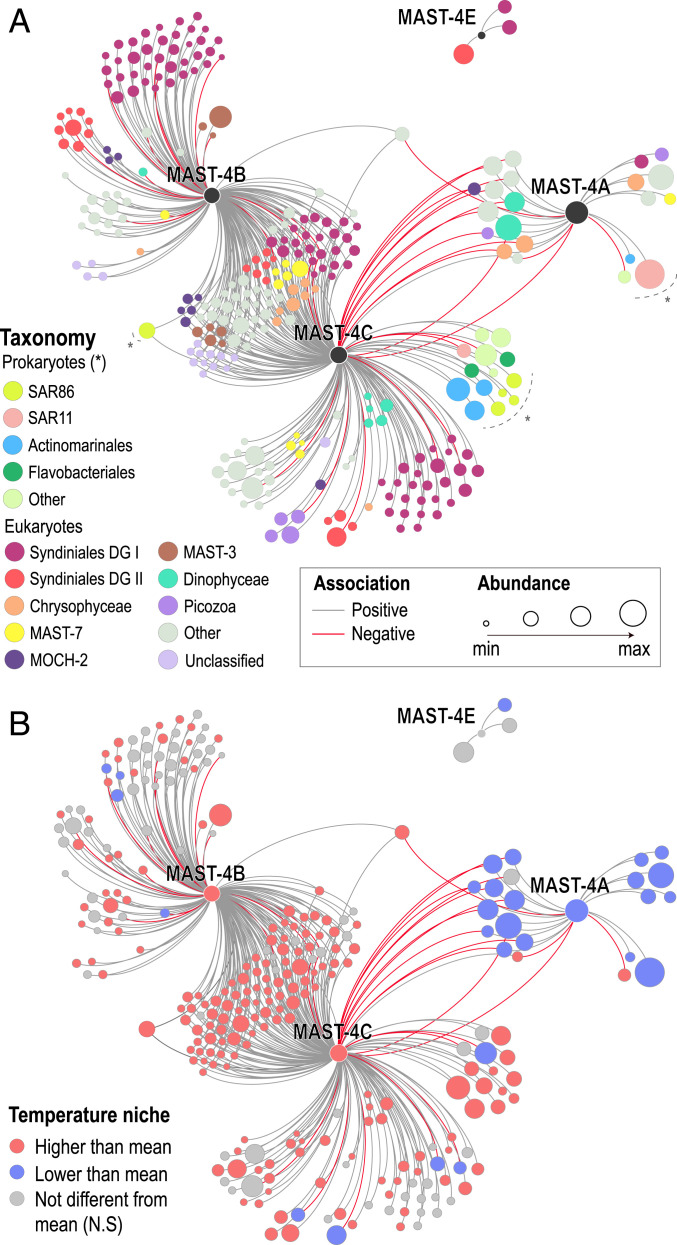
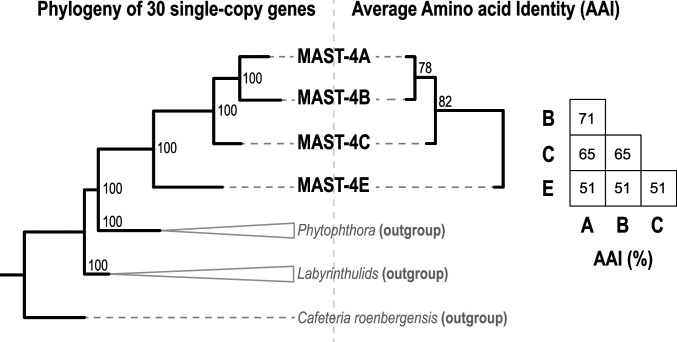
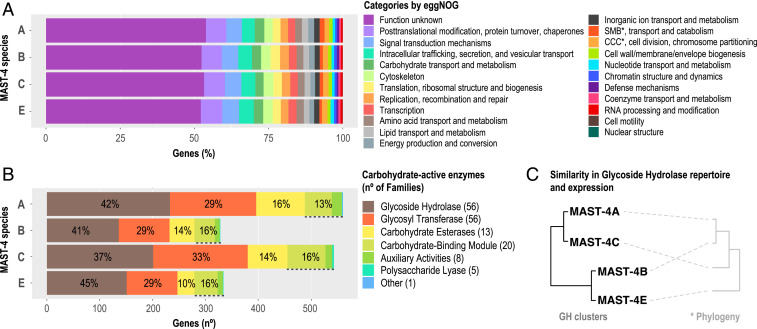
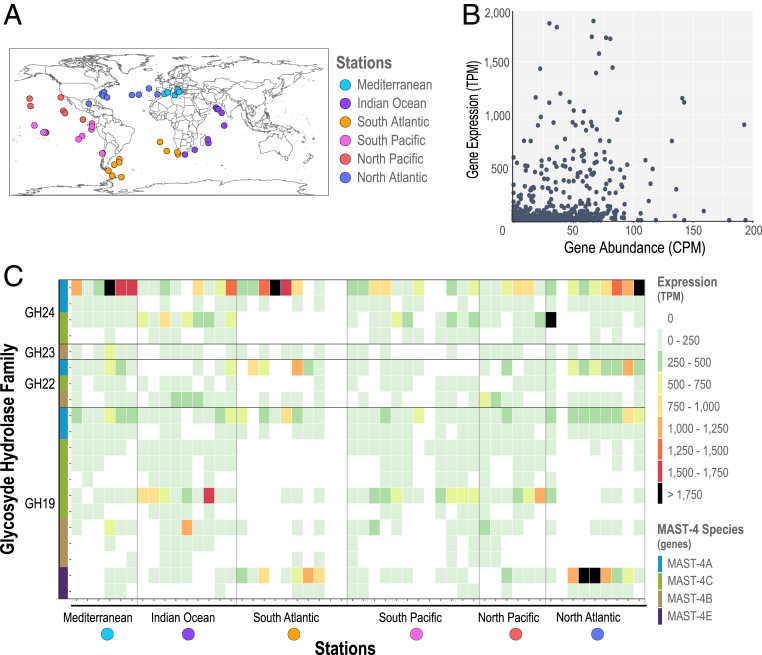
Unicellular eukaryotic predators play a crucial role in the functioning of the ocean ecosystem by recycling nutrients and energy that are channeled to upper trophic levels. Traditionally, these evolutionarily diverse organisms have been combined into a single functional group (heterotrophic flagellates), overlooking their organismal differences. Here, we investigated four evolutionarily related species belonging to one cosmopolitan group of uncultured marine picoeukaryotic predators: marine stramenopiles (MAST)-4 (species A, B, C, and E). Co-occurrence and distribution analyses in the global surface ocean indicated contrasting patterns in MAST-4A and C, suggesting adaptation to different temperatures. We then investigated whether these spatial distribution patterns were mirrored by MAST-4 genomic content using single-cell genomics. Analyses of 69 single cells recovered 66 to 83% of the MAST-4A/B/C/E genomes, which displayed substantial interspecies divergence. MAST-4 genomes were similar in terms of broad gene functional categories, but they differed in enzymes of ecological relevance, such as glycoside hydrolases (GHs), which are part of the food degradation machinery in MAST-4. Interestingly, MAST-4 species featuring a similar GH composition (A and C) coexcluded each other in the surface global ocean, while species with a different set of GHs (B and C) appeared to be able to coexist, suggesting further niche diversification associated with prey digestion. We propose that differential niche adaptation to temperature and prey type has promoted adaptive evolutionary diversification in MAST-4. We show that minute ocean predators from the same phylogenetic group may have different biogeography and genomic content, which needs to be accounted for to better comprehend marine food webs.

Keywords: MAST-4; biogeography; ecoevolution; phagocytosis; protists.


Conflict of interest statement

The authors declare no competing interest.

Figures

Fig. 1.
Fig. 1.
Distribution of MAST-4A/B/C/E species in the surface global ocean as inferred by OTUs based on the 18S rRNA gene (V4 region). Red dots show Malaspina stations while pie charts indicate the relative abundance of MAST-4 species at each station. (Top Right, Inset) The network shows the association patterns between each MAST-4 species as measured using MIC analyses. The width of the edges in the network shows association strength as indicated in the legend (MIC). Background color shows the most abundant MAST-4 species in the region. Arrows point to areas with an important switch of the abundant species; note that the most abundant species, A and C, alternate predominance in large oceanic regions.
Fig. 2.
Fig. 2.
Association network including MAST-4 species, associated prokaryotes, and other picoeukaryotes from the Malaspina expedition. Only OTUs with abundances >100 reads and occurrences >15% of the stations were considered in MIC analyses. A filtering strategy was applied to remove indirect (i.e., environmentally driven) and weak associations (Methods). Node size is proportional to the centered log-ratio transformed abundance sum (Methods). (A) Nodes are colored based on taxonomy. Legend: DG, Dino-Group. (B) Node color indicates whether specific OTUs displayed weighted mean temperatures significantly lower or higher than the unweighted mean temperature (24.5 °C), pointing to species with temperature distributions that differ from chance. Note that MAST-4A and both MAST-B/C tend to show co-occurrences with other OTUs that display coherent temperature preferences. N.S, not significant.
Fig. 3.
Fig. 3.
Evolutionary divergence between the studied MAST-4. (Left) MAST-4 species phylogeny based on 30 single-copy protein genes from the BUSCO v3 eukaryota_odb9 database that were identified in the coassemblies (Methods and Dataset S3). (Right) Clustering of MAST-4 coassembled genomes and bootstrap support based on the AAI between predicted homologous genes. AAI values (%) between MAST-4 species are shown in the matrix.
Fig. 4.
Fig. 4.
Functional profile of MAST-4 genes according to eggNOG and CAZy. Total MAST-4 genes analyzed were 15,508, 10,019, 16,260, and 9,042 for species A, B, C, and E, respectively. (A) eggNOG annotations indicated as percentage of genes falling into functional categories. SMB, Secondary Metabolites Biosynthesis; CCC, Cell Cycle Control. (B) Number of MAST-4 genes within CAZy categories and the corresponding percentage. The number of gene families considered within each CAZy category is indicated between parenthesis in the panel legend. (C) Clustering of MAST-4 species using Manhattan distances based on either their GH composition or the GH expression (in transcripts per million) results in the same clustering pattern. Note that MAST-4C and A are more similar in their GH content than E and B, which are more similar between themselves. *A schematic representation of the phylogeny of the studied MAST-4 is shown for comparison purposes (see Fig. 3 for more details).
Fig. 5.
Fig. 5.
Expression and abundance of GHs in MAST-4A/B/C/E in the upper global ocean. (A) Geographic location of the metagenomic and metatranscriptomic samples from Tara Oceans. (B) Gene abundance versus expression using normalized data for each gene and station. Note that the axes have different but proportional ranges of values. (C) Heatmap of the GH families in MAST-4 that had the highest expression. Samples are in the x-axis, grouped by ocean region and ordered following the expedition’s trajectory. Genes in the y-axis are organized by family, and each species is indicated with a color. GH22, GH23, and GH24 are families of lysozymes, and GH19 is a family of chitinases that can also act as lysozyme in some organisms.

References

    1. Field C. B., Behrenfeld M. J., Randerson J. T., Falkowski P., Primary production of the biosphere: Integrating terrestrial and oceanic components. Science 281, 237–240 (1998). - PubMed
    1. Li W. K. W., Primary production of prochlorophytes, cyanobacteria, and eucaryotic ultraphytoplankton: Measurements from flow cytometric sorting. Limnol. Oceanogr. 39, 169–175 (1994).
    1. Worden A. Z., et al. ., Rethinking the marine carbon cycle: Factoring in the multifarious lifestyles of microbes. Science 347, 1257594 (2015). - PubMed
    1. Pernthaler J., Predation on prokaryotes in the water column and its ecological implications. Nat. Rev. Microbiol. 3, 537–546 (2005). - PubMed
    1. Massana R., et al. ., Grazing rates and functional diversity of uncultured heterotrophic flagellates. ISME J. 3, 588–596 (2009). - PubMed

Publication types

Substances

LinkOut - more resources