Observational Study
. 2021 Jun 21;11(6):118.
doi: 10.1038/s41408-021-00510-7.

Impact of early response on outcomes in AL amyloidosis following treatment with frontline Bortezomib

Affiliations
Observational Study

Impact of early response on outcomes in AL amyloidosis following treatment with frontline Bortezomib

Sriram Ravichandran et al. Blood Cancer J. .

Abstract

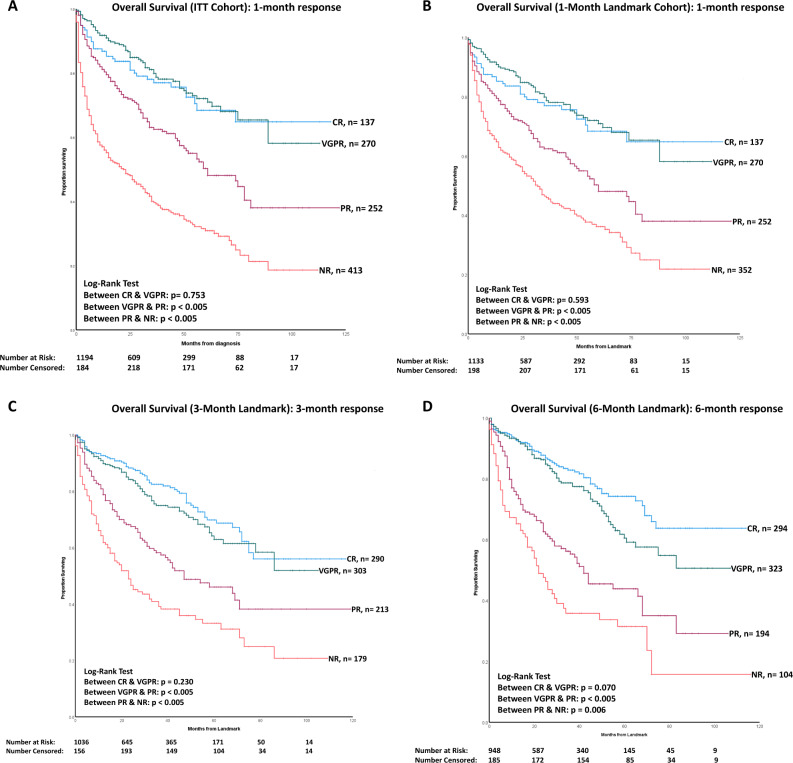
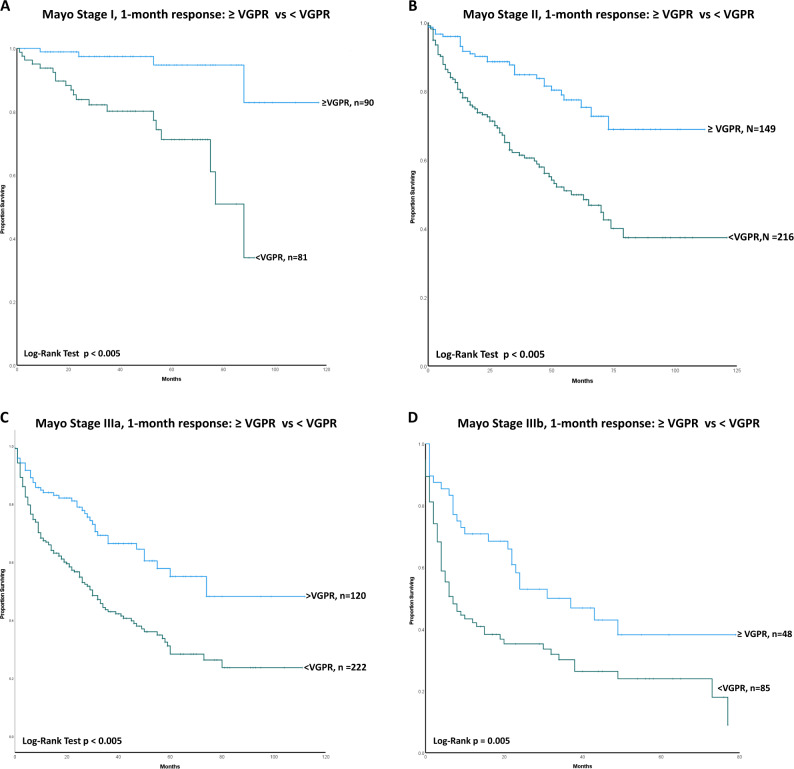
The outcomes in systemic AL amyloidosis are dependent on the depth of haematologic response. However, there is limited data on the impact of the speed of response on outcomes. Here we report the impact of speed of response in a cohort of AL patients treated with upfront Bortezomib. Patients seen from February 2010 until August 2019 are included in the present analysis. 1194 & 1133 patients comprised the ITT and 1-month landmark cohorts. In the landmark cohort, 137 (11.5%), 270 (22.6%), 252 (21.1%) and 352 (31.1%) patients had a CR, VGPR, PR and NR at 1-month. Patients with ≥ VGPR at 1-month had significantly better survival (median not reached; at the end of 1, 2, 5,10 years, 87%/92%, 83%/87%, 68%/72% and 63%/58% of patients in CR/VGPR, respectively, were alive) compared to those with a PR (median OS 60 months) or NR (median OS 32 months) (p < 0.005). At 1-month, patients with CR and iFLC < 20 mg/l had a significantly better survival compared to CR and iFLC > 20 mg/l (p = 0.005). Reaching ≥ VGPR at 1-month significantly improved survival in all Mayo disease stages. In conclusion, patients achieving an early deep haematologic response have a significantly superior survival irrespective of cardiac involvement.


Conflict of interest statement

A.D.W. has received honoraria from Janssen, GSK, Celgene, and Takeda. The other authors do not have any conflict of interest to disclose.

Figures

Fig. 1
Fig. 1. This figure shows the flow of patients in the study and responses acheived at different time points in the study.
A Consort diagram. 1276 patients were treated with upfront Bortezomib from Feb 2010 to Aug 2019. 82/1276 (6.4%) had dFLC < 20 mg/l and are excluded from the analysis. There are 1194, 1133, 1038, and 948 patients in the ITT, 1-month, 3-month and 6-month landmark cohorts. B Shows the haematologic responses 1 month, 3 months and 6 months. In the ITT cohort 137 (11.5%), 270 (22.6%), 252 (21.1%) and 413 (34.6%) patients had a CR, VGPR, PR and NR at 1 month, respectively. There was a progressive improvement in the proportion of patients with a deeper response (≥ VGPR) from 34.1% at one month to 57.1% and 65% at 3 and 6 months, respectively.
Fig. 2
Fig. 2. This figure shows overall survival for the intention to treat (ITT), 1 month, 3 months and 6 months landmark cohorts stratified by depth of haematologic response.
A Kaplan–Meier curve showing the impact of 1-month haematologic response on OS in the ITT cohort. There was no significant difference in survival between CR and VGPR at 1 month—median not reached in both groups (p = 0.753). 87%, 83%, 68% and 63% of patients with a CR at 1 month were alive at the end of 1, 2, 5 and 10 years, respectively. 92%, 87%, 71% and 59% of patients with a VGPR at 1 month were alive at the end of 1, 2, 5 and 10 years, respectively. In contrast, the median OS of patients with PR and NR at 1 month was 61 months (95% CI 43.42–78.57 months, p < 0.005), and 22 months (95% CI 14.54–29.45 months, P < 0.005), respectively. B Kaplan–Meier curve showing the impact of 1-month haematologic response on OS in the 1-month landmark cohort. There was no significant difference in survival between CR and VGPR at 1 month—median not reached in both groups (p = 0.593). 87%, 83%, 68% and 63% of patients with a CR at 1 month were alive at the end of 1, 2, 5 and 10 years (from landmark point), respectively. 92%, 87%, 72% and 58% of patients with a VGPR at 1 month were alive at the end of 1, 2, 5 and 10 years (from landmark point), respectively. In contrast, the median OS of patients with PR and NR at 1 month was 60 months (95% CI 42.42–77.57 months, p < 0.005) and 32 months (95% CI 25.36–38.63 months, P < 0.005), respectively. C Kaplan–Meier curve showing overall survival based on the haematologic response at 3 months in the 3-month landmark cohort. There was no significant difference in survival between CR and VGPR at 3 months—median not reached in both groups (p = 0.230). 93%, 88%, 69% and 55% of patients with a CR at 3 months were alive at the end of 1, 2, 5 and 10 years (from landmark point), respectively. 91%, 84%, 65% and 51% of patients with a VGPR at 3 months were alive at the end of 1, 2, 5 and 9 years (from landmark point), respectively. In contrast, the median OS of patients with PR and NR at 3 months was 47 months (95% CI 27.51–66.48 months, p < 0.005) and 23 months (95% CI 15.93–30.06 months, p < 0.005), respectively. D Kaplan–Meier curve showing overall survival based on the haematologic response at 6 months in the 6-month landmark cohort. There was no significant difference in survival between CR and VGPR at 6 months—median not reached in both groups (p = 0.070). 93%, 88%, 74% and 63% of patients with a CR at 6 months were alive at the end of 1, 2, 5 and 10 years (from landmark point), respectively. 93%, 86%, 61% and 51% of patients with a VGPR at 6 months were alive at the end of 1, 2, 5 and 10 years (from landmark point), respectively. In contrast, the median OS of patients with PR and NR at 6 months was 42 months (95% CI 27.91–56.09 months, p < 0.005) and 22 months (95% CI 16.39–27.60 months, p = 0.006), respectively.
Fig. 3
Fig. 3. This figure shows patients acheiving a deep light chains suppresion (dFLC <10 mg/L or iFLC <20 mg/L) and outcomes stratified by deep light chain suppression (or not).
A Shows the distribution of patients with CR/VGPR and deep FLC suppression (dFLC < 10 mg/l or iFLC < 20 mg/l) at 1 and 6 months. At 1 month, 60.6% and 39.3% patients with CR and VGPR had dFLC < 10 mg/l, respectively. The corresponding figures at 6 months were 85.7% and 48.6%, respectively. 34.3% and 33% of patients with CR and VGPR had iFLC < 20 mg/l at 1 month. The corresponding figure at 6 months is 60.2% and 35%, respectively. B Kaplan–Meier curve showing the impact of low iFLC (< 20 mg/l) on patients with CR at 1-month. Patients with CR and iFLC < 20 mg/l at 1-month had significantly better survival compared to patients with CR and iFLC > 20 mg/l- median not reached in both groups (p = 0.005). C Kaplan–Meier curve showing the impact of dFLC < 10 mg/l in patients with CR/VGPR at 6 months. There was no significant difference in survival between patients with CR + dFLC < 10 mg/l and VGPR + dFLC < 10 mg/l—median not reached in both groups (p = 0.693). Patients with VGPR + dFLC < 10 mg/l had a significantly better survival when compared to patients with CR and dFLC > 10 mg/l (p = 0.002)—median not reached vs. 72 months (95% CI 38.94–105.05 months). There was no significant difference in survival between patients with CR + dFLC > 10 mg/l and VGPR + dFLC > 10 mg/l (p = 0.454)—median 72 months (95% CI 38.94–105.05 months) vs. 61 months (95% CI 38.07-83.93 months). D Kaplan–Meier curve showing the impact of iFLC < 20 mg/l in patients with CR/VGPR at 6 months. There was no significant difference in survival between patients with CR + iFLC < 20 mg/l and VGPR + iFLC < 20 mg/l—median not reached in both groups (p = 0.683). Patients with VGPR + iFLC < 20 mg/l had a significantly better survival when compared to patients with CR and iFLC > 20 mg/l (p = 0.005)—median not reached vs. 74 months (95% CI 65.60–82.40). There was no significant difference in survival between patients with CR + iFLC > 20 mg/l and VGPR + iFLC > 20 mg/l (p = 0.818)—median 74 months (95% CI 65.60–82.40) vs. 65 months (95% CI 46.81–83.18 months).
Fig. 4
Fig. 4. This figure shows the impact of early response on survival stratified by baseline disease (Mayo) stage showing an improvement in outcomes with deeper responses across all stages.
A Kaplan–Meier curve showing overall survival of Mayo stage 1 patients, stratified by their haematologic response at 1 month (≥ VGPR vs < VGPR). The median OS of patients with ≥ VGPR was not reached when compared to 88 months (95% CI 72.65–103.35 months) in patients with < VGPR (P < 0.005). B Kaplan–Meier curve showing overall survival of Mayo stage 2 patients, stratified by their haematologic response at 1 month (≥ VGPR vs < VGPR). The median OS of patients with ≥ VGPR was not reached when compared to 58 months (95% CI 41–74.99 months) in patients with < VGPR (P < .005). C Kaplan–Meier curve showing overall survival of Mayo stage 3 patients, stratified by their haematologic response at 1 month (≥ VGPR vs < VGPR). The median OS of patients with ≥ VGPR was median 74 months when compared to 30 months (95% CI 23.69–36.30 months) in patients with < VGPR (P < 0.005). D Kaplan–Meier curve showing overall survival of Mayo stage 3B patients, stratified by their haematologic response at 1 month (≥ VGPR vs < VGPR). The median OS of patients with ≥ VGPR was 31 months (95% CI 11.05–50.95 months) when compared to 7 months (95% CI 3.03–10.96 months) in patients with < VGPR (P < 0.005).

References

    1. Dispenzieri A, Gertz MA, Kyle RA, Lacy MQ, Burritt MF, Therneau TM, et al. Serum cardiac troponins and N-terminal Pro-Brain natriuretic peptide: a staging system for primary systemic amyloidosis. J. Clin. Oncol. 2004;22:3751–7. doi: 10.1200/JCO.2004.03.029. - DOI - PubMed
    1. Ravichandran S, Lachmann HJ, Wechalekar AD. Epidemiologic and survival trends in amyloidosis, 1987–2019. N. Engl. J. Med. 2020;382:1567–8. doi: 10.1056/NEJMc1917321. - DOI - PubMed
    1. Palladini G, Dispenzieri A, Gertz MA, Kumar S, Wechalekar A, Hawkins PN, et al. New criteria for response to treatment in immunoglobulin light chain amyloidosis based on free light chain measurement and cardiac biomarkers: impact on survival outcomes. J. Clin. Oncol. 2012;30:4541–9. doi: 10.1200/JCO.2011.37.7614. - DOI - PubMed
    1. Manwani R, Cohen O, Sharpley F, Mahmood S, Sachchithanantham S, Foard D, et al. A prospective observational study of 915 patients with systemic AL amyloidosis treated with upfront bortezomib. Blood. 2019;134:2271–80. doi: 10.1182/blood.2019000834. - DOI - PubMed
    1. Godara A, Toskic D, Rosenthal B, Varga C, Kugelmass A, Zhou P, et al. In systemic light-chain amyloidosis complete and very good partial responses are not enough: involved free light chain (iFLC) Levels < 10mg/L are associated with optimal long-term survival. Blood. 2019;134:4369. doi: 10.1182/blood-2019-127004. - DOI

Publication types