Comparative Study
. 2021 Jun 21;12(1):3820.
doi: 10.1038/s41467-021-23919-x.

Composition and stage dynamics of mitochondrial complexes in Plasmodium falciparum

Affiliations
Comparative Study

Composition and stage dynamics of mitochondrial complexes in Plasmodium falciparum

Felix Evers et al. Nat Commun. .

Abstract

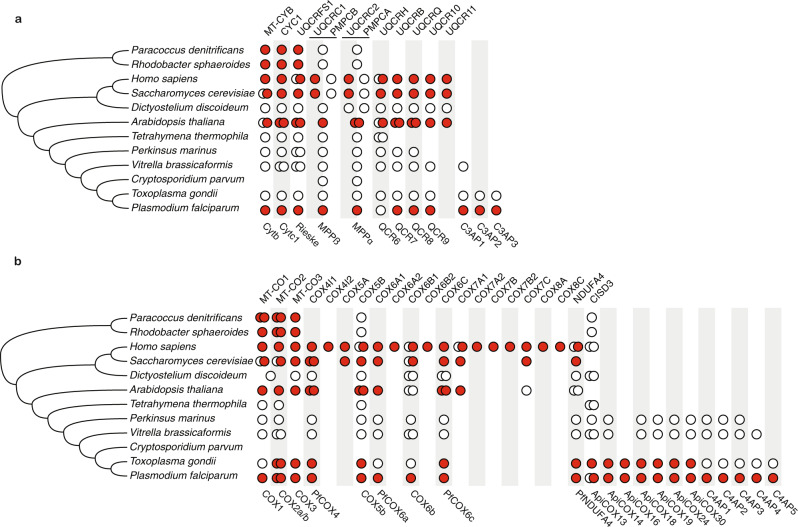
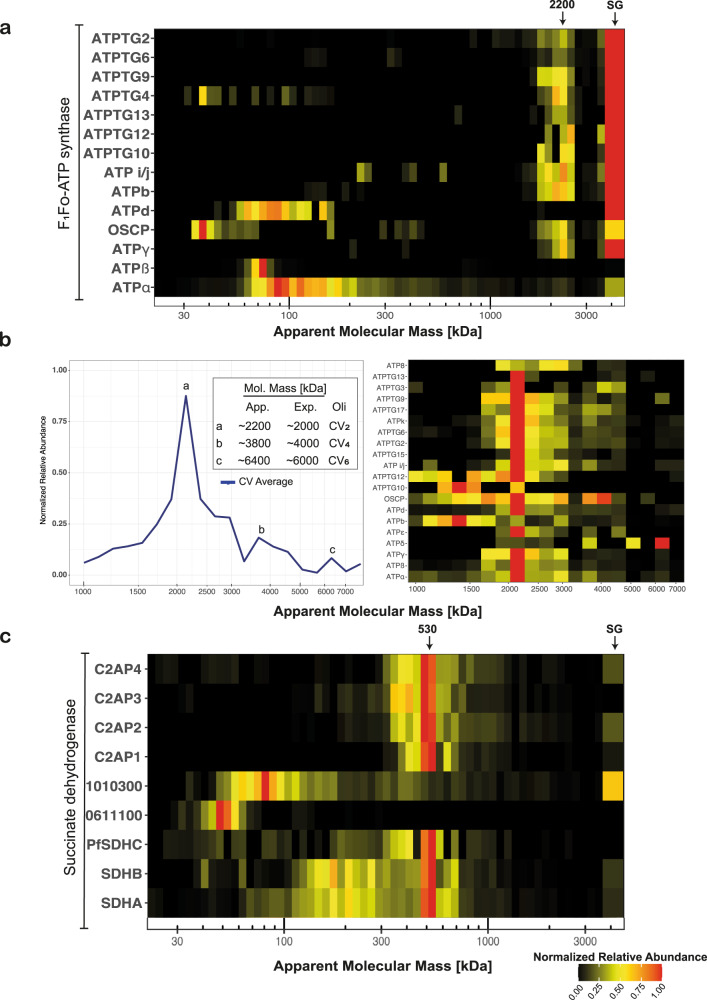
Our current understanding of mitochondrial functioning is largely restricted to traditional model organisms, which only represent a fraction of eukaryotic diversity. The unusual mitochondrion of malaria parasites is a validated drug target but remains poorly understood. Here, we apply complexome profiling to map the inventory of protein complexes across the pathogenic asexual blood stages and the transmissible gametocyte stages of Plasmodium falciparum. We identify remarkably divergent composition and clade-specific additions of all respiratory chain complexes. Furthermore, we show that respiratory chain complex components and linked metabolic pathways are up to 40-fold more prevalent in gametocytes, while glycolytic enzymes are substantially reduced. Underlining this functional switch, we find that cristae are exclusively present in gametocytes. Leveraging these divergent properties and stage dynamics for drug development presents an attractive opportunity to discover novel classes of antimalarials and increase our repertoire of gametocytocidal drugs.


Conflict of interest statement

The authors declare no competing interests.

Figures

Fig. 1
Fig. 1. Representative electron micrographs of Plasmodium falciparum blood stages.
Enlarged sections show ultrastructural differences between the mitochondrion (magenta arrow) in ABS parasites and gametocytes. The mitochondrion presents as an electron-lucent, acristate structure during ABS development, while the gametocyte mitochondrion appears electron-dense and packed with tubular cristae. Also note the close proximity of the four-membrane-bound apicoplast (light-blue arrow) in ring- and schizont-stage parasites. Scale bar ring-stage parasite higher magnification crop, 0.5 μm; all other scale bars, 1 µm. In total, three independent ABS samples and three independent gametocyte samples were imaged and observations were consistent across all.
Fig. 2
Fig. 2. Migration profiles of proteins associated with previously described complexes.
Common eukaryotic and parasite-specific protein complexes identified in mitochondrially enriched fractions of P. falciparum. a Putative EMC components, representative heatmap from sample ABS3D. All detected EMC components comigrate at an Mrapp. of ~530 kDa. b Proteasome components, representative heatmap from sample ABS3D. 20S components comigrate at an Mrapp. of ~690 kDa and to a lesser degree at ~880 kDa. 19S regulatory components comigrate at two distinct sizes, a major proportion at ~1600 kDa and a smaller fraction at ~600 kDa. c RhopH complex, representative heatmap from sample ABS1Da. PF3D7_0220200 (RhopHA1) shared RhopH complex pattern consistently and thus was putatively assigned to the RhopH complex. d LAP complex, representative heatmap from sample GCT1Da. LAP complex components in gametocytes migrated as two distinct subcomplex consisting of LAP1-3 (~460 kDa) and LAP4-5 (~310 kDa), respectively. In addition, a faint putative assembly intermediate consisting of LAP2 and LAP3 was observed at ~310 kDa. e PTEX, representative heatmap (upper panel) and line chart of iBAQ values in the 750–4000 kDa mass range from sample ABS1Da. The PTEX complex including auxiliary subunits can be observed to comigrate at an Mrapp. of ~2.8 MDa. Due to the high proportion of EXP2 present as the homooligomeric EXP2 complex at ~565 kDa, membership is only evident when comparing absolute intensity values (lower panel) instead of normalized abundances (heatmap). PTEX88 and TRX2 have much lower intensities in this mass range than core components. SG stacking gel. Corresponding Gene IDs can be found in Supplementary Data 1.
Fig. 3
Fig. 3. Migration and relative abundance of canonical and putatively associated components of respiratory chain complexes III and IV.
An abundance of 1 (red) represents the highest iBAQ value for a given protein between both samples. a Heatmap showing comigration of canonical CIII components as well as putative novel components migrating at an Mrapp. of ~730 kDa in ABS parasites (left) and gametocytes (right) respectively. b Heatmap showing comigration of canonical CIV components as well as putative novel components migrating at an Mrapp. of ~570 kDa as well as relative abundance in ABS parasites (left) and gametocytes (right). c For detailed analysis of higher-order assemblies, intensity values at Mrapp. >750 kDa were renormalized and visualized in a lineplot. Different putative supercomplexes were observed in ABS parasites and gametocytes, denoted with lettering and described in the graph inlet. App. approximate molecular mass based on migration profile, Exp. expected molecular mass based on composition observed in this study, SC supercomplex, CIII2 obligatory CIII dimer, CIII4 association of two CIII dimers, CIV CIV monomer, CIV2 CIV dimer.
Fig. 4
Fig. 4. Evolution of complex III and IV subunit composition in model species and in the lineage leading to Plasmodium falciparum.
The subunit compositions of complex III (a) and complex IV (b) are based on data from model species and proteins from P. falciparum found to comigrate with that complex in this study. Colours depict levels of evidence (red, experimental evidence; white, genomic evidence) linking the subunit to the enzyme. Double circles represent the presence of paralogues and their colour indicates experimental evidence linking them to the complex. For PMPCA/UQCRC2 and PMPCB/UQCRC1, in cases where there has not been a gene duplication, the protein is indicated in the middle between the two columns. Human gene symbols are shown on top; P. falciparum gene names are shown below the conservation matrix.
Fig. 5
Fig. 5. Composition and apparent molecular mass of succinate dehydrogenase (CII) and ATP synthase (CV) in Plasmodium falciparum gametocytes.
a Heatmap showing migration patterns of canonical ATP synthase components as well as components identified in T. gondii in sample GCT3D. Most components show comigration at a size band from 2–3 MDa as well as abundance in the stacking gel interface (rightmost slice). ATPd, ATPβ, OSCP and ATPα appear to be most abundant at their respective monomeric sizes. b Heatmap and lineplot showing migration pattern of putative ATP synthase components in 3-16% MDa profiles. Inlet of lineplot describes putatively assigned di- (a), tetra- (b), and hexamer (c) states. c Heatmap showing SDHA and SDHB comigrating at an Mrapp. of ~530 kDa along with a group of putative novel components. Previously assigned proteins (PF3D7_1010300 and PF3D7_0611100) were not found to be comigrating. Stacking gel (SG) is represented broader in the heatmap and indicated with a black arrow.
Fig. 6
Fig. 6. Relative quantification of respiratory chain complex components.
Relative abundance expressed in proportion of iBAQ of OXPHOS components in ABS parasites (black) and gametocytes (grey). Data are based on denatured whole-cell lysates separated by SDS-PAGE and analyzed by label-free quantitative MS. Fold differences are indicated next to each bar and for each complex a mean ± SD are indicated below dashed lines. Infinite fold changes were arbitrarily treated as 100 for mean/SD calculations. a Putative components of CII. b Putative components of CIII. c Putative components of CV. d Putative components of CIV.
Fig. 7
Fig. 7. Abundance comparison of energy metabolism-related proteins.
Relative quantification of a selection of energy metabolism enzymes (a, b, d) and mitochondrial household proteins (c) in ABS parasites (black) and gametocytes (grey) based on denatured whole-cell lysates separated by SDS-PAGE. Fold changes are indicated next to each bar and averages with standard deviation for a group are indicated below dashed lines. Corresponding Gene IDs can be found in Source data.

References

    1. Vaidya AB, Mather MW. Mitochondrial evolution and functions in malaria parasites. Annu. Rev. Microbiol. 2009;63:249–267. doi: 10.1146/annurev.micro.091208.073424. - DOI - PubMed
    1. Vaidya AB, Akella R, Suplick K. Sequences similar to genes for two mitochondrial proteins and portions of ribosomal RNA in tandemly arrayed 6-kilobase-pair DNA of a malarial parasite. Mol. Biochem. Parasitol. 1989;35:97–107. doi: 10.1016/0166-6851(89)90112-6. - DOI - PubMed
    1. Srivastava IK, Morrisey JM, Darrouzet E, Daldal F, Vaidya AB. Resistance mutations reveal the atovaquone-binding domain of cytochrome b in malaria parasites. Mol. Microbiol. 1999;33:704–711. doi: 10.1046/j.1365-2958.1999.01515.x. - DOI - PubMed
    1. Painter HJ, Morrisey JM, Mather MW, Vaidya AB. Specific role of mitochondrial electron transport in blood-stage Plasmodium falciparum. Nature. 2007;446:88–91. doi: 10.1038/nature05572. - DOI - PubMed
    1. Ke H, et al. Genetic investigation of tricarboxylic acid metabolism during the Plasmodium falciparum life cycle. Cell Rep. 2015;11:164–174. doi: 10.1016/j.celrep.2015.03.011. - DOI - PMC - PubMed

Publication types

MeSH terms

Substances

LinkOut - more resources