. 2021 Jun 21;12(1):3596.
doi: 10.1038/s41467-021-23816-3.

ERRγ enhances cardiac maturation with T-tubule formation in human iPSC-derived cardiomyocytes

Affiliations

ERRγ enhances cardiac maturation with T-tubule formation in human iPSC-derived cardiomyocytes

Kenji Miki et al. Nat Commun. .

Abstract

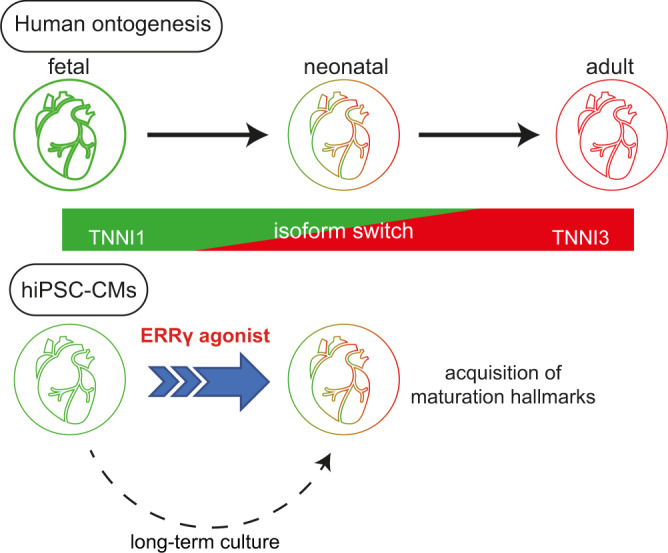
One of the earliest maturation steps in cardiomyocytes (CMs) is the sarcomere protein isoform switch between TNNI1 and TNNI3 (fetal and neonatal/adult troponin I). Here, we generate human induced pluripotent stem cells (hiPSCs) carrying a TNNI1EmGFP and TNNI3mCherry double reporter to monitor and isolate mature sub-populations during cardiac differentiation. Extensive drug screening identifies two compounds, an estrogen-related receptor gamma (ERRγ) agonist and an S-phase kinase-associated protein 2 inhibitor, that enhances cardiac maturation and a significant change to TNNI3 expression. Expression, morphological, functional, and molecular analyses indicate that hiPSC-CMs treated with the ERRγ agonist show a larger cell size, longer sarcomere length, the presence of transverse tubules, and enhanced metabolic function and contractile and electrical properties. Here, we show that ERRγ-treated hiPSC-CMs have a mature cellular property consistent with neonatal CMs and are useful for disease modeling and regenerative medicine.


Conflict of interest statement

Y.Y. received research expense from Takeda Pharmaceutical Company, Ltd, and K.D., S.K., S.C.N., S.I, T.M., T.A., N.T., K.I., T.N. are employees of Takeda Pharmaceutical Company, Ltd. K.M., S.K., and Y.Y. are the inventors of the patent application (WO2019/189554). The other authors declare no competing interests.

Figures

Fig. 1
Fig. 1. Generation of the hiPSC TNNI1EmGFP and TNNI3mCherry dual reporter.
a Schematic for the construction of the reporter cell line and the homologous recombination strategy using the CRISPR/Cas9 system. FAM (6-carboxyfluorescein) and VIC (VIC™ fluorescent dye) are fluorescent probes for ddPCR. b Schematic representation of the TNNI1EmGFP and TNNI3mCherry dual reporter during cardiac differentiation. c ddPCR (FAM probe, formula image blue bars; VIC probe, formula image green bars) of TNNI1EmGFP knock-in clones before and after treatment with piggyBac transposase. d Phase-contrast and EmGFP fluorescence images of hiPSCs (#4-12-20) and day-14 EBs. Scale bars: 500 μm. e Flow cytometric analysis and sorting on day 14 of the differentiation for EmGFP+ cells (top) and the EmGFP+-derived cTNT+ cell fraction (bottom). f Karyotype of the generated TNNI1-EmGFP knockin clone #4-12-20.
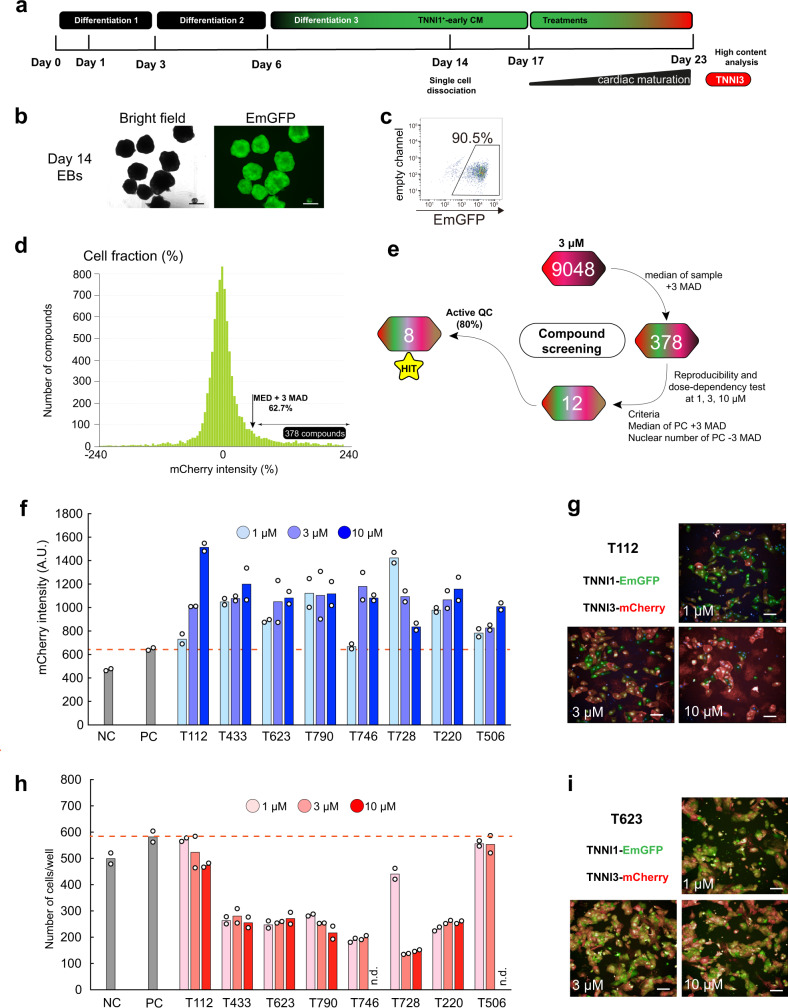
Fig. 2
Fig. 2. Molecular screening for TNNI3mCherry expression.
a Schematic representation of the cardiac differentiation protocol for cardiac maturation monitoring. b Bright field (left) and EmGFP fluorescence (right) images of day-14-derived EBs. Scale bars: 500 μm. c Flow cytometric analysis of day-14-derived EBs for TNNI1EmGFP. d Compounds were selected by the median (MED) plus 3 MAD. e Screening outline of the chemical compounds. f High content imaging for mCherry dose-dependency intensity. n = 2 biologically independent samples per group. g Dose-dependent T112-derived fluorescence for TNNI1EmGFP and TNNI3mCherry. Scale bars: 100 μm. h Dose-dependent cell number per well after treatment. n.d. not detected. n = 2 biologically independent samples per group. i Dose-dependent T623-derived fluorescence for TNNI1EmGFP and TNNI3mCherry. Scale bars: 100  μm.
Fig. 3
Fig. 3. T112 and T623 enhanced the cardiac maturation of hiPSC-CMs.
a Fluorescence images of day-16-derived EBs for TNNI1EmGFP and TNNI3mCherry expression. Scale bars: 500 μm. NT no treatment, PC positive control. b Flow cytometric analysis of day-16-derived cells for TNNI3mCherry expression. n = 3 independent experiments per group. Data are the mean ± SEM; ****P < 0.0001 compared to DMSO using one-way ANOVA followed by Dunnett’s test. NT no treatment, PC positive control. c Principal-component analysis (PCA) in correlation with the maturation of CMs for more than 58,000 genes expressed in the four groups. Data are shown as average PCA for each group. n = 3 independent experiments per group. d Sample correlation matrix resulting from the consensus clustering analysis of mRNA data and showing transcriptomic differences among treatments. Data are shown as averages for each group. n = 3 independent experiments per group. e Volcano plots for DE genes in accordance with the cardiac maturation phenotype. f Summary of upregulated DE genes in either T623/T112-treated CMs or Combo-treated CMs compared to DMSO. The number of upregulated genes (at least 2-fold) is depicted. Left: 344 unique elements detected in the T623-treated CMs compared to DMSO. Middle: 947 unique elements detected in the T112-treated CMs compared to DMSO. Right: 1254 unique elements detected in the Combo-treated CMs compared to DMSO. g Analysis of the top-6 cardiac-related significant GO terms for the cellular components of T623-, T112- and Combo-treated CMs.
Fig. 4
Fig. 4. Transcriptomic pathways and gene sets enrichment.
a Reactome pathway analysis for T623-, T112- and Combo-treated CMs. Enriched pathways were calculated using the binomial test over DE genes between individual conditions compared to DMSO. The top 15 statistically significant pathways are listed. P-values are displayed as logarithmic form (log). b Gene set analysis of cardiac maturation-specific genes.
Fig. 5
Fig. 5. Metabolic and structural functionality of hiPSC-CMs.
a Mitochondrial respiration rates of hiPSC-CMs treated with DMSO (n = 4), T112 (n = 5), T623 (n = 5), or Combo (n = 5) (O, Oligomycin; F, FCCP, phenylhydrazone; AR, Antimycin A and Rotenone). n = biologically independent samples per group. Data are the mean ± SEM. b Basal and maximal OCR and ATP production of hiPSC-CMs treated with DMSO (n = 4), T112 (n = 5), T623 (n = 5), or Combo (n = 5). n = biologically independent samples per group. Data are the mean ± SEM. Statistical analysis was compared to DMSO using one-way ANOVA followed by Dunnett’s test. ****P < 0.0001. c top: Representative western blots of cTnI, ssTnI, and GAPDH proteins in hiPSC-CMs treated with DMSO, T112, T623, or Combo. For ssTnI, two bands were detected: the shorter one is wild type ssTnI and the longer one is ssTnI with F2A peptides. Bottom: cTnI/ssTnI relative ratio. n = 3 independent experiments per group. Data are the mean ± SEM. Statistical analysis was compared to DMSO using one-way ANOVA followed by Dunnett’s test. d Cell area of hiPSC-CMs treated with DMSO, T112, or T623 measured by high content imaging. For each group, n = 300 cells over three independent experiments. e Roundness of hiPSC-CMs treated with DMSO, T112, T623, or Combo. Each group, n = 3 independent experiments. Data are the mean ± SEM. Statistical analysis was done using one-way ANOVA followed by Tukey’s HSD test. f Sarcomere length in hiPSC-CMs treated with DMSO, T112, T623, or Combo. Boxes represent 25th–75th percentiles; whiskers represent the minimum and maximum ranges; horizontal lines indicate the median values. n = 15, one measurement per TEM image from 15 TEM images over two consecutive experiments; ****P < 0.0001 compared to DMSO, ‡P < 0.0001 compared to T623 using one-way ANOVA followed by Tukey’s HSD test. g Contractile properties of hiPSC-CMs treated with DMSO (n = 6), T112 (n = 7), T623 (n = 5), or Combo (n = 9). Top: Contraction velocity. Middle: Relaxation velocity. n = biologically independent samples examined over three independent experiments. bottom: Maximum conduction velocity. n = 3 independent experiments. Statistical analysis was compared to DMSO using one-way ANOVA followed by Dunnett’s test. ****P < 0.0001. h Representative AP recorded from hiPSC-CMs treated with DMSO or T112. i The fraction of APs with a notch (black). j Electrophysiology data of APA, Vmax and MDP in hiPSC-CMs treated with DMSO (n = 21) or T112 (n = 18) over 3 independent experiments. Boxes represent 25th–75th percentiles; whiskers represent the minimum and maximum ranges; horizontal lines indicate the median values. Statistical analysis was done using unpaired two-tailed t-test. k Typical high magnification TEM images of hiPSC-CMs treated with T112 or Combo. Scale bars: 500 nm. I: I-band; TT: T-tubule; Z: Z line.All results are from #8-5-3.
Fig. 6
Fig. 6. Stage-specific causal role of ERRγ in regulating TNNI3-driven cardiac maturation.
a Fluorescence images of ERRγKO hiPSC-CMs treated with DMSO, T112, or T623 for TNNI1EmGFP and TNNI3mCherry expression. Scale bars: 500 μm. b Flow cytometric analysis of day-16 CMs derived from ERRγKO hiPSCs for TNNI3mCherry expression. n = 4 independent experiments per group. Data are the mean ± SEM; Statistical analysis was compared to DMSO using one-way ANOVA followed by Dunnett’s test. NT no treatment. c Mitochondrial respiration rates of ERRγKO hiPSC-CMs treated with either DMSO or T112 (O Oligomycin; F FCCP, phenylhydrazone; AR Antimycin A and Rotenone). n = 5 biologically independent samples per group. d Basal and maximal OCR and ATP production of ERRγKO hiPSC-CMs treated with either DMSO or T112. Statistical analysis was done using unpaired two-tailed t-tests. n = 5 biologically independent samples per group. Data are the mean ± SEM; Statistical analysis was using unpaired two-tailed t-test.
Fig. 7
Fig. 7. hiPSC cardiac maturation model.
Schematic representation of an ERRγ agonist inducing the cardiac neonatal-like phenotype.

References

    1. Takahashi K, et al. Induction of pluripotent stem cells from adult human fibroblasts by defined factors. Cell. 2007;131:861–872. doi: 10.1016/j.cell.2007.11.019. - DOI - PubMed
    1. Burridge PW, Keller G, Gold JD, Wu JC. Production of de novo cardiomyocytes: human pluripotent stem cell differentiation and direct reprogramming. Cell Stem Cell. 2012;10:16–28. doi: 10.1016/j.stem.2011.12.013. - DOI - PMC - PubMed
    1. Love MI, Huber W, Anders S. Moderated estimation of fold change and dispersion for RNA-seq data with DESeq2. Genome Biol. 2014;15:550. doi: 10.1186/s13059-014-0550-8. - DOI - PMC - PubMed
    1. DeLaughter DM, et al. Single-cell resolution of temporal gene expression during heart development. Dev. Cell. 2016;39:480–490. doi: 10.1016/j.devcel.2016.10.001. - DOI - PMC - PubMed
    1. Uosaki H, et al. Transcriptional landscape of cardiomyocyte maturation. Cell Rep. 2015;13:1705–1716. doi: 10.1016/j.celrep.2015.10.032. - DOI - PMC - PubMed

Publication types

MeSH terms