

The effect of COVID19 pandemic restrictions on an urban rodent population
- PMID: 34155237
- PMCID: PMC8217515
- DOI: 10.1038/s41598-021-92301-0
The effect of COVID19 pandemic restrictions on an urban rodent population
Abstract
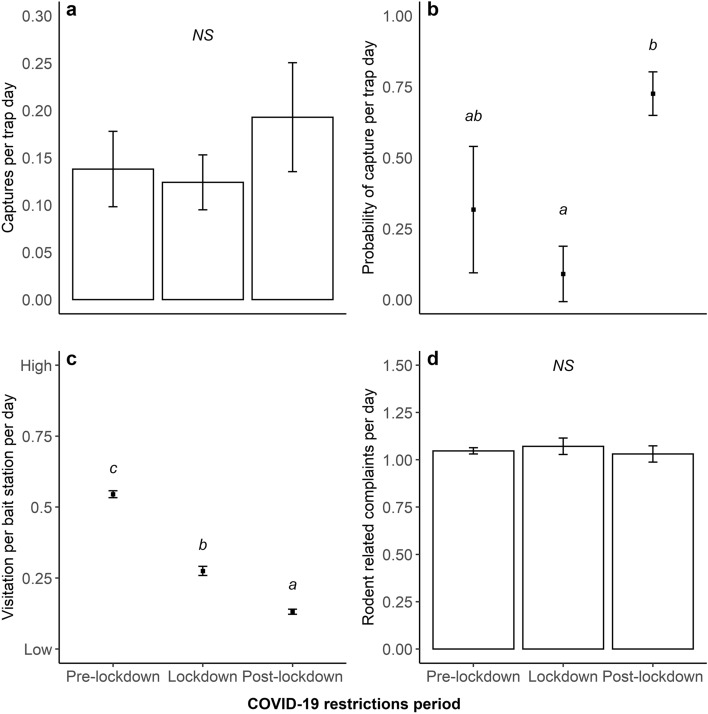
Shortly after the enactment of restrictions aimed at limiting the spread of COVID-19, various local government and public health authorities around the world reported an increased sighting of rats. Such reports have yet to be empirically validated. Here we combined data from multi-catch rodent stations (providing data on rodent captures), rodent bait stations (providing data on rodent activity) and residents' complaints to explore the effects of a six week lockdown period on rodent populations within the City of Sydney, Australia. The sampling interval encompassed October 2019 to July 2020 with lockdown defined as the interval from April 1st to May 15th, 2020. Rodent captures and activity (visits to bait stations) were stable prior to lockdown. Captures showed a rapid increase and then decline during the lockdown, while rodent visits to bait stations declined throughout this period. There were no changes in the frequency of complaints during lockdown relative to before and after lockdown. There was a non-directional change in the geographical distribution of indices of rodent abundance suggesting that rodents redistributed in response to resource scarcity. We hypothesize that lockdown measures initially resulted in increased rodent captures due to sudden shortage of human-derived food resources. Rodent visits to bait stations might not show this pattern due to the nature of the binary data collected, namely the presence or absence of a visit. Relocation of bait stations driven by pest management goals may also have affected the detection of any directional spatial effect. We conclude that the onset of COVID-19 may have disrupted commensal rodent populations, with possible implications for the future management of these ubiquitous urban indicator species.
Conflict of interest statement
The authors declare no competing interests.
Figures

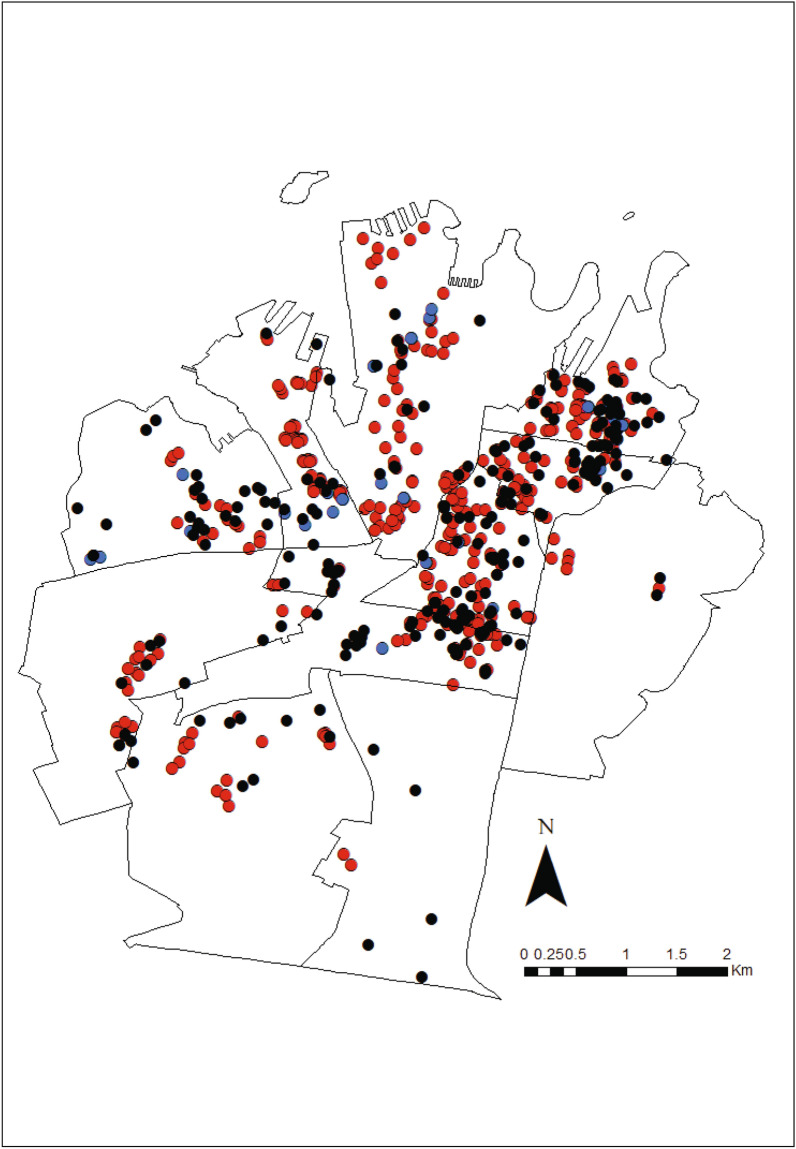
 ), rodent bait stations (
 ) and residents’ rodent complaints (
 ) within the Council of the City of Sydney. The eleven Statistical Area 2 (SA2) which make up the City of Sydney are shown. Map generated using ArcGIS Desktop v10.5.
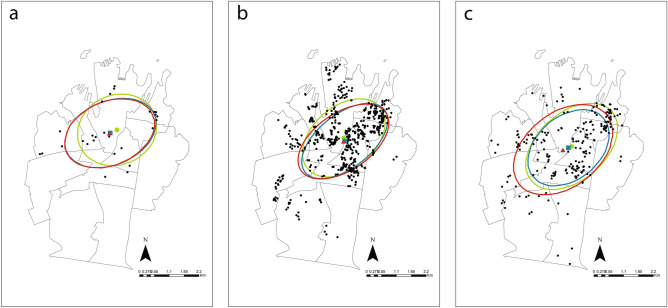
 ), lockdown (
 ) and post-lockdown (
 ) periods. Maps generated using ArcGIS Desktop v10.5.
Similar articles
-
An extended Weight Kernel Density Estimation model forecasts COVID-19 onset risk and identifies spatiotemporal variations of lockdown effects in China.Commun Biol. 2021 Jan 25;4(1):126. doi: 10.1038/s42003-021-01677-2. Commun Biol. 2021. PMID: 33495509 Free PMC article.
-
Initial Assessment of the Impact of the Emergency State Lockdown Measures on the 1st Wave of the COVID-19 Epidemic in Portugal.Acta Med Port. 2020 Nov 2;33(11):733-741. doi: 10.20344/amp.14129. Epub 2020 Nov 2. Acta Med Port. 2020. PMID: 33160423
-
A Remote Questionnaire-Based Study to Compare Alcohol Use in 1030 Final-Year High School Students in Split-Dalmatia County, Croatia Before and During the National Lockdown Due to the COVID-19 Pandemic.Med Sci Monit. 2022 Feb 24;28:e935567. doi: 10.12659/MSM.935567. Med Sci Monit. 2022. PMID: 35197440 Free PMC article.
-
Effect of national and local lockdowns on the control of COVID-19 pandemic: a rapid review.Epidemiol Prev. 2020 Sep-Dec;44(5-6 Suppl 2):60-68. doi: 10.19191/EP20.5-6.S2.104. Epidemiol Prev. 2020. PMID: 33412795 Review. English.
-
Pandemic lockdown, healthcare policies and human rights: integrating opposed views on COVID-19 public health mitigation measures.Rev Cardiovasc Med. 2020 Dec 30;21(4):509-516. doi: 10.31083/j.rcm.2020.04.274. Rev Cardiovasc Med. 2020. PMID: 33387996 Review.
Cited by
-
Molecular detection of Leishmania infantum in rats and sand flies in the urban sewers of Barcelona, Spain.Parasit Vectors. 2022 Jun 16;15(1):211. doi: 10.1186/s13071-022-05309-4. Parasit Vectors. 2022. PMID: 35710435 Free PMC article.
-
Emerging canine leptospirosis in Sydney and the role of population demographics.Transbound Emerg Dis. 2022 Sep;69(5):e2485-e2494. doi: 10.1111/tbed.14591. Epub 2022 May 20. Transbound Emerg Dis. 2022. PMID: 35533268 Free PMC article.
-
Association between anthropization and rodent reservoirs of zoonotic pathogens in Northwestern Mexico.PLoS One. 2024 Feb 22;19(2):e0298976. doi: 10.1371/journal.pone.0298976. eCollection 2024. PLoS One. 2024. PMID: 38386681 Free PMC article.
-
Prevalence of Gastrointestinal Parasites in Zoo Animals and Phylogenetic Characterization of Toxascaris leonina (Linstow, 1902) and Baylisascaris transfuga (Rudolphi, 1819) in Jiangsu Province, Eastern China.Animals (Basel). 2024 Jan 24;14(3):375. doi: 10.3390/ani14030375. Animals (Basel). 2024. PMID: 38338018 Free PMC article.
-
Changes in the feeding ecology of an opportunistic predator inhabiting urban environments in response to COVID-19 lockdown.R Soc Open Sci. 2023 Apr 12;10(4):221639. doi: 10.1098/rsos.221639. eCollection 2023 Apr. R Soc Open Sci. 2023. PMID: 37063991 Free PMC article.
References
-
- Tobin ME, Fall MW. USDA National Wildlife Research Center-Staff Publications. USDA National Wildlife Research Center-Staff Publications; 2006. pp. 1–21.
-
- Mills, J. N. The role of rodents in emerging human disease: Examples from the hantaviruses and arenaviruses. in Ecologically-Based Rodent Management (eds Grant R. Singleton, Lyn A. Hinds, Herwig Leirs, & Zhibin Zhang) 134–160 (Australian Centre for International Agricultural Research, 1999)
-
- Barnett SA. The Story of Rats: Their Impact on Us, and Our Impact on Them. Allen & Unwin; 2001.
Publication types
MeSH terms
Grants and funding
LinkOut - more resources
Full Text Sources
Medical
Miscellaneous
