. 2021 Jun 21;11(1):13001.
doi: 10.1038/s41598-021-92263-3.

The impact of super-spreader cities, highways, and intensive care availability in the early stages of the COVID-19 epidemic in Brazil

Affiliations

The impact of super-spreader cities, highways, and intensive care availability in the early stages of the COVID-19 epidemic in Brazil

Miguel A L Nicolelis et al. Sci Rep. .

Abstract

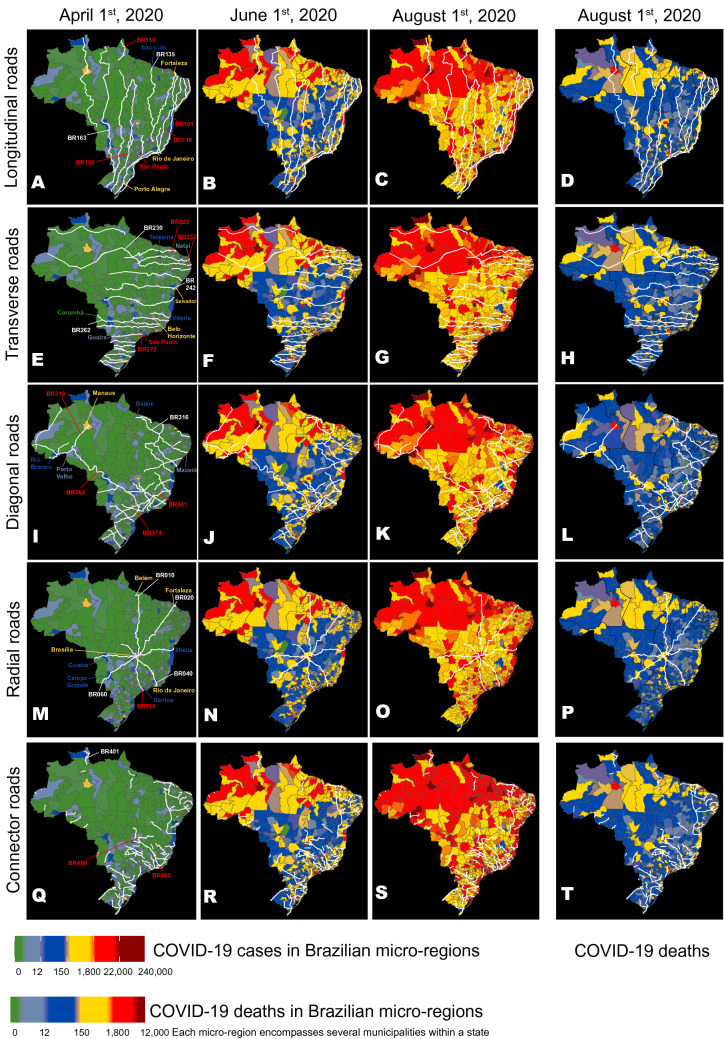
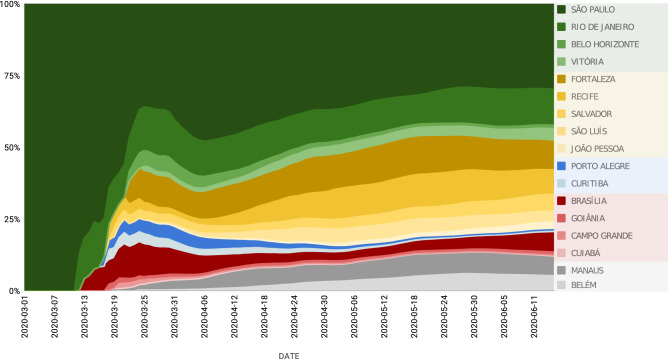
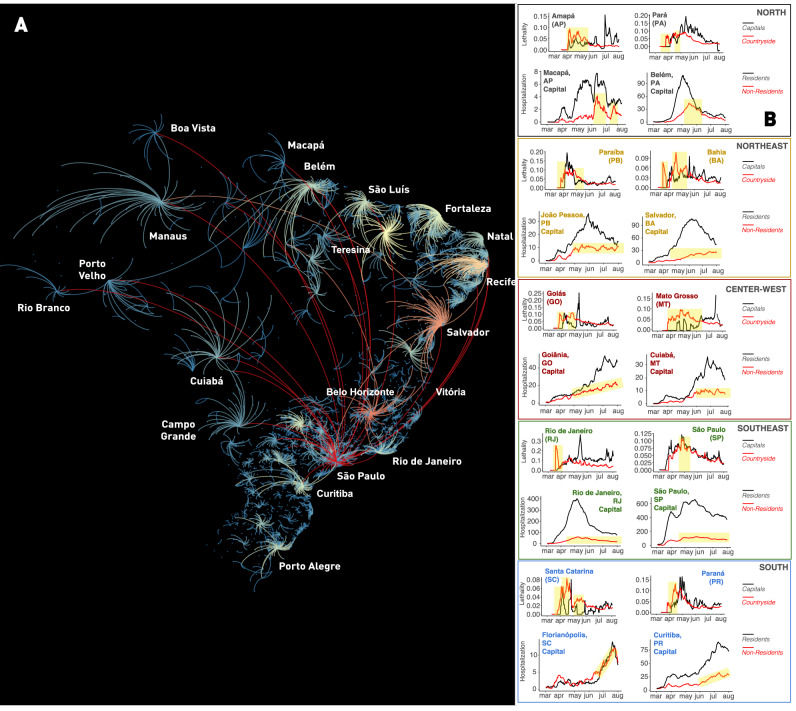
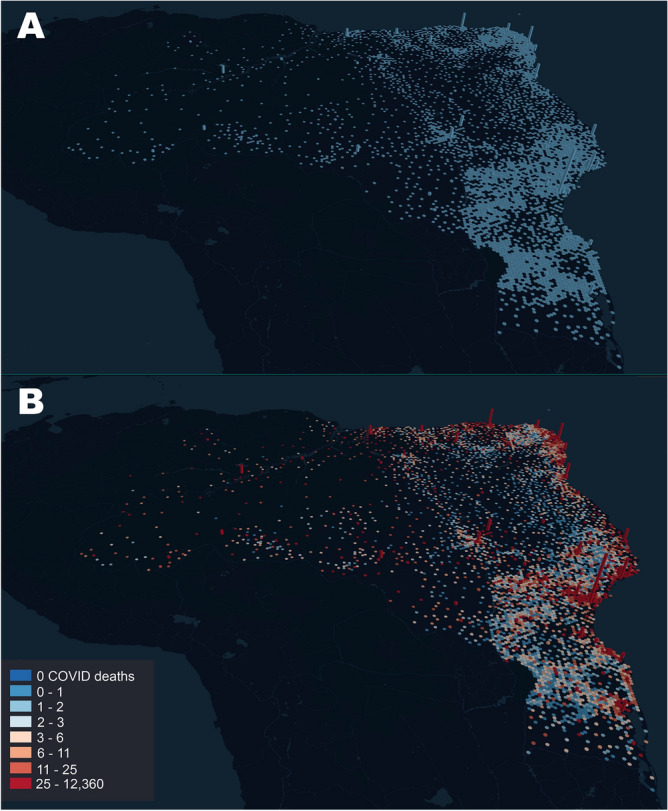
Although international airports served as main entry points for SARS-CoV-2, the factors driving the uneven geographic spread of COVID-19 cases and deaths in Brazil remain mostly unknown. Here we show that three major factors influenced the early macro-geographical dynamics of COVID-19 in Brazil. Mathematical modeling revealed that the "super-spreading city" of São Paulo initially accounted for more than 85% of the case spread in the entire country. By adding only 16 other spreading cities, we accounted for 98-99% of the cases reported during the first 3 months of the pandemic in Brazil. Moreover, 26 federal highways accounted for about 30% of SARS-CoV-2's case spread. As cases increased in the Brazilian interior, the distribution of COVID-19 deaths began to correlate with the allocation of the country's intensive care units (ICUs), which is heavily weighted towards state capitals. Thus, severely ill patients living in the countryside had to be transported to state capitals to access ICU beds, creating a "boomerang effect" that contributed to skew the distribution of COVID-19 deaths. Therefore, if (i) a lockdown had been imposed earlier on in spreader-capitals, (ii) mandatory road traffic restrictions had been enforced, and (iii) a more equitable geographic distribution of ICU beds existed, the impact of COVID-19 in Brazil would be significantly lower.


Conflict of interest statement

The authors declare no competing interests.

Figures

Figure 1
Figure 1
Maps of Brazil were used to represent the routes of the main longitudinal (AD), transversal (EH), diagonal (IL), radial (MP), and connector (QT) federal highways, as well as the evolution of the geographic distribution of COVID-19 cases on three dates (April 1st, June 1st, and August 1st), and the distribution of COVID-19 deaths on August 1st (D). Overall, 26 highways (see text) from all five road categories contributed to approximately 30% of the COVID-19 case spreading throughout Brazil. The numbers of some of these spreading highways are highlighted in red. Notice how many hotspots (red color) for COVID-19 cases occur in micro-regions containing cities located along major highway routes like BRs 101, 116, 222, 232, 236, 272, 364, 374, 381, 010, 050, 060, 450, and 465. Although the distributions for COVID-19 cases and deaths were correlated, geographic discrepancies between the two distributions can be seen by comparing them on August 1st (C,D). A color code (see figure bottom) ranks Brazilian micro-regions (each comprising several tows) according to their number of COVID-19 cases and deaths. Maps generated using the R (https://cran.r-project.org/) package brazilmaps 0.1 by R. P. Siqueira (https://github.com/rpradosiqueira/brazilmaps).
Figure 2
Figure 2
Individual contribution of the 17 state capital cities responsible for 98% of spreading of COVID-19 cases for the 5570 Brazilian municipalities, from March 1st to June 11th. Notice how São Paulo contributed to more than 80% of all cases spreading during the first weeks of March. Throughout the period until June 11th, São Paulo’s contribution never decreased below 30%. For that reason, the city was labeled as the COVID-19 super-spreader Brazilian city. Notice also the high contribution of Rio de Janeiro, Brasilia, and five state capitals in the Northeast region: Fortaleza, Recife, Salvador, São Luís, and João Pessoa. Manaus and Belém were the largest spreading cities in the North (Amazon) region, and Porto Alegre and Curitiba the most important in the South region. During this period, the contributions of Goiânia, Campo Grande, and Cuibá in the Central-West region were the largest in their region but much smaller when compared to other regions and their spreaders.
Figure 3
Figure 3
Quantification of the Brazilian “boomerang effect”. (A) Representation of all “boomerangs” that occurred around major Brazilian state capitals (see labels for names) and mid-size cities across the whole country. In this map, arcs represent the flow of people from the interior towards the capital. The arc color code represents the number of interior cities that sent severely ill patients to be admitted in hospitals in a capital or mid-size town; red being the highest number of locations, orange and yellow next, while a smaller number of locations are represented in light blue. Most of the flow of people represented in this graph took place through highways. Red arcs likely represent long-distance flow by airplanes. In the Amazon, most of the flow of people towards Manaus occurred by boats through the Amazon river and its tributaries. Notice that again São Paulo appears as the city with the highest boomerang effect, followed by Belo Horizonte, Recife, Salvador, Fortaleza, and Teresina. (B) Lethality and hospitalization data, divided for capital and interior (for lethality) and capital resident and non-resident (hospitalization), for a sample of state capitals in all five regions of Brazil. Yellow shading in the lethality graphs represent periods in which more deaths occurred in the interior, in relation to the capital. In the hospitalization graphs, yellow shading depicts periods of increasing admission of people residing in the countryside to the capital hospital system. The overall flow of people from capital to the interior and back to the capital characterized the boomerang effect, targeting the hospital system of the capital city. Notice that the boomerang effect was pervasive all over the country, occurring in every Brazilian state. Map generated using Gephi (https://gephi.org/, see Bastian et al.).
Figure 4
Figure 4
(A) Distribution of ICU beds across all Brazil. Bar height is proportional to the number of ICU beds in each city. Notice how the coastal state capitals accumulate most of the ICU beds in the whole country, with much fewer beds available in the interior of most states. The city of São Paulo exhibits the larger number of ICU beds in the whole country. (B) Superimposition of the COVID-19 death distribution (color code legend on the left lower corner) on top of the ICU bed distribution as seen in (A). For each bar, its height represents the number of ICU beds in a city, while color represents the number of deaths that occurred in that city. Again, the city of São Paulo, which has by far the highest number of ICU beds, accumulated the highest number of COVID-19 related fatalities, followed by state capitals like Rio de Janeiro, Fortaleza, Brasilia, Salvador, Manaus, Recife, and Belém. Maps generated using the online resources available at http://kepler.gl/.

Similar articles

Cited by

References

    1. Coronavirus Resource Center. "COVID-19 Dashboard by the Center for Systems Science and Engineering (CSSE) at Johns Hopkins University (JHU)." John Hopkins University & Medicine (2020). https://coronavirus.jhu.edu/map.html (2020).
    1. Candido D, et al. Routes for COVID-19 importation in Brazil. J. Travel Med. 2020;27:taaa042. doi: 10.1093/jtm/taaa042. - DOI - PMC - PubMed
    1. Candido DS, et al. Evolution and epidemic spread of SARS-CoV-2 in Brazil. Science. 2020;369:1255–1260. doi: 10.1126/science.abd2161. - DOI - PMC - PubMed
    1. Wilson JR, Dormontt EE, Prentis PJ, Lowe AJ, Richardson DM. Something in the way you move: Dispersal pathways affect invasion success. Trends Ecol. Evol. 2009;24:136–144. doi: 10.1016/j.tree.2008.10.007. - DOI - PubMed
    1. Ogden NH, et al. Emerging infectious diseases and biological invasions: A call for a One Health collaboration in science and management. R. Soc. Open Sci. 2019;6:181577. doi: 10.1098/rsos.181577. - DOI - PMC - PubMed

Publication types