. 2021 Jun 21;11(1):13008.
doi: 10.1038/s41598-021-92268-y.

Insights into how environment shapes post-mortem RNA transcription in mouse brain

Affiliations

Insights into how environment shapes post-mortem RNA transcription in mouse brain

Raphael Severino Bonadio et al. Sci Rep. .

Abstract

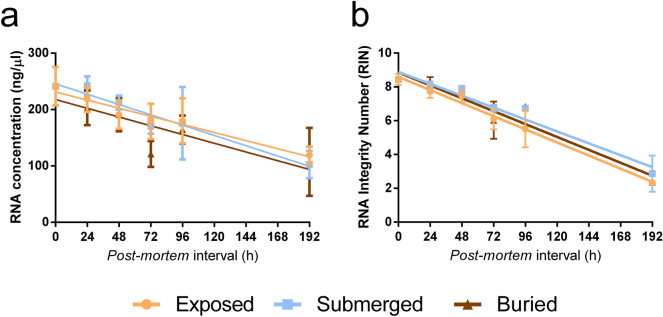
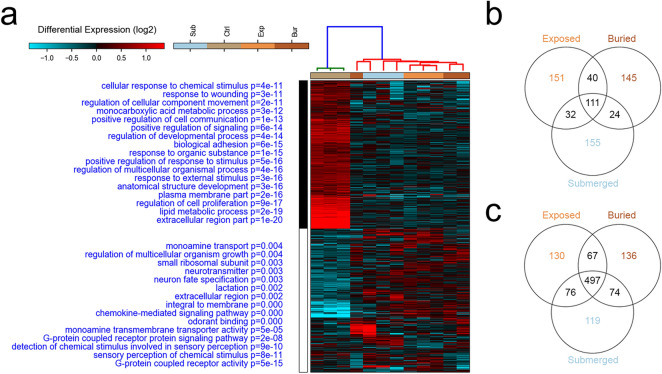
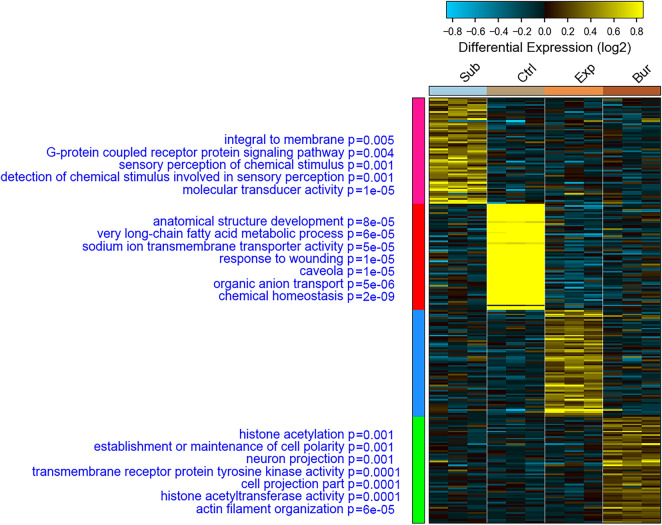
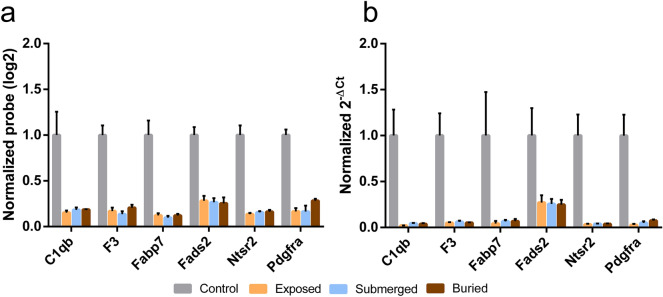
Most biological features that occur on the body after death were already deciphered by traditional medicine. However, the molecular mechanisms triggered in the cellular microenvironment are not fully comprehended yet. Previous studies reported gene expression alterations in the post-mortem condition, but little is known about how the environment could influence RNA degradation and transcriptional regulation. In this work, we analysed the transcriptome of mouse brain after death under three concealment simulations (air exposed, buried, and submerged). Our analyses identified 2,103 genes differentially expressed in all tested groups 48 h after death. Moreover, we identified 111 commonly upregulated and 497 commonly downregulated genes in mice from the concealment simulations. The gene functions shared by the individuals from the tested environments were associated with RNA homeostasis, inflammation, developmental processes, cell communication, cell proliferation, and lipid metabolism. Regarding the altered biological processes, we identified that the macroautophagy process was enriched in the upregulated genes and lipid metabolism was enriched in the downregulated genes. On the other hand, we also described a list of biomarkers associated with the submerged and buried groups, indicating that these environments can influence the post-mortem RNA abundance in its particular way.


Conflict of interest statement

The authors declare no competing interests.

Figures

Figure 1
Figure 1
Similar degradation rate in different concealment simulations. The RNA quantification analysis (A) and RNA integrity analysis (B) show that the overall sample quantity (ng/µl) and quality (RIN) decreases over time, but at the same rate in all groups tested. The slope comparison showed no statistical differences among groups both in RNA concentration (P = 0.6409) and integrity (P = 0.644).
Figure 2
Figure 2
Post-mortem transcriptome in different concealment simulations. Hierarchical Clustering Analysis (A) indicates the separation of the controls (0 h PMI) from the concealment samples. Gene functions enriched for the differentially expressed genes and corresponding P-values are shown in blue on the left of the heatmap. Venn diagram of upregulated (B) and downregulated (C) genes show exclusive and common differentially expressed genes considering the concealment group Vs. control group. The list of genes described by Venn diagrams are included in Supplementary Dataset File S1 and S2 online). Concealment groups are indicated as Sub: Submerged; Ctrl: Control; Exp: Exposed; Bur: Buried.
Figure 3
Figure 3
Biomarkers for each tested condition. Heatmap represents the expression of biomarkers identified using the AltAnalyzer algorithm. On the left of each biomarker group, indicated with the colours pink, red, blue, and green, are indicated enriched functional categories with the associated P-value.
Figure 4
Figure 4
Microarray validation with RT-qPCR and selection of possible PMI markers. Gene expression of six genes from microarray experiments (A) were confirmed by RT-qPCR (B). For the RT-qPCRs we performed Multiple T-tests (Holm-Sidak method, P < 0.05) and all comparisons against controls were statistically significant. Control vs Exposed: C1qb (P = 0.0038), F3 (P = 0.0024), Fabp7 (P = 0.025), Fads2 (P = 0.015), Nts2 (P = 0.0018), Pdgfra (P = 0.0018). Control vs Submerged: C1qb (P = 0.0042), F3 (P = 0.0026), Fabp7 (P = 0.027), Fads2 (P = 0.013), Nts2 (P = 0.002), Pdgfra (P = 0.002). Control vs Buried: C1qb (P = 0.0041), F3 (P = 0.0025), Fabp7 (P = 0.027), Fads2 (P = 0.013), Nts2 (P = 0.0019), Pdgfra (P = 0.0021).

References

    1. Pozhitkov AE, Noble PA. Gene expression in the twilight of death. Science. 2017;3:10. doi: 10.1017/dsj.2017.11. - DOI - PubMed
    1. Pozhitkov AE, et al. Tracing the dynamics of gene transcripts after organismal death. Open Biol. 2017;7:160267. doi: 10.1098/rsob.160267. - DOI - PMC - PubMed
    1. Hadj-Moussa H, Watts AJ, Storey KB. Genes of the undead: hibernation and death display different gene profiles. FEBS Lett. 2019;593:527–532. doi: 10.1002/1873-3468.13338. - DOI - PubMed
    1. Noble PA, Pozhitkov AE. Cryptic sequence features in the active postmortem transcriptome. BMC Genom. 2018;19:1–19. doi: 10.1186/s12864-018-5042-x. - DOI - PMC - PubMed
    1. Huang F, et al. Changes in apoptotic factors and caspase activation pathways during the postmortem aging of beef muscle. Food Chem. 2016;190:110–114. doi: 10.1016/j.foodchem.2015.05.056. - DOI - PubMed

Publication types