

Monitoring abundance of aggregated animals (Florida manatees) using an unmanned aerial system (UAS)
- PMID: 34155318
- PMCID: PMC8217521
- DOI: 10.1038/s41598-021-92437-z
Monitoring abundance of aggregated animals (Florida manatees) using an unmanned aerial system (UAS)
Abstract
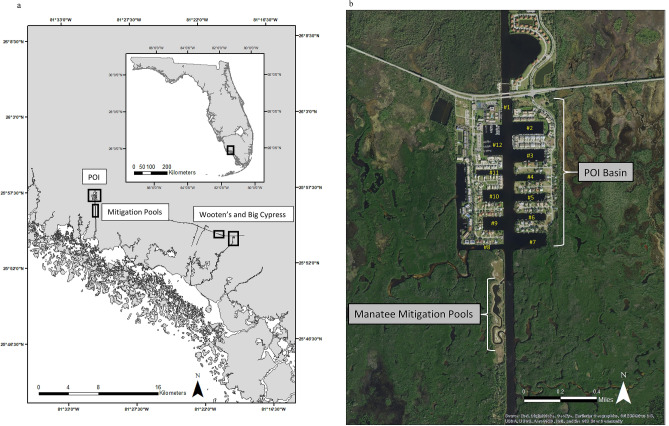
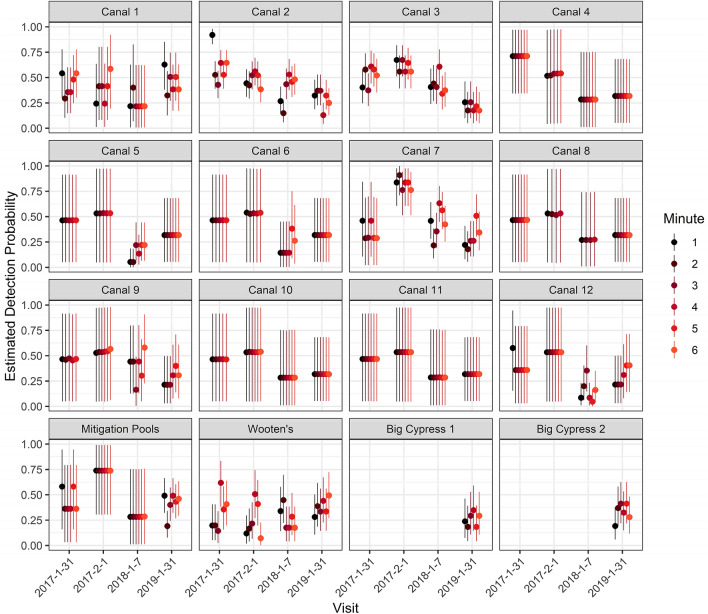
Imperfect detection is an important problem when counting wildlife, but new technologies such as unmanned aerial systems (UAS) can help overcome this obstacle. We used data collected by a UAS and a Bayesian closed capture-mark-recapture model to estimate abundance and distribution while accounting for imperfect detection of aggregated Florida manatees (Trichechus manatus latirostris) at thermal refuges to assess use of current and new warmwater sources in winter. Our UAS hovered for 10 min and recorded 4 K video over sites in Collier County, FL. Open-source software was used to create recapture histories for 10- and 6-min time periods. Mean estimates of probability of detection for 1-min intervals at each canal varied by survey and ranged between 0.05 and 0.92. Overall, detection probability for sites varied between 0.62 and 1.00 across surveys and length of video (6 and 10 min). Abundance varied by survey and location, and estimates indicated that distribution changed over time, with use of the novel source of warmwater increasing over time. The highest cumulative estimate occurred in the coldest winter, 2018 (N = 158, CI 141-190). Methods here reduced survey costs, increased safety and obtained rigorous abundance estimates at aggregation sites previously too difficult to monitor.
Conflict of interest statement
The authors declare no competing interests.
Figures


References
-
- Williams, B. K., Nichols, J. D. & Conroy, M. J. Analysis and Management of Animal Populations, Modeling, Estimation, and Decision Making (eds. Wood, J. M. & Tanner, G. W.) (Academic Press, 2002).
-
- Krause J, Ruxton GD. Living in Groups. Oxford Series in Ecology and Evolution. Oxford University Press; 2002.
-
- Griffin AS, Savani RS, Hausmanis K, Lefebvre L. Mixed-species aggregations in birds: Zenaida doves, Zenaida aurita, respond to alarm call of carib grackles, Quiscalus lugubris. Anim. Behav. 2005;70:507–515. doi: 10.1016/j.anbehav.2004.11.023. - DOI
-
- Kunz, T. H. Roosting ecology of bats. In Ecology of Bats (ed. Kunz, T. H.) 1–55 (Springer, 1982).
MeSH terms
LinkOut - more resources
Full Text Sources
