. 2021 Jul;23(7):745-757.
doi: 10.1038/s41556-021-00699-6. Epub 2021 Jun 21.

Mechanical compartmentalization of the intestinal organoid enables crypt folding and collective cell migration

Affiliations

Mechanical compartmentalization of the intestinal organoid enables crypt folding and collective cell migration

Carlos Pérez-González et al. Nat Cell Biol. 2021 Jul.

Abstract

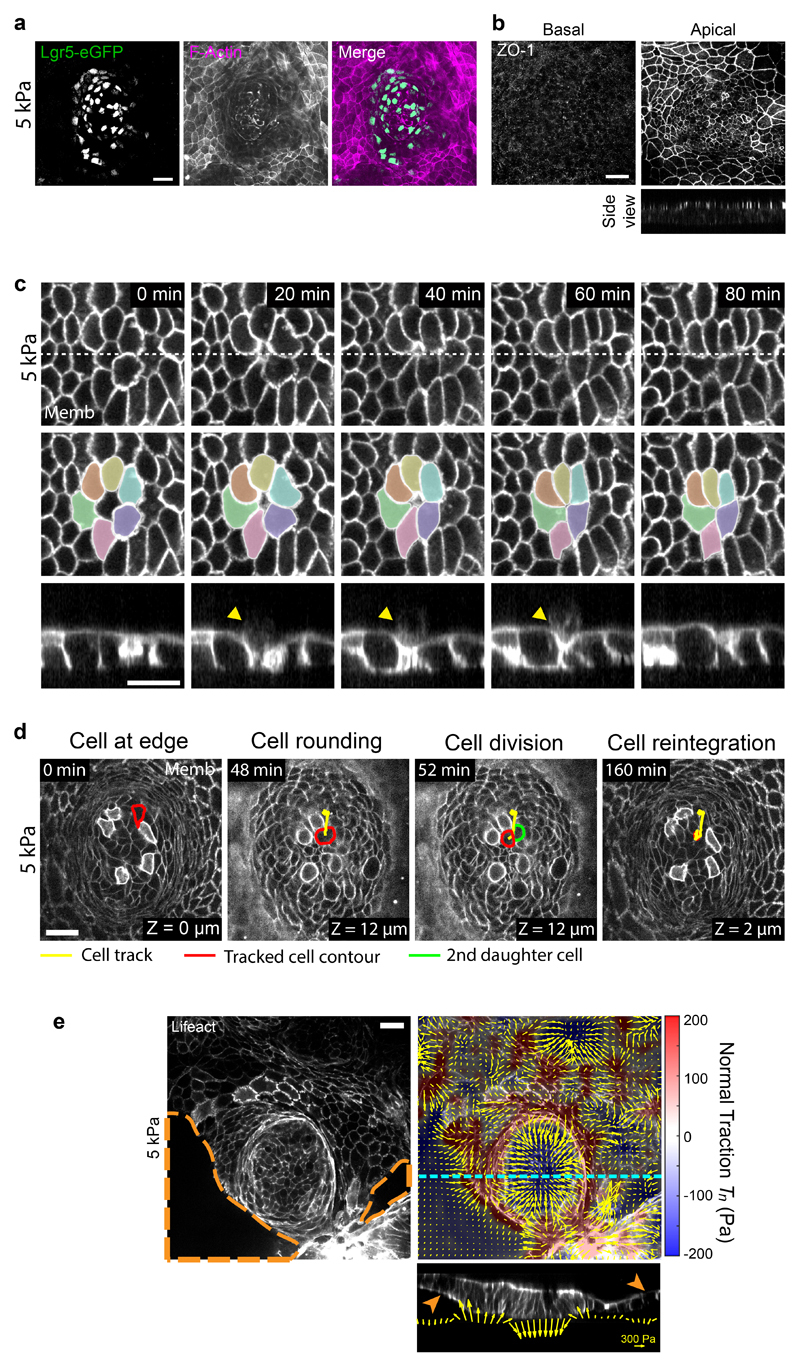
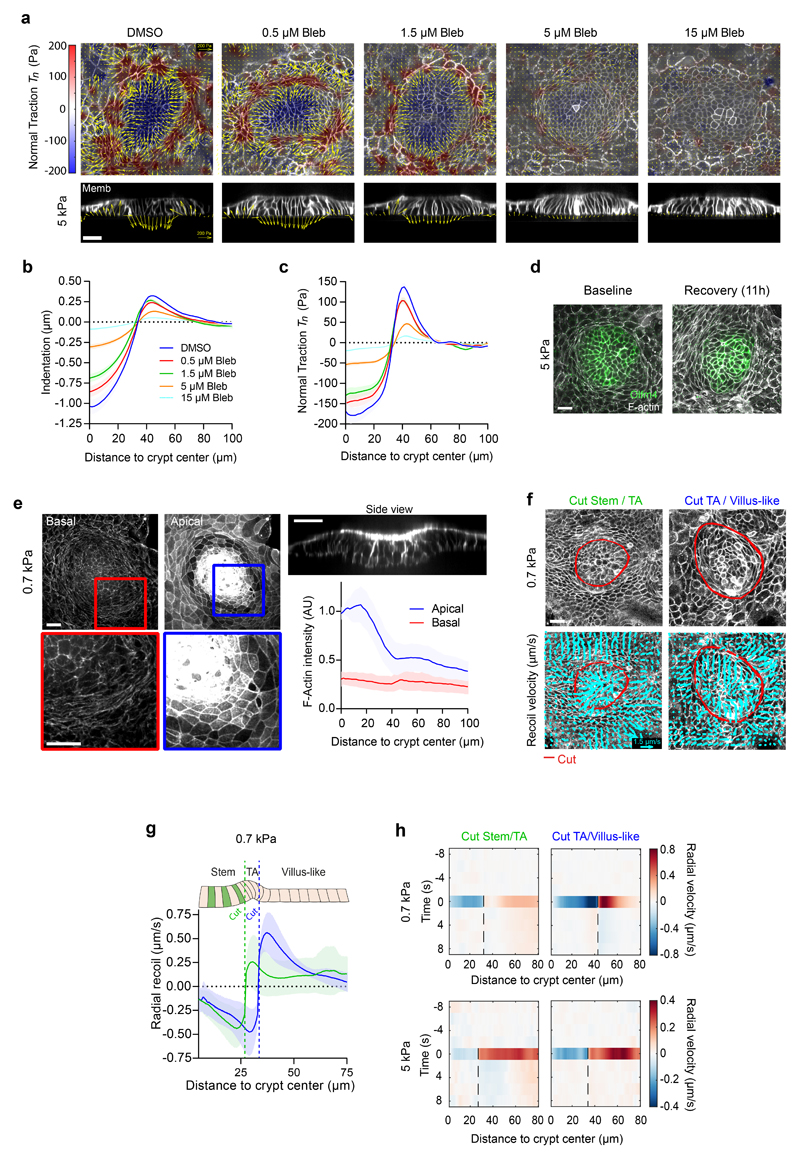
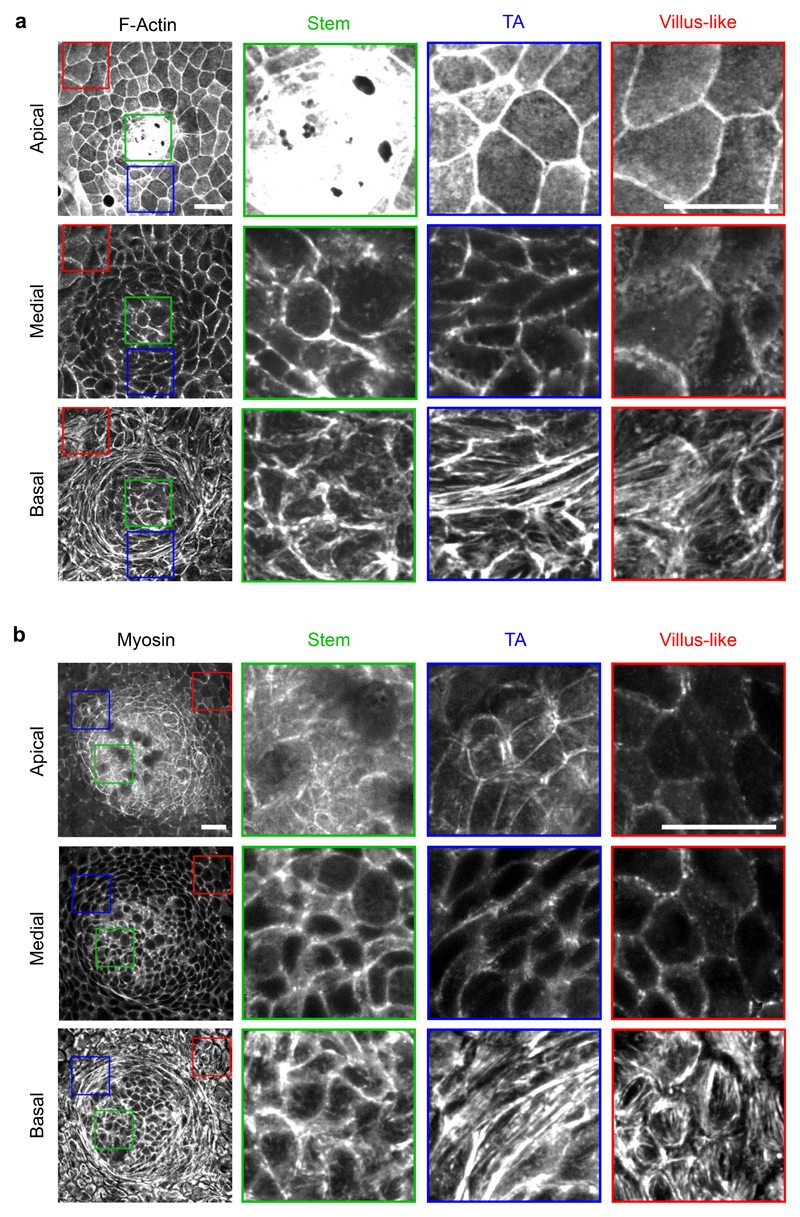
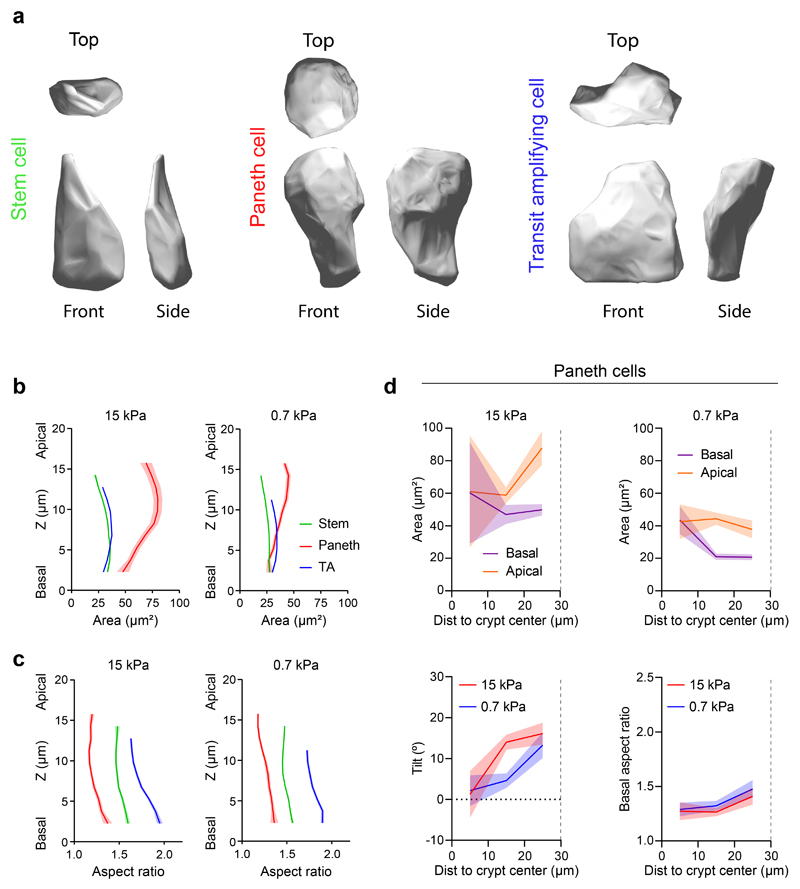
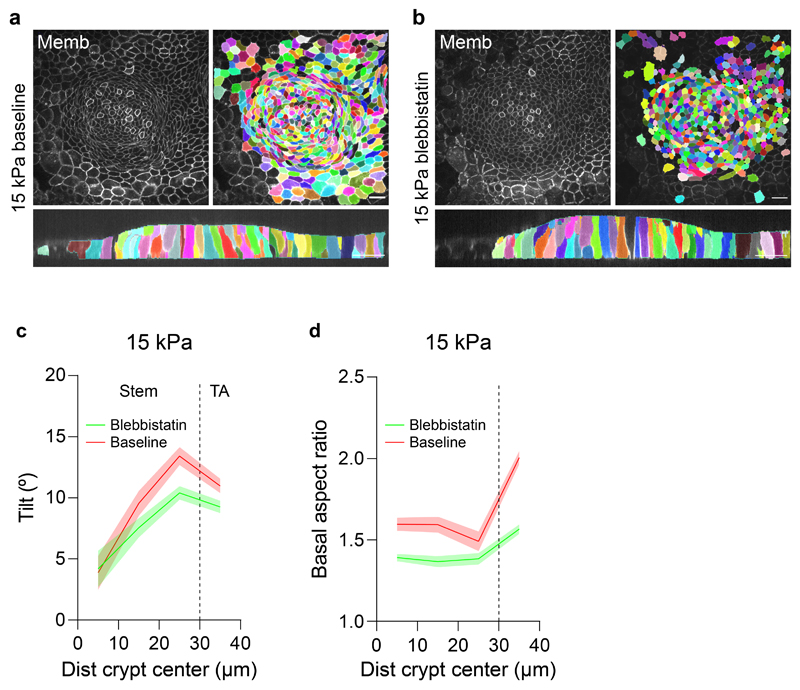
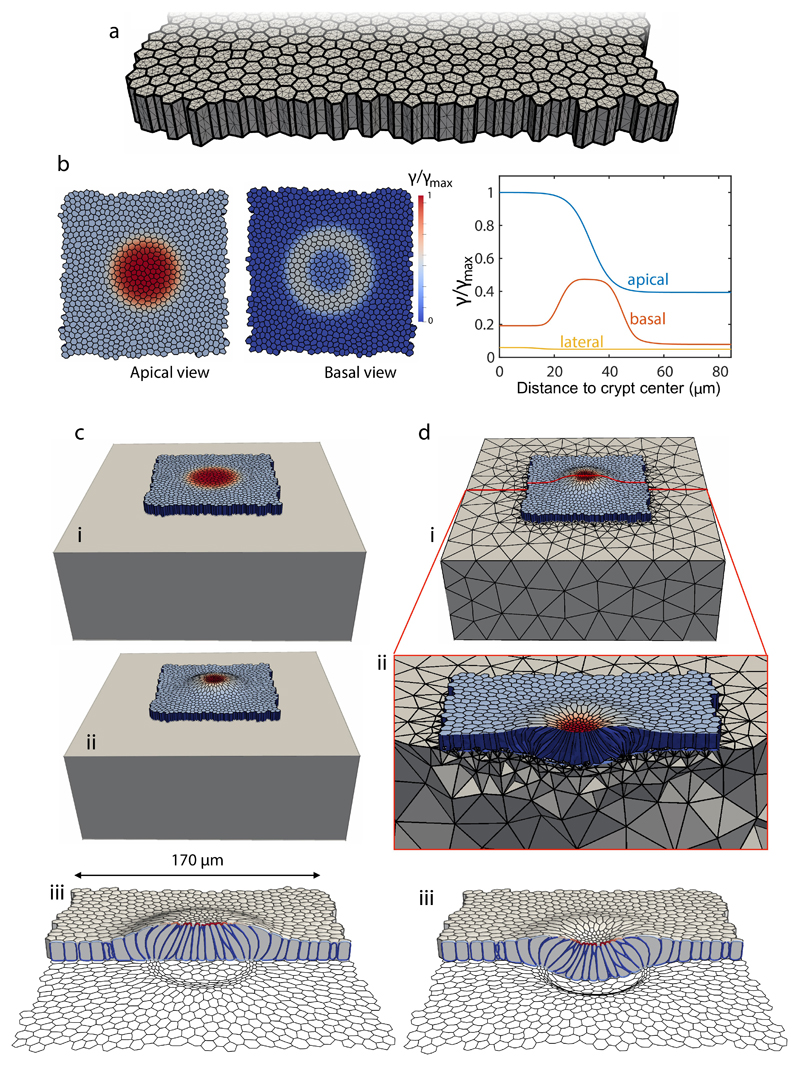
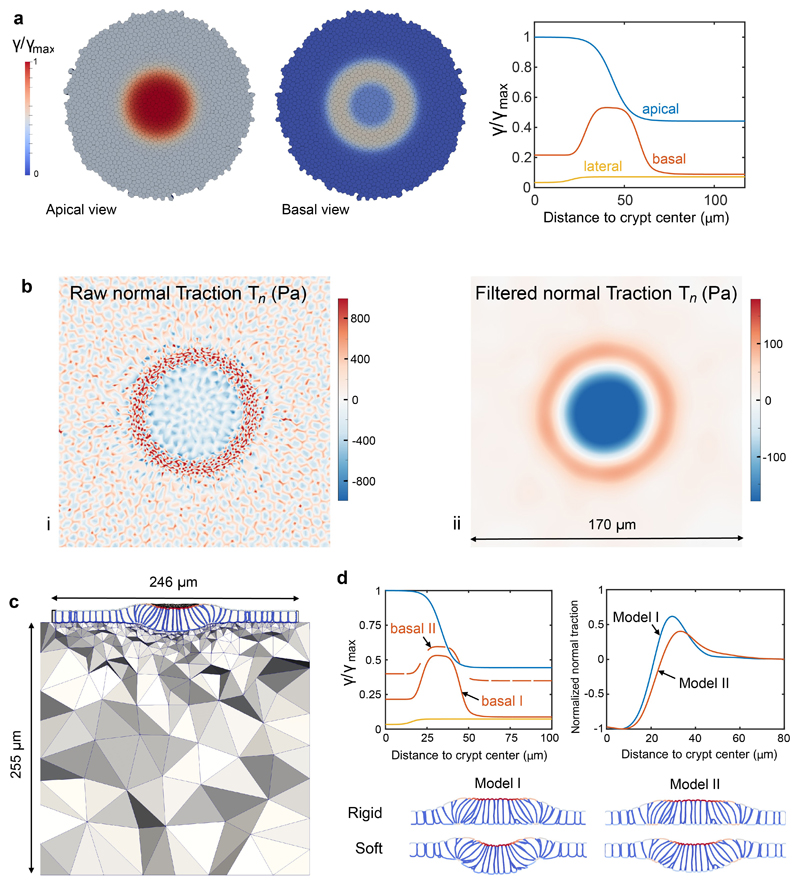
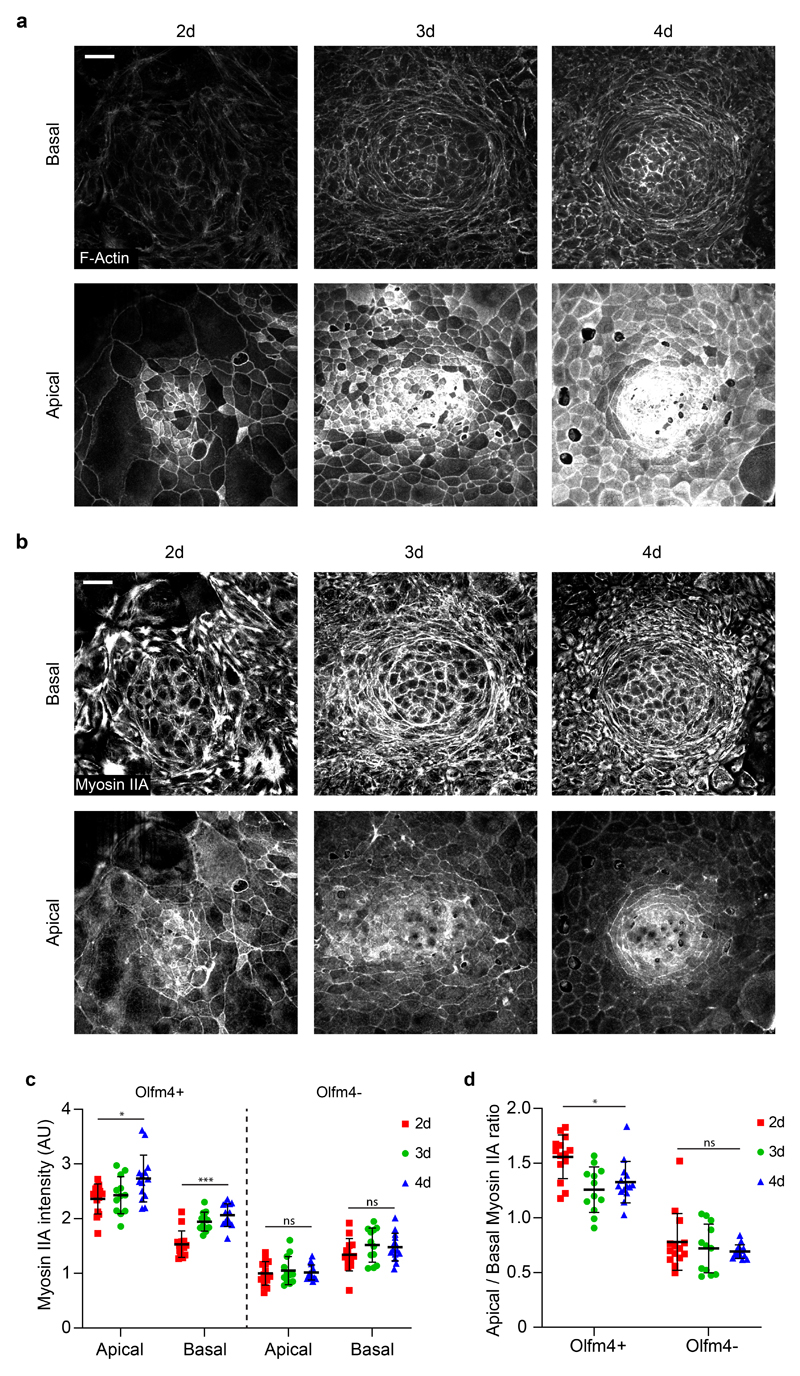
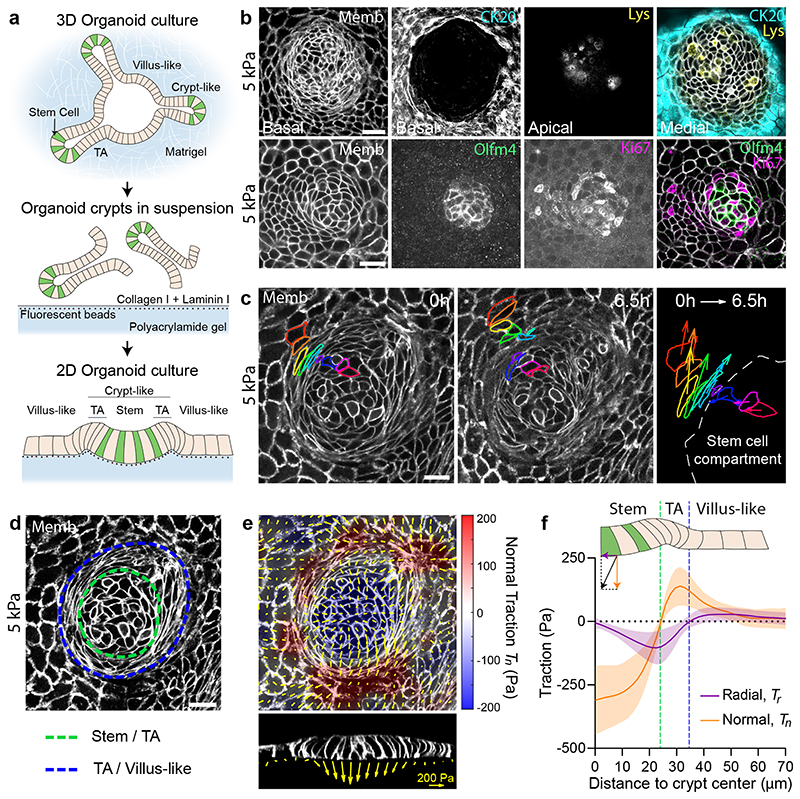
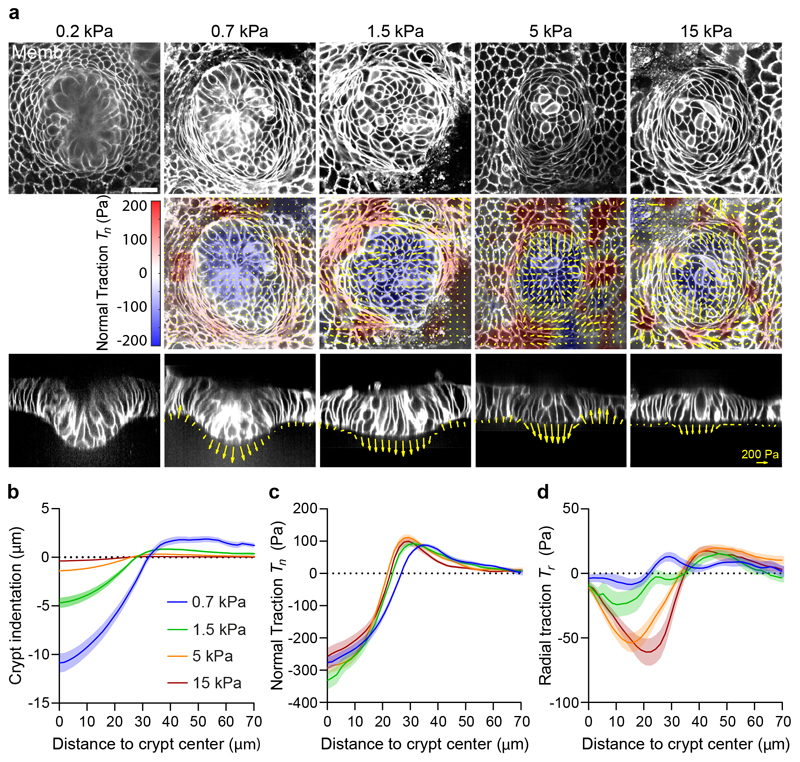
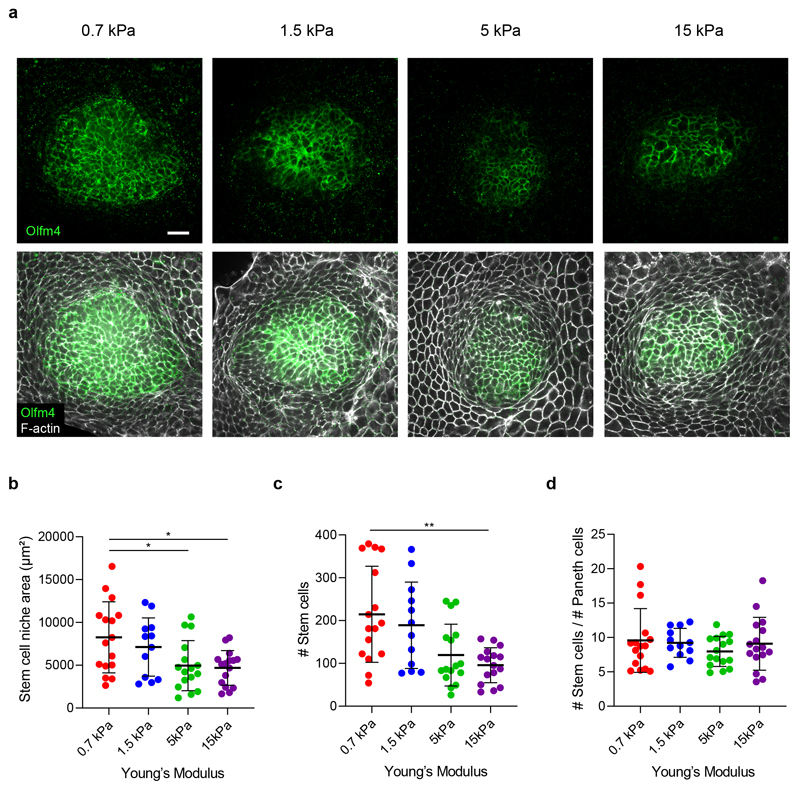
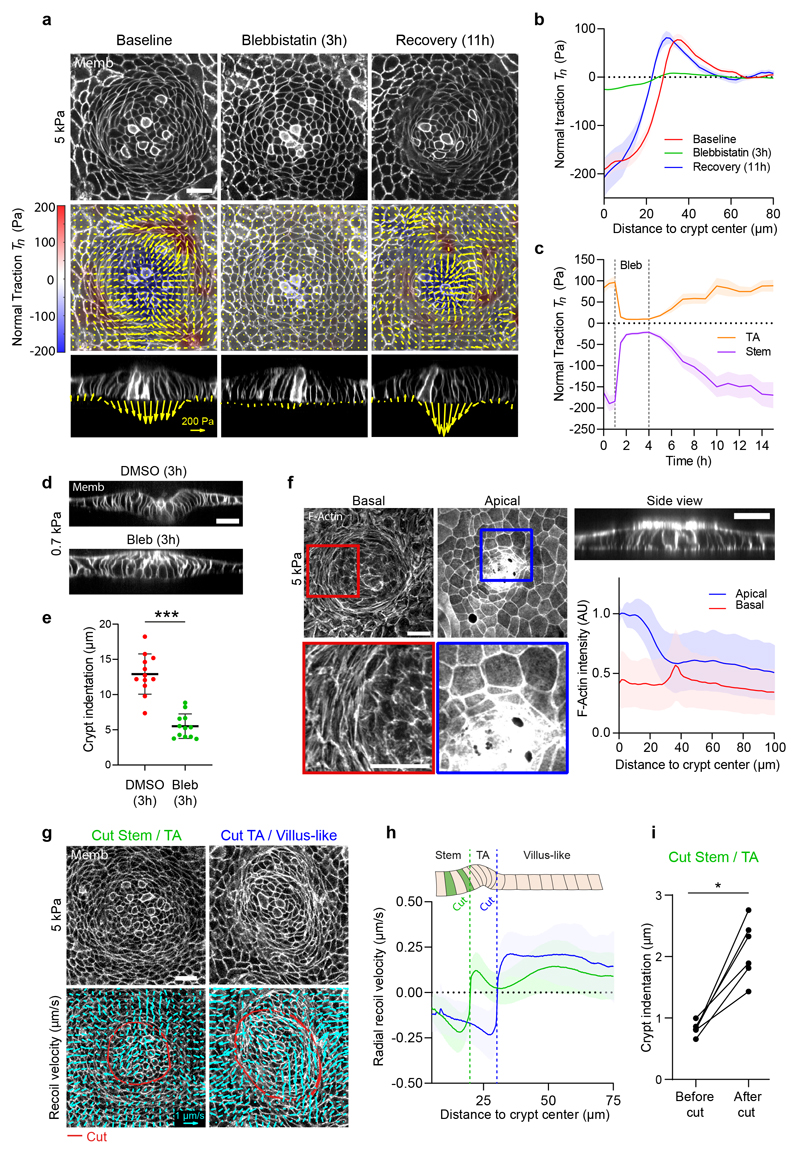
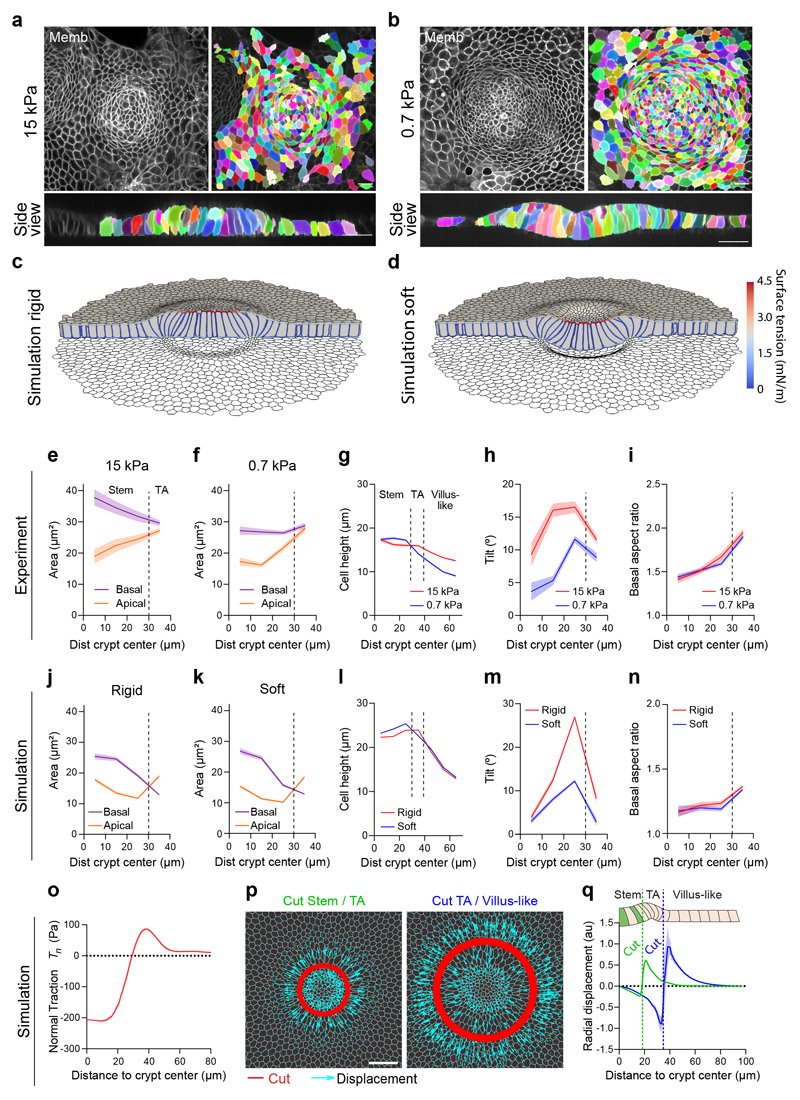
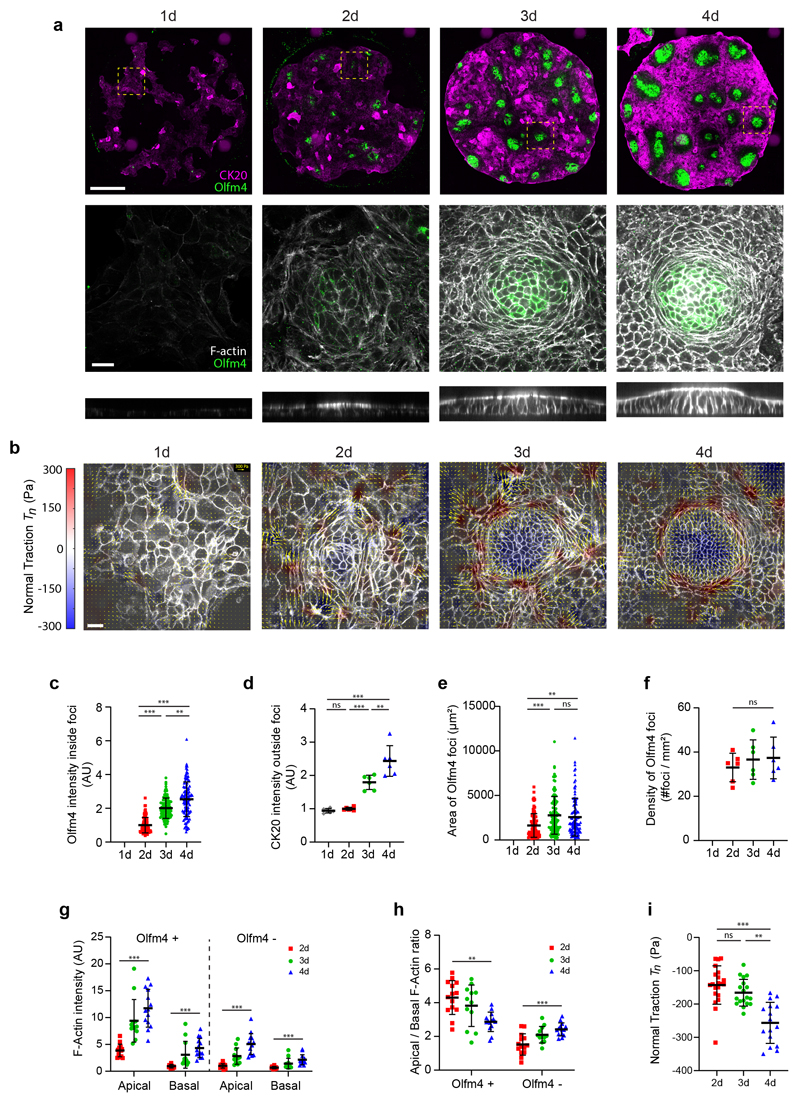
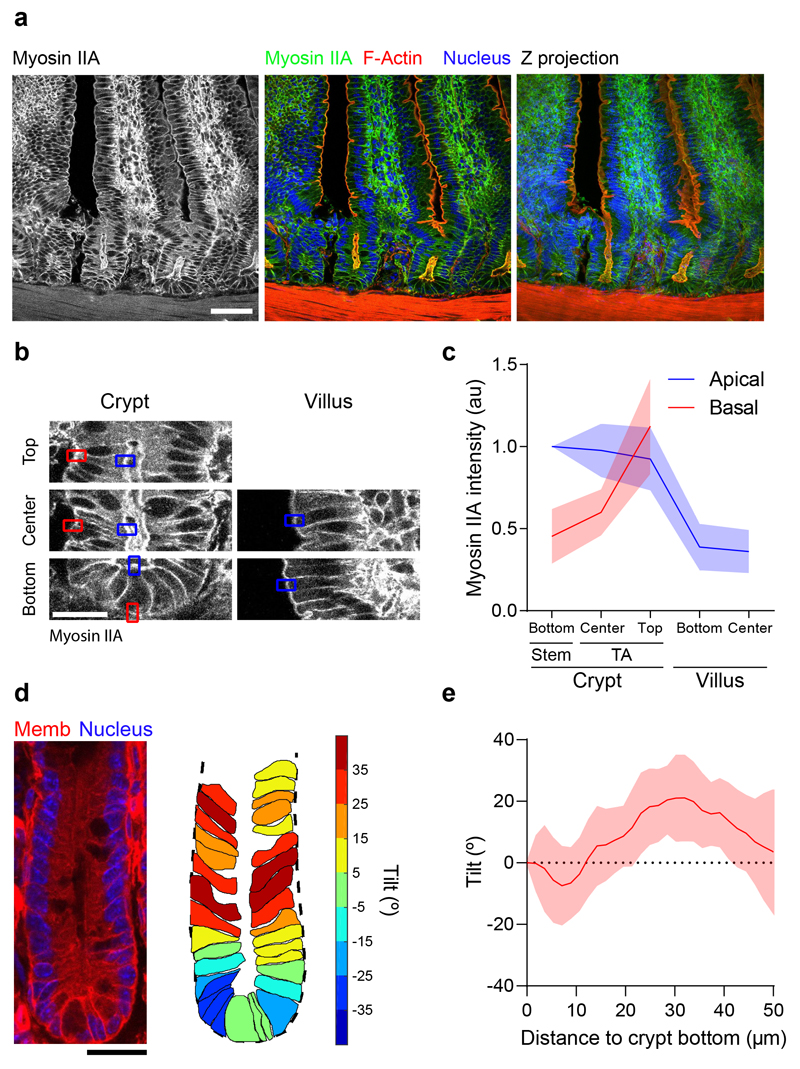
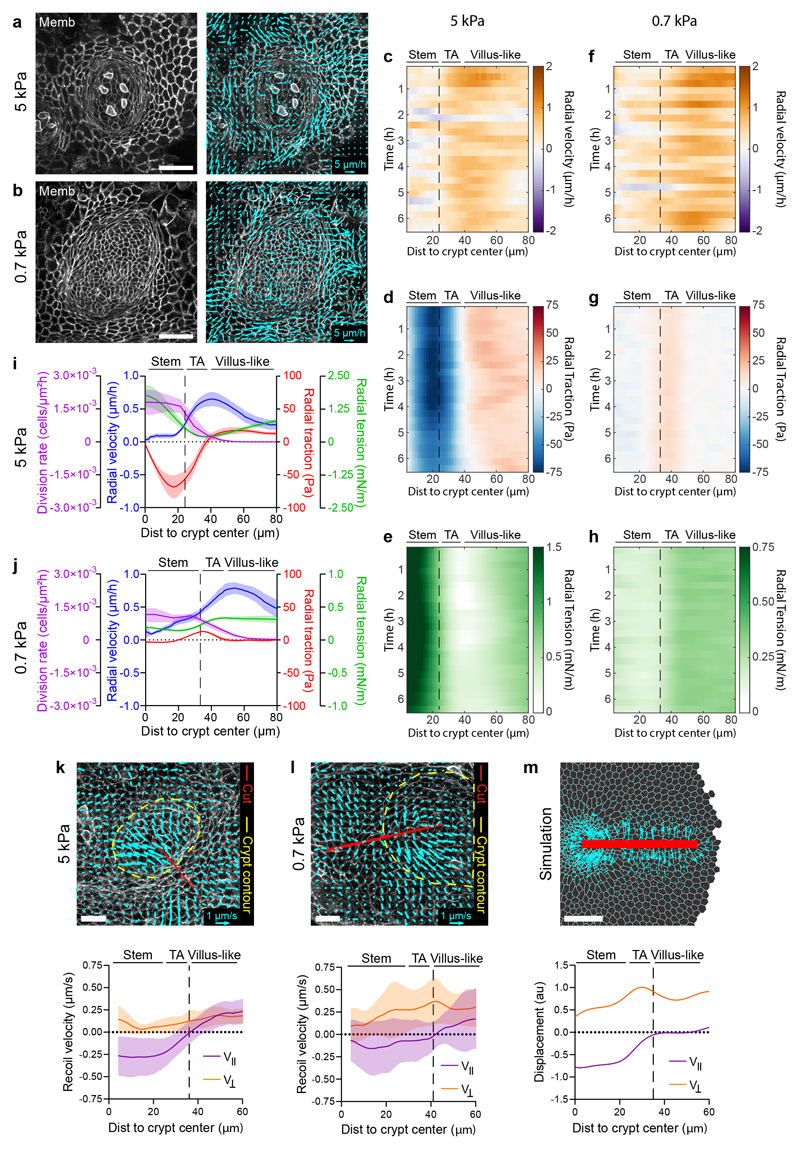
Intestinal organoids capture essential features of the intestinal epithelium such as crypt folding, cellular compartmentalization and collective movements. Each of these processes and their coordination require patterned forces that are at present unknown. Here we map three-dimensional cellular forces in mouse intestinal organoids grown on soft hydrogels. We show that these organoids exhibit a non-monotonic stress distribution that defines mechanical and functional compartments. The stem cell compartment pushes the extracellular matrix and folds through apical constriction, whereas the transit amplifying zone pulls the extracellular matrix and elongates through basal constriction. The size of the stem cell compartment depends on the extracellular-matrix stiffness and endogenous cellular forces. Computational modelling reveals that crypt shape and force distribution rely on cell surface tensions following cortical actomyosin density. Finally, cells are pulled out of the crypt along a gradient of increasing tension. Our study unveils how patterned forces enable compartmentalization, folding and collective migration in the intestinal epithelium.


Conflict of interest statement

Competing interests: the authors declare no competing financial interests

Figures

Extended Data Fig. 1
Extended Data Fig. 1. Organoid monolayers capture key physiological features of the intestinal epithelium.
a, Organoid monolayers expressing Lgr5-eGFP-IRES-CreERT2 stained for GFP and F-actin (phalloidin). Representative image of 2 experiments. b, Organoid monolayers stained for Zonula occludens 1 (ZO-1). Top: Average intensity projections of the 10 most basal (Top left) or apical (Top right) planes of the monolayer. Bottom: lateral view of the monolayer. Representative image of 2 experiments. c, Snapshots of an extrusion event happening at the villus-like region. The extruding cell is indicated with the arrowhead in the orthogonal views (bottom row). The neighbors of the extruding cell are highlighted in colors in the top views of the monolayer (middle row). The lateral views correspond to the midplane indicated with a white dashed line at their corresponding top views (Top row). Representative of 9 extrusions from 3 experiments. d, Snapshots of a cell that exhibits retrograde flow due to division. The contour of the cell of interest is delineated in red. The track of this cell is delineated in yellow. The contour of the second daughter cell that appears after the division event is delineated in green. The first and last snapshots (0min and 160min) correspond to basal planes of the crypt (Z=0 μm and 2 μm, respectively). Because division occurs apically, the second and third snapshots (48min and 52 min), correspond to an apical plane where division is better observed (Z=12 μm). 5 crypts from 3 experiments. e, Spontaneous formation of pressurized domes in the villus-like domain. Top left: medial view of an organoid monolayer expressing Lifeact-eGFP. The dashed orange line defines the regions where the monolayer has delaminated to form a pressurized dome (orange arrowheads in bottom panel). Top right: 3D traction map of the same crypt. Yellow vectors represent components tangential to the substrate and the color map represents the component normal to the substrate. Horizontal cyan line indicates y-axis position of the lateral XZ view (bottom). Bottom: lateral view of the organoid monolayers. Yellow vectors represent tractions. Representative of 3 experiments. Scale vector, 300Pa. All scale bars, 20 μm. Stiffness of all the gels, 5kPa.
Extended Data Fig. 2
Extended Data Fig. 2. Crypts fold through actomyosin driven apical constriction.
a, Top row: 3D tractions of the crypts treated with the indicated concentration of blebbistatin (Bleb). Yellow vectors represent components tangential to the substrate and the color map represents the component normal to the substrate. Bottom row: lateral views of the organoids along the crypt midline. Representative images from 3 independent experiments. Yellow vectors represent tractions. Scale bar, 20 μm. Scale vector, 200Pa. b-c, Crypt indentation (b), and normal traction (c) as a function of the distance to the crypt center for crypts treated with the indicated concentrations of blebbistatin for 3 hours. Data are represented as mean ± SEM of n=18 (DMSO), 24 (0.5 μM), 19 (1.5 μM) 22 (5 μM) and 20 (15 μM) crypts from 3 independent experiments. d, Olfm4 immunostaining in membrane-tdTomato organoids at baseline conditions and 11 hours after blebbistatin removal. Representative images from 2 independent experiments. Scale bar, 20 μm. e, Radial distribution of the apical (blue) and basal (red) F-actin intensity as a function of the distance to the crypt center on 0.7 kPa substrates. Scale bars, 20 μm. Data are presented as mean ± SD of n=12 crypts from 3 independent experiments. f, Bottom: Recoil velocity maps immediately after ablation of two crypts along the red lines on 0.7 kPa substrates. Left: a cut inside the TA. Right: a cut outside the TA. Scale vector, 1.5 μm/s. Top: the two crypts before ablation. Representative images from 3 independent experiments. Scale bar, 20 μm. g, Radial recoil velocity as a function of distance to crypt center for cuts between stem cell compartment and transit amplifying zone (green) and between transit amplifying zone and villus-like domain (blue) on 0.7 kPa substrates. Data are represented as mean ± SD of n= 14 (cut Stem / TA) and 10 (cut TA / Villus-like) crypts from 3 independent experiments. h, Representative kymographs of circumferentially averaged radial velocity as a function of the distance to the crypt center on 0.7 kPa (Top) and 5 kPa (bottom) substrates. Left: cut inside TA; right: Cut outside TA. The dashed black line indicates the time and position of the cut. Negative velocities point towards crypt center.
Extended Data Fig. 3
Extended Data Fig. 3. Apicobasal distribution of F-actin and Myosin in organoid monolayers.
a-b, Apical, medial and basal projections of F-Actin (Phalloidin, a) and myosin IIA-eGFP (b). The stem cell compartment (Stem), the Transit amplifying zone (TA) and the villus-like domain (villus-like) are zoomed in the regions of the monolayer indicated with the respective colors. Representative images from 4 (a) and 2 (b) independent experiments. Scale bars, 20 μm. Stiffness of the gel, 5kPa.
Extended Data Fig. 4
Extended Data Fig. 4. Morphometric analysis of the different cell types in the crypt.
a, Top, front and side 3D renders of a segmented stem cell (left), Paneth cell (center) and transit amplifying cell (right). b-c, Cell area (b) and aspect ratio (c) along the apicobasal axis of stem (green), Paneth (red) and TA (blue) cells on rigid (left, 15 kPa) and soft (right, 0.7 kPa) gels. n = 190 (stem cells), n = 21 (Paneth cells); n = 218 (transit amplifying cells) for 15 kPa gels. n = 596 (stem cells); n = 52 (Paneth cells); n = 301 (transit amplifying cells) for 0.7kPa gels. n = 3 crypts per stiffness from 2 (0.7kPa) and 3 (15kPa) independent experiments. Data are represented as mean ± SEM. d, Top: Apical and basal area of Paneth cells as a function of the distance to the crypt center on stiff (left, 15 kPa) and soft (right, 0.7 kPa) substrates. The boundary between the stem cell compartment and the transit amplifying zone is indicated in all the plots with a dashed vertical line. Bottom: Apicobasal tilt (left) and basal aspect ratio (right) of Paneth cells as a function of the distance to the crypt center on stiff (red, 15 kPa) and soft (blue, 0.7 kPa) substrates. n = 3 crypts per stiffness from 2 (0.7kPa) and 3 (15kPa) independent experiments. From center to edge bins, n = 3, 7 and 10 cells for 15 kPa gels and n = 11, 25 and 15 cells for 0.7 kPa gels. Data are represented as mean ± SEM.
Extended Data Fig. 5
Extended Data Fig. 5. Effect of myosin inhibition in organoid cell shape.
a-b, 3D segmentation of a crypt on 15 kPa gels under baseline conditions (a) and the same crypt after 3h treatment with 15μM of blebbistatin (b). Top: medial view. Bottom: lateral view. Representative images of 2 independent experiments. Scale bar, 20 μm. c-d, Apicobasal tilt (c) and basal aspect ratio (d) as a function of the distance to crypt center on rigid substrates (15 kPa) before and after blebbistatin. Vertical dashed line indicates the boundary between the stem cell compartment and the transit amplifying zone. From center to edge bins, n = 42, 72, 150 and 232 cells for baseline crypt and 39, 82, 131 and 209 for blebbistatin treatment. Data from 2 independent experiments.
Extended Data Fig. 6
Extended Data Fig. 6. 3D computational vertex model and simulation protocol.
a, Discretization of the tissue: the thick lines denote the intersection between cellular faces and the thin lines the triangulation of the cell surfaces. b, Pattern of apical, basal and lateral surface tensions prescribed in the initial regular cell monolayer. c, Equilibration of the initial regular monolayer with patterned surface tensions on a rigid substrate, where basal nodes are constrained to a plane but can slide horizontally. Initial state (i), equilibrated state (ii), and different view of equilibrated state with basal cell outline (iii). d, Coupling with a deformable substrate, modeled computationally with a tetrahedral mesh discretizing a hyperelastic block (i). The equilibrated crypt on a rigid substrate (c-ii) is further equilibrated on the deformable substrate (d-ii,iii).
Extended Data Fig. 7
Extended Data Fig. 7. Simulation of crypt normal tractions.
a, Pattern of apical, basal and lateral surface tensions prescribed in the initial regular cell monolayer. b, Maps of basal normal traction. (i) Raw normal tractions at the basal plane featuring sub-cellular fine-scale details. To compare with experimental averages, we filtered these tractions with a Gaussian filter with standard deviation of 6 μm, (ii). c, Computational model of the deformed crypt on a soft hyperelastic substrate. d, Crypt folding for two models with different basal tension profiles on soft and rigid substrates.
Extended Data Fig. 8
Extended Data Fig. 8. F-Actin and myosin IIA co-evolution during de novo crypt formation.
a-b, Apical and basal projections of F-Actin (Phalloidin, a) and myosin IIA-eGFP (b) of crypts at the indicated timepoints (2 days, 3 days, 4 days). The crypts are the same as in Fig. 6a. Representative images of 2 independent experiments c-d, Quantification of apical and basal myosin IIA intensity (c) and apical/basal myosin IIA ratio (d) at the Olfm4 positive and Olfm4 negative regions for the indicated timepoints. n= 14 (2d), 12 (3d) and 14 (4d) crypts from 2 independent experiments. For all the graphs, data is represented as Mean ± SD. All Scale bars, 20 μm. Stiffness of the gel, 5kPa. * (p<0.05) ***(p<0.001). Statistical significance was defined by a Kruskal-Wallis followed by a Dunn’s multiple comparison test (c: basal Olfm4+ and d) and one-way ANOVA followed by a Tukey multiple comparison test (c: apical Olfm4+, apical Olfm4- and basal Olfm4-). Only the statistical comparison between 2d and 4d is shown.
Fig. 1
Fig. 1. Tractions exerted by intestinal organoids define mechanical compartments.
a, Preparation of mouse intestinal organoids on 2D soft substrates. b, Organoids expressing membrane targeted tdTomato (Memb, basal plane) stained for cytokeratin 20 (CK20, basal plane), Lysozyme (Lys, apical plane), Olfm4 (basal plane) and Ki67 (basal plane). Scale bar, 20 μm. Images are representative of 3 independent experiments. c, Displacements of representative cells over 6.5h. Each color labels one cell. Note that one cell divided (green). Right: displacement vector of each cell. Scale bar, 20 μm. See also Supplementary Video 3. Representative of 3 independent experiments. d, Illustration of the boundaries between the stem cell compartment and the transit amplifying zone (green) and between the transit amplifying zone and the villus-like domain (blue). Scale bar, 20 μm. e, Top: 3D traction maps overlaid on a top view of an organoid. Yellow vectors represent components tangential to the substrate and the color map represents the component normal to the substrate. Bottom: lateral view along the crypt horizontal midline. Yellow vectors represent tractions. Scale vector, 200 Pa. Representative of 7 independent experiments. f, Circumferentially averaged normal tractions Tn (orange) and radial tractions Tr (purple) as a function of the distance to the crypt center. Blue and green dashed lines indicate the radii where Tn and Tr are zero, which closely correspond to the boundaries between functional compartments illustrated in d. Radial traction at villus is significantly different from 0 (One-Sample Wilcoxon test, p<0.0001). Data are represented as mean ± SD of n=37 crypts from 7 independent experiments.
Fig. 2
Fig. 2. A stiffness-independent normal traction folds the crypt.
a, Top: single confocal plane of representative crypts on substrates of increasing stiffness. Center: 3D traction maps. Yellow vectors represent components tangential to the substrate and the color map represents the component normal to the substrate. Bottom: lateral view along the crypt midline. Yellow vectors represent tractions. Scale bar, 20 μm. Scale vector, 200Pa. Representative images of n=14 (0.2kPa), 23 (0.7kPa), 23 (1.5kPa), 37 (5kPa) and 30 (15kPa) crypts from 2, 3, 3, 7 and 4 independent experiments, respectively. Crypt indentation (b), normal traction (c) and radial traction (d) as a function of the distance to the crypt center for substrates of different stiffness. Data are represented as mean ± SEM of n=23 (0.7kPa), 23 (1.5kPa), 37 (5kPa) and 30 (15kPa) for indentation (b) and n=14 (0.7kPa), 12 (1.5kPa), 36 (5kPa) and 30 (15kPa) crypts for tractions (c-d) from 3, 3, 7 and 4 independent experiments, respectively.
Fig. 3
Fig. 3. The size of the stem cell compartment decreases with substrate rigidity.
a, Immunostainings of Olfm4 and F-actin (phalloidin) on substrates of increasing stiffness. Due to pronounced crypt folding, for visualization purposes, the image on 0,7 kPa is a projection along the crypt medial plane. Representative images of 3 independent experiments. Scale bar, 20μm. b-d, Quantification of the stem cell compartment area (b); number of stem cells (c) and ratio between the number of stem and Paneth cells (d) for substrates of increasing stiffness. n = 16 (0.7kPa), 12 (1.5kPa), 16 (5kPa) and 16 (15kPa) crypts from 3 independent experiments. Statistical significance was determined by a one-way ANOVA followed by a Tukey multiple comparison test (b) and a Kruskal-Wallis followed by a Dunn’s multiple comparison test (c, d). Only statistically different pairwise comparisons are indicated. *(p<0.05) **(p<0.01); in b, p = 0.0305 for 0.7-5kPa and p = 0.0157 for 0.7-15kPa; in c, p = 0.0071 for 0.7-15kPa.
Fig. 4
Fig. 4. The crypt folds under tension generated by myosin II.
a, Traction maps under baseline conditions (left), after 3h of blebbistatin treatment (center), and after 11h of blebbistatin washout (right). Top: membrane targeted tdTomato (medial plane). Center: 3D traction maps. Yellow vectors represent components tangential to the substrate; color map represents the component normal to the substrate. Bottom: lateral view along the crypt midline. Representative images of 3 independent experiments. Scale vector, 200Pa. b, Normal traction as a function of the distance to crypt center before, during, and after blebbistatin. n=11 samples (3 independent experiments). c, Time evolution of normal traction for the stem cell compartment and the TA before, during and after blebbistatin treatment. n=11 samples (3 independent experiments). d, Lateral views of crypts seeded on 0.7kPa gels and treated with DMSO (top) or blebbistatin (bottom) for 3h. e, Indentation at the center of the crypt in cells treated with DMSO or blebbistatin for 3h. n=12 crypts from 2 independent experiments (p<0.0001, two-tailed unpaired Student’s t-test). f, F-actin (phalloidin) staining of crypts on 5kPa gels. Left and center: projections of basal (left) and apical (center) F-actin of a representative crypt. Top right: Lateral view of the same crypt. Bottom right: Radial distribution of apical (blue), basal (red) F-actin intensity as a function of the distance to crypt center. n=36 crypts (4 independent experiments). g, Bottom: Recoil velocity maps immediately after ablation of two crypts along the red lines. Left: cut inside the TA. Right: cut outside the TA. Scale vector, 1μm/s. Top: the two crypts before ablation. h, Radial recoil velocity as a function of distance to crypt center for cuts between stem cell compartment and TA (green) and between TA and villus-like domain (blue). n=14 (cut Stem/TA), n=11 (cut TA/Villus-like) crypts from 5 independent experiments. i, Indentation at the center of the crypt before and after cutting between the stem cell compartment and the TA. n=6 crypts from 2 independent experiments (p=0.0313, two-tailed Wilcoxon paired test). *** p<0.001, *p<0.05. Data represented as Mean ± SEM (b, c) or Mean ± SD (e, f, h). Scale bars, 20μm.
Fig. 5
Fig. 5. Crypts fold through apical constriction.
a-b, 3D Crypt segmentation on stiff (a, 15kPa) and soft (b, 0.7kPa) substrates. Representative of 3 crypts per stiffness from 2 (0,7kPa) and 3 (15kPa) independent experiments. Scale bar, 20 μm. c-d, 3D vertex model of a monolayer adhered to a stiff (c) and soft (d) substrate. The colors in the cell outlines indicate surface tension. e-f, Apical and basal area profiles on stiff (e, 15kPa) and soft (f, 0.7kPa) substrates (Mean ± SEM). Paneth cells were excluded from the analysis (see Extended Data Fig. 4). From center to edge bins, n=77, 198, 339, 307 cells for soft substrates and 32, 61, 102, 230 for stiff substrates from 2 (0,7kPa) and 3 (15kPa) independent experiments. g-i Cell height (g), apicobasal tilt (h) and basal aspect ratio (i) as a function of distance to crypt center on soft and stiff substrates (Mean ± SEM). Paneth cells were excluded from the analysis of the tilt and aspect ratio (see Extended Data Fig. 4). Vertical dashed line indicates boundary between stem cell compartment, the TA and the villus-like domain (in g). Crypts are the same as in panel e-f. For cell height profiles, from center to edge bins, n=77, 198, 339, 307, 242, 192, 159 cells for soft substrates and n=32, 61, 102, 230, 165, 125, 106 cells for stiff substrates. j-k, Simulated apical and basal area profiles on a rigid (j) and soft (k) substrate (Mean ± SEM). From center to edge bins, n=9, 26, 54, 230 simulated cells for soft substrate and n=10, 28, 54, 227 simulated cells for stiff substrate. l-n, Simulated cell height (l), apicobasal tilt (m) and basal aspect ratio (n) on soft and rigid substrates. Crypts are the same as in j-k. o, Simulated normal traction. p, Simulated tissue recoil after laser ablations (red) at the boundary between stem cell compartment and TA (left) or between TA and villus-like domain (right). Cyan vectors indicate tissue displacement right after ablation. Scale bar, 20 μm. q, Radial displacement in the two simulated cuts (Mean ± SD). Vertical dashed lines indicate cuts.
Fig. 6
Fig. 6. Co-evolution of cell fate and tissue mechanics during de novo crypt formation.
a, Immunostainings of Olfm4 and Cytokeratin 20 (CK20) following the development of the monolayers over 4 consecutive days (Top row). Scale bar, 200 μm. F-actin (phalloidin) and Olfm4 immunostaining (middle row) and lateral views of F-actin (bottom row) at the positions indicated with a dashed square in the corresponding monolayers of the top row. Scale bar, 20 μm. Representative images of 2 independent experiments. b, 3D tractions at the indicated time points. Yellow vectors represent components tangential to the substrate and the color map represents the component normal to the substrate. Scale bar, 20 μm. Scale vector, 300Pa. Representative images of 2 independent experiments. c-f, Quantification of Olfm4 intensity inside the Olfm4 positive foci (c); Cytokeratin 20 intensity (CK20) in the Olfm4 negative regions (d); area of the Olfm4 positive foci (e) and density of Olfm4 positive foci (f) at the indicated time points. n=90 (2d), 112 (3d) and 115 (4d) Olfm4 positive foci (c, e); n=6 (1d, 2d, 3d and 4d) circular patterns (d, f) from 2 independent experiments. g-h, Quantification of apical and basal F-actin intensity (g) and apical/basal F-actin ratio (h) in the Olfm4+ and Olfm4- regions for the indicated time points. n=14 (2d), 12 (3d) and 14 (4d) crypts from 2 independent experiments. i, Quantification of the mean normal traction at the stem cell compartment for the indicated timepoints. n=21 (2d), 18 (3d) and 16 (4d) crypts from 2 independent experiments. Data represented as Mean ± SD. Statistical significance determined by a Kruskal-Wallis followed by a Dunn’s multiple comparison test (c, e, i, g and h for Olfm4+), and a one-way ANOVA followed by a Tukey multiple comparison test (d, f and h for Olfm4-). In g-h, only the statistical comparison between 2d and 4d is shown. *(p<0.05), **(p<0.01), *** (p<0.001), ns (p>0.05).
Fig. 7
Fig. 7. Cell morphology and cytoskeletal organization of the intestinal epithelium in vivo.
a, F-actin (phalloidin) and nuclei (DAPI) in small intestinal tissue sections from myosin IIA-eGFP mice. Left: myosin IIA-eGFP signal. Center: Overlay of myosin IIA-eGFP, F-actin and nuclei. Right: Maximum intensity Z-projection of the overlayed channels to better visualize the continuity of the crypt-villus axis. Representative image of 13 crypt-villus units from 3 mice. Scale bar, 40 μm. b, Illustration of the quantification approach of myosin IIA intensity along the crypt-villus axis in tissue sections. Myosin intensity was measured at the basal (red) and apical (blue) sides of cells at the indicated crypt and villus regions. Note that the high myosin IIA intensity of stromal cells prevented accurate quantification of basal epithelial intensity at the villus. Representative image of 13 crypt-villus units from 3 mice. Scale bar, 20 μm. c, Apical and basal myosin IIA distribution along the crypt villus axis of tissue sections. Data are represented as mean ± SD of n = 13 crypt-villus units from 3 mice. d, Left: example of an intestinal crypt from membrane-tdTomato mice. Membrane signal (Memb) is overlaid with the nuclear signal (DAPI). Right: Cell segmentation of the same crypt. The basal contour of the crypt is delineated with a black dashed line. Individual cells are colored according to their tilting angle respect to the normal direction to the crypt contour (positive indicates towards the crypt bottom; negative indicates away from the crypt bottom). Representative image of 16 crypts from 3 mice. Scale bar, 20 μm. e, Cell tilt along the crypt axis. Data are represented as mean ± SD of n=16 crypts from 3 mice.
Fig. 8
Fig. 8. Cells are dragged out of the crypt towards the villus-like domain.
a-b, Representative velocity maps (right) overlaid on membrane-targeted tdTomato signal (shown in left panel) on 5kPa (a) and 0.7kPa (b) substrates. Due to pronounced crypt folding, for visualization purposes, the image on 0.7 kPa is a projection along the crypt medial plane. Representative image of 5 crypts from 3 independent experiments for 5kPa substrates and 7 crypts from 2 independent experiments for 0.7kPa. Scale bar, 40 μm. Scale vector, 5 μm/h. c-h, Kymographs showing the circumferentially averaged radial velocity (c, f), radial traction (d, g) and radial tension (e, h) on 5kPa (c-e) and 0.7kPa (f-h) substrates for 6.5 hours. Vertical dashed line indicates the boundary between the stem cell compartment and the transit amplifying zone. i-j, Time averaged radial profiles of traction, tension, velocity and cell division rate on 5kPa (i) and 0.7kPa (j) substrates. Vertical dashed line indicates the boundary between the stem cell compartment and the transit amplifying zone. Data are represented as mean ± SEM of n=5 crypts from 3 independent experiments for 5kPa substrates and n=7 crypts from 2 independent experiments for 0.7kPa (c-j). Note that for an unbounded monolayer, MSM computes stress up to a constant (Supplementary Note 2). Since laser cuts indicated tension everywhere in the monolayer, this constant was arbitrarily set so that the minimum tension throughout the time lapse was zero. k-m, Recoil velocity maps (top) and quantification of parallel and perpendicular velocity (bottom) immediately after laser ablation along the crypt-villus axis on 5kPa (k), 0.7kPa (l) substrates and simulations (m). Red line indicates ablated area. Yellow dashed line indicates crypt contour. Data are represented as mean ± SD of n=11 crypts from 3 independent experiments for 5kPa substrates and n=13 crypts from 4 independent experiments for 0.7kPa. Scale bars, 20 μm.

Comment in

References

    1. Chacón-Martínez CA, Koester J, Wickström SA. Signaling in the stem cell niche: regulating cell fate, function and plasticity. Development. 2018;145:dev165399. - PubMed
    1. Barker N, et al. Identification of stem cells in small intestine and colon by marker gene Lgr5. Nature. 2007;449:1003–1007. - PubMed
    1. Ritsma L, et al. Intestinal crypt homeostasis revealed at single-stem-cell level by in vivo live imaging. Nature. 2014;507:362–365. - PMC - PubMed
    1. Snippert HJ, et al. Intestinal crypt homeostasis results from neutral competition between symmetrically dividing Lgr5 stem cells. Cell. 2010;143:134–144. - PubMed
    1. Shyer AE, et al. Villification: How the gut gets its villi. Science. 2013;342:212–218. - PMC - PubMed

Publication types

MeSH terms

LinkOut - more resources