. 2021 Jul;17(7):828-836.
doi: 10.1038/s41589-021-00816-4. Epub 2021 Jun 21.

Predictable control of RNA lifetime using engineered degradation-tuning RNAs

Affiliations

Predictable control of RNA lifetime using engineered degradation-tuning RNAs

Qi Zhang et al. Nat Chem Biol. 2021 Jul.

Abstract

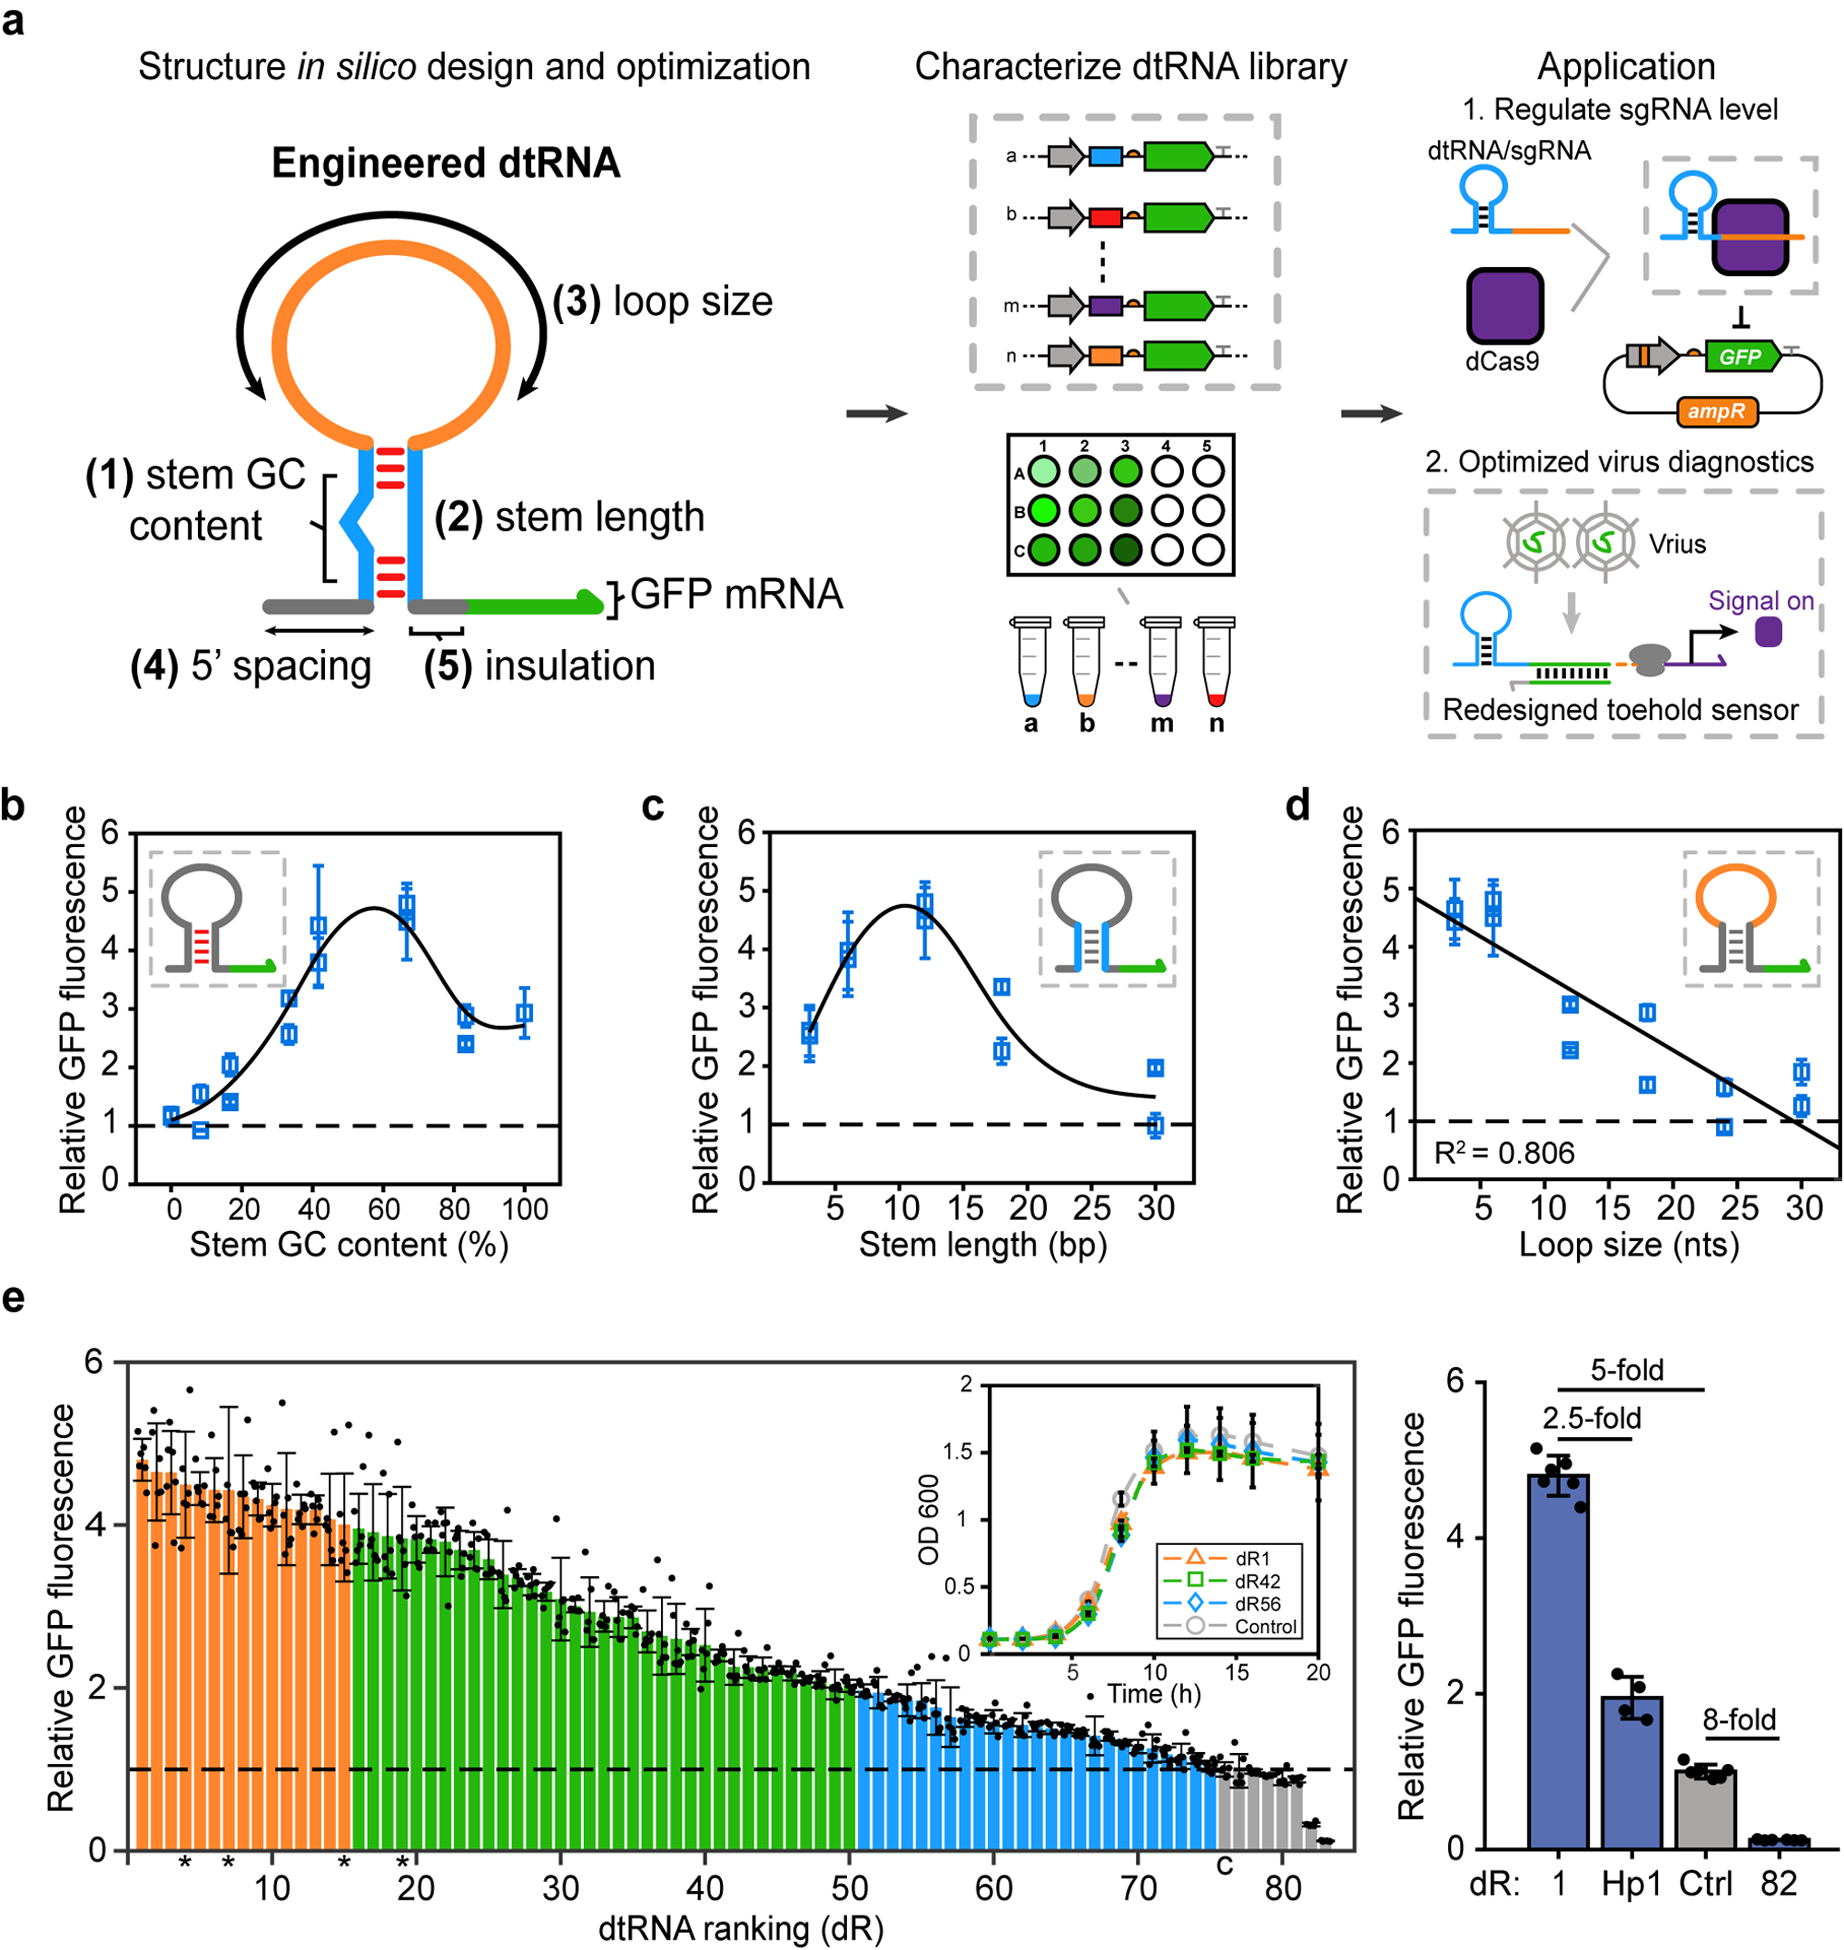
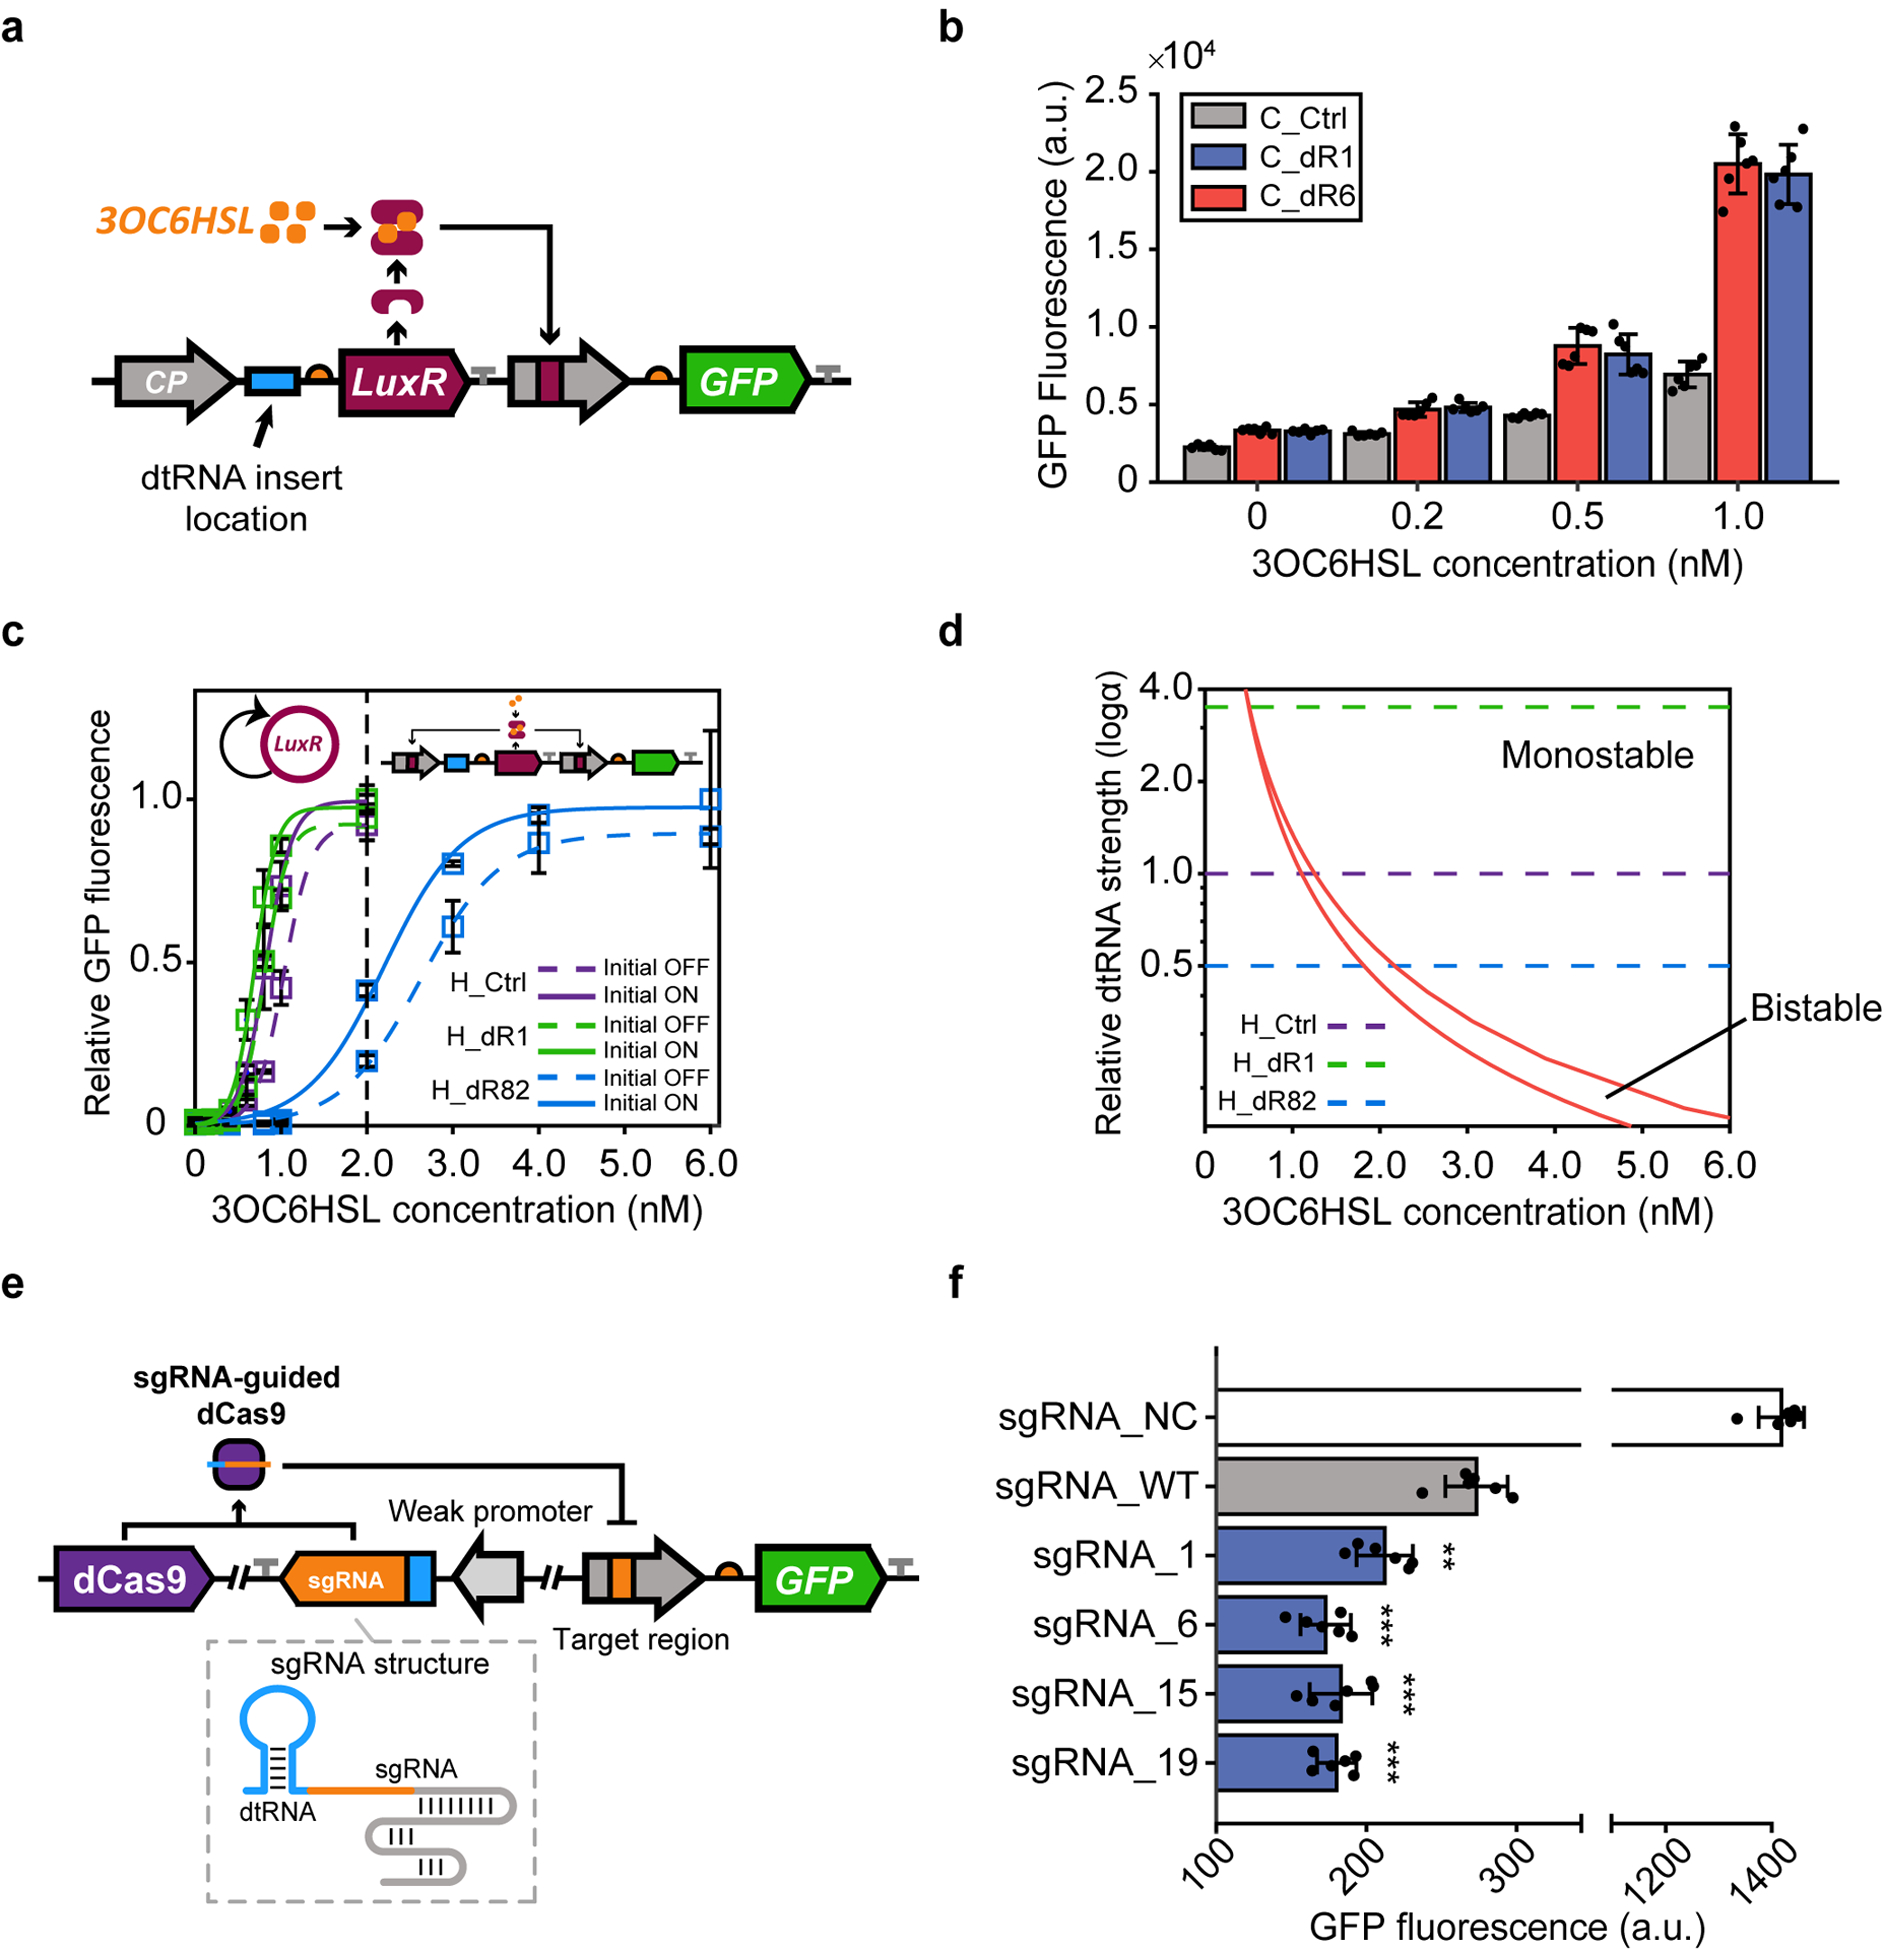
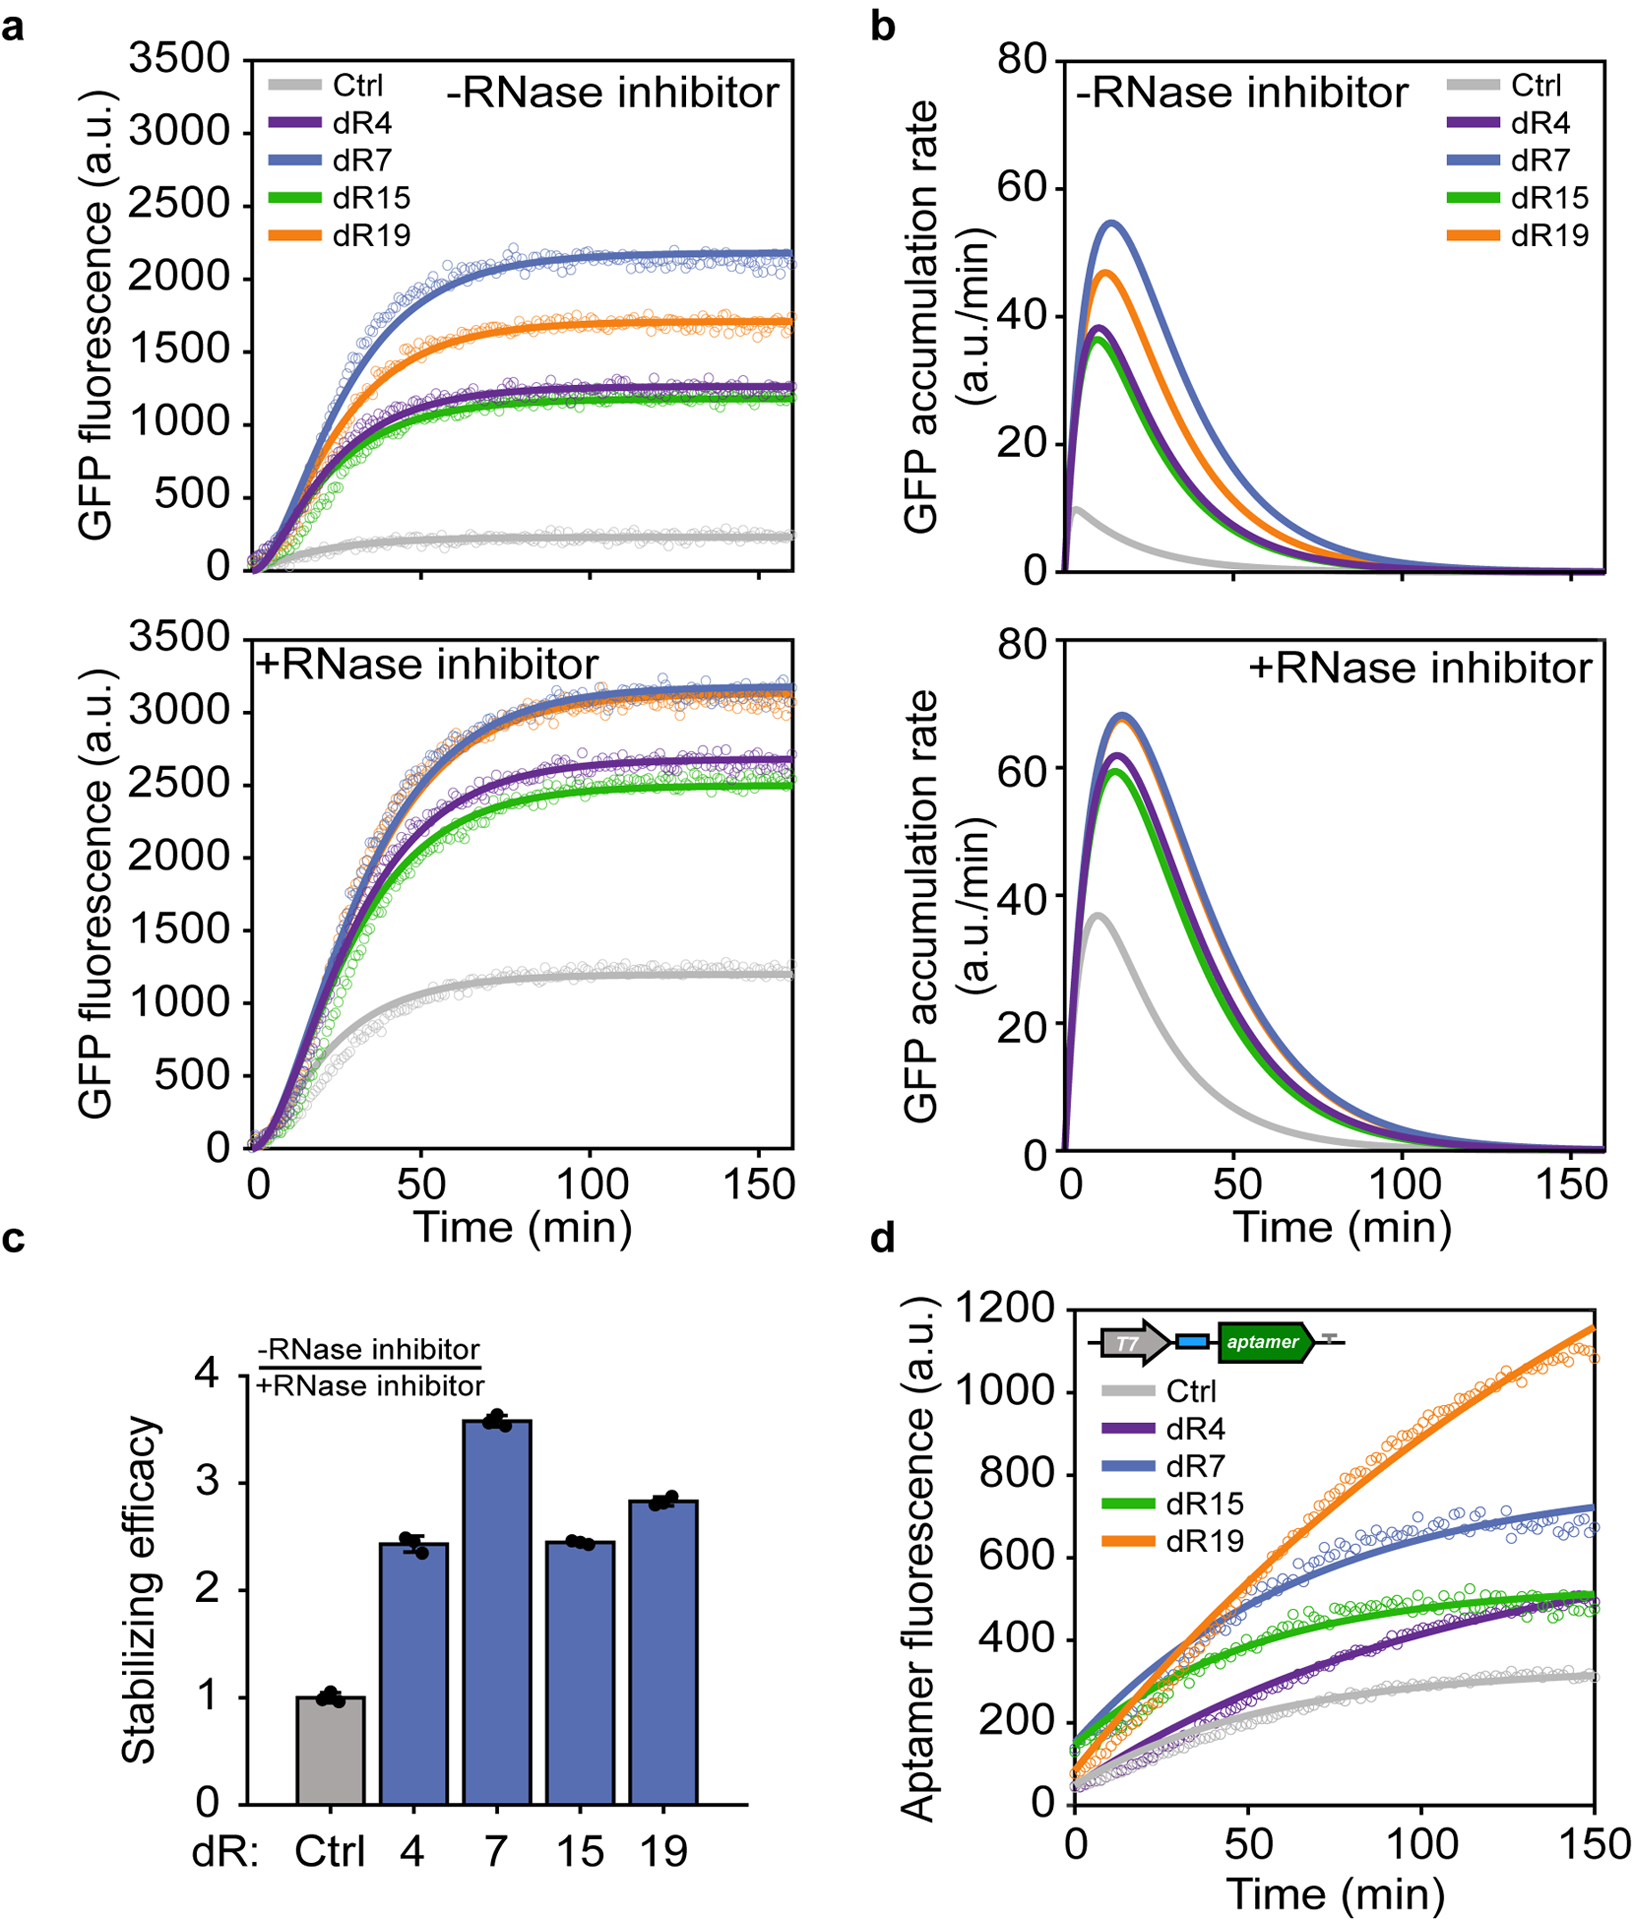
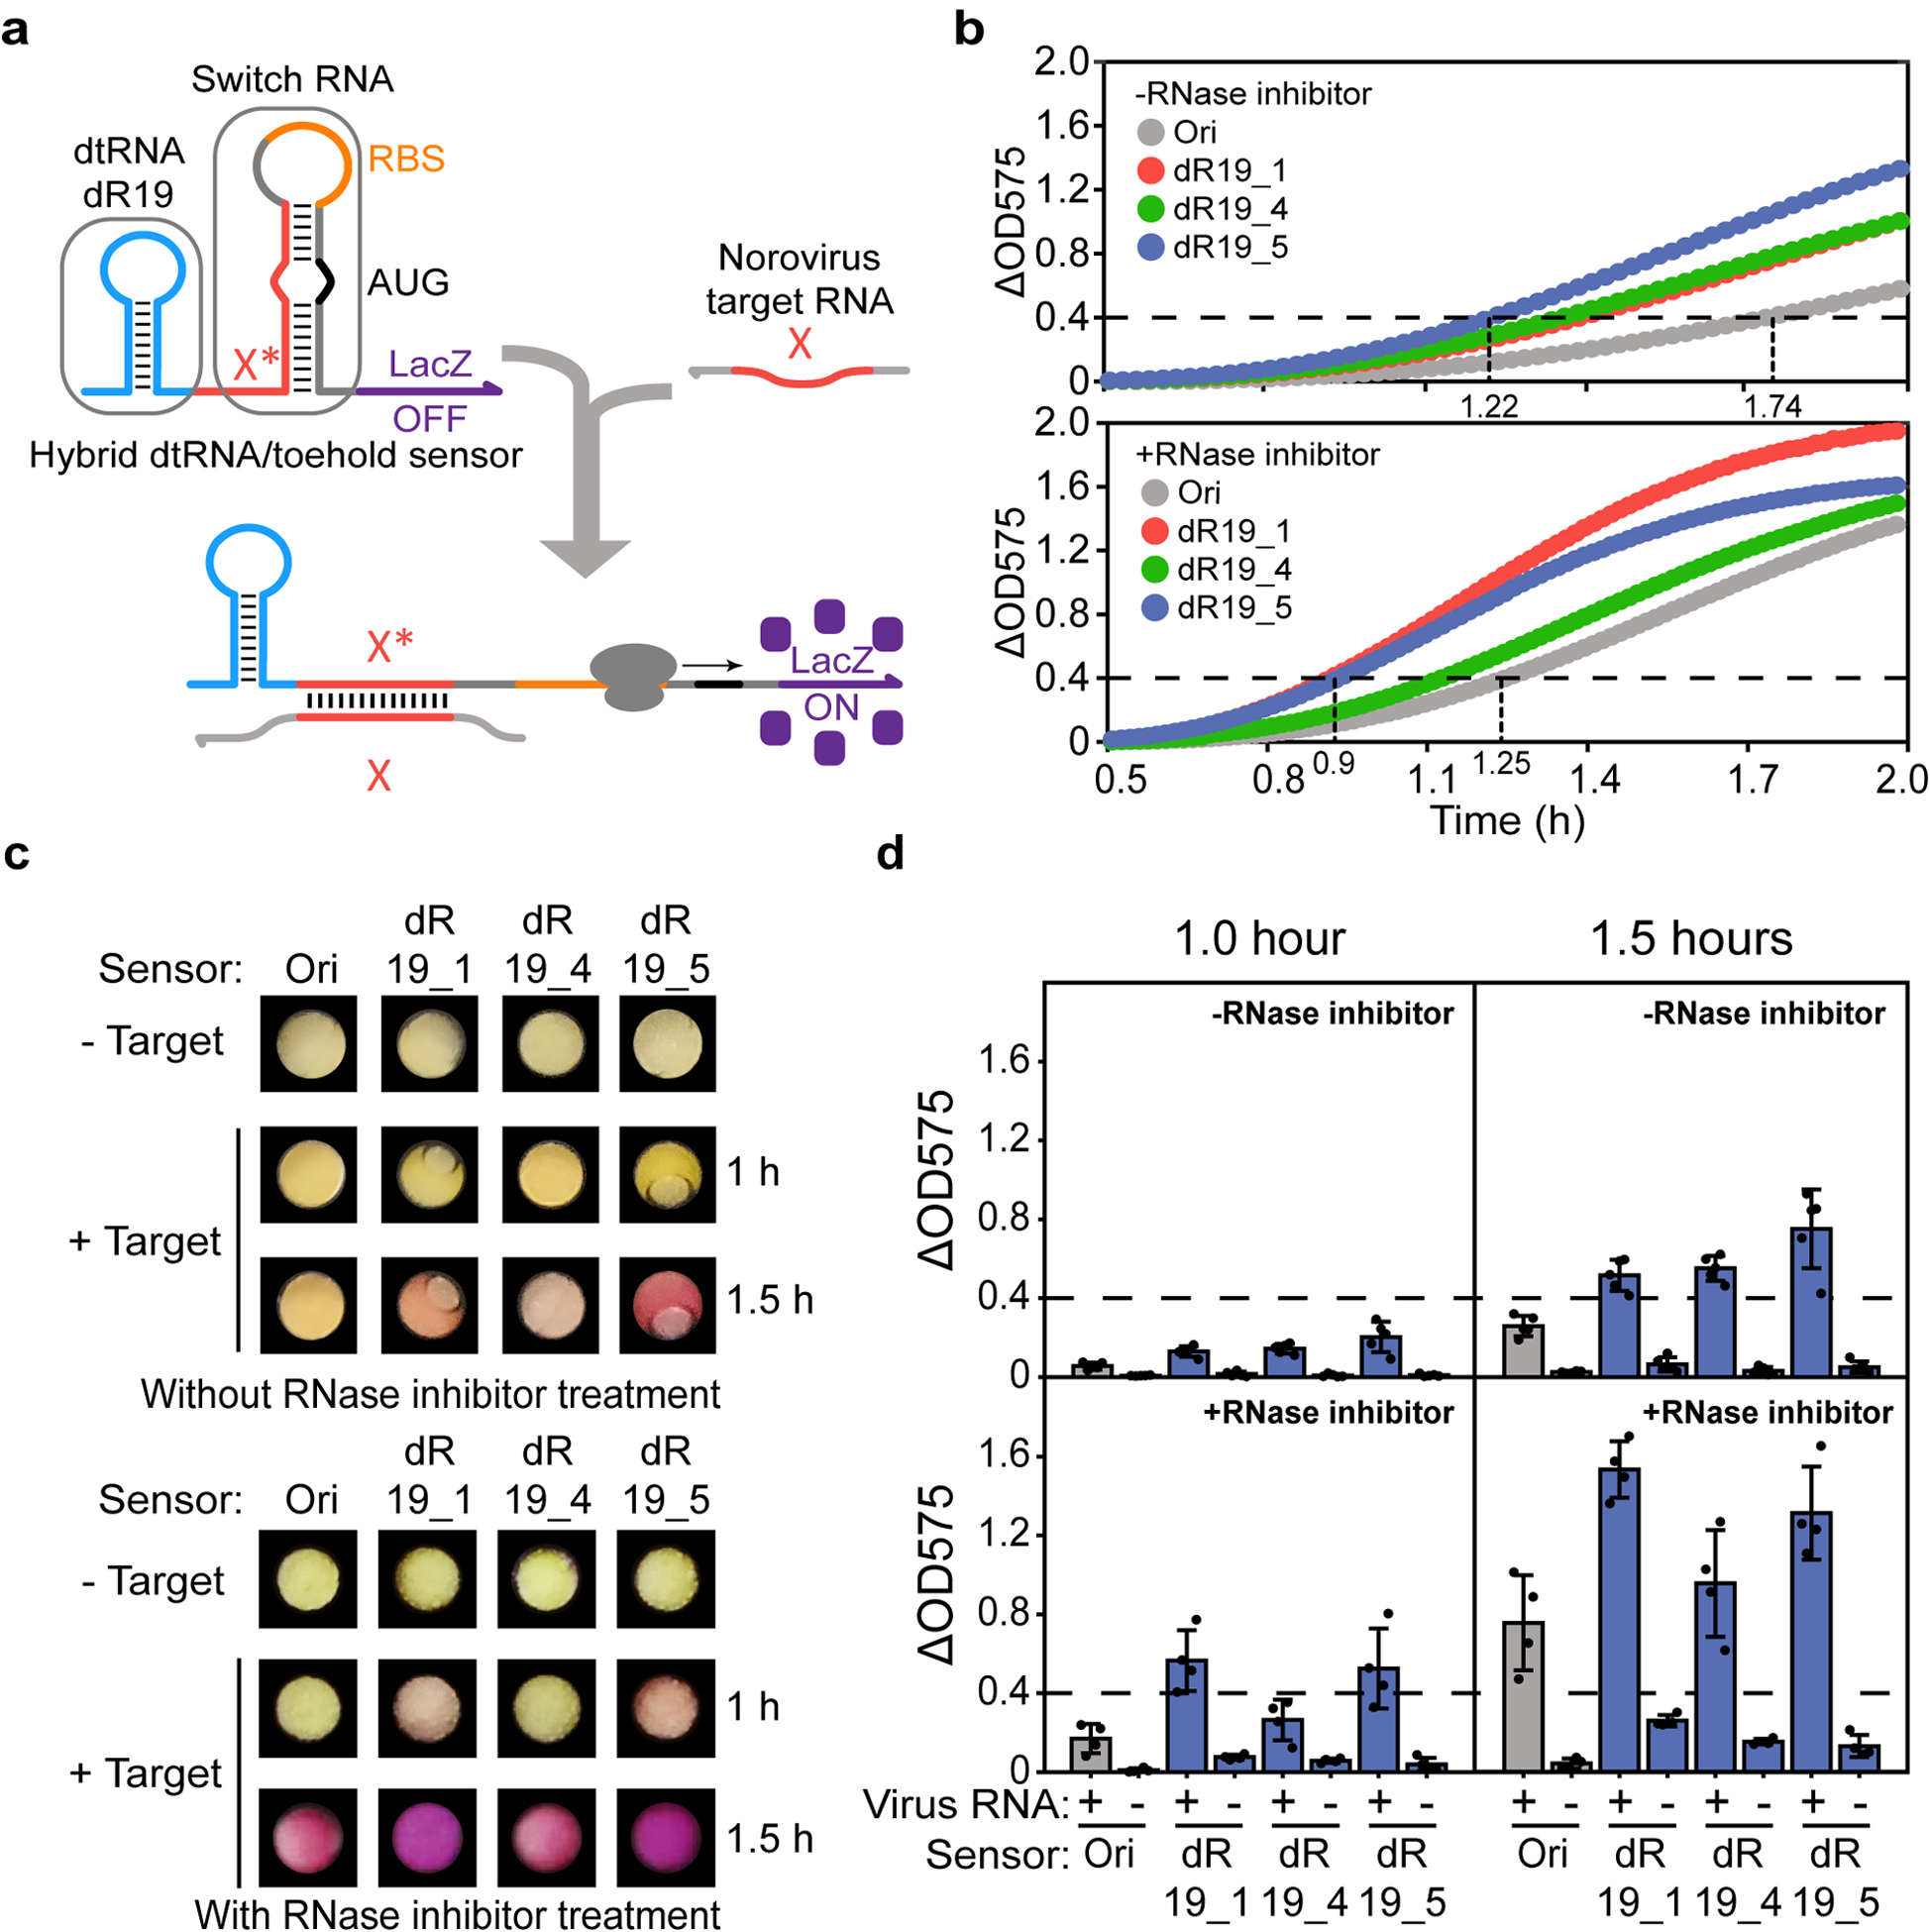
The ability to tune RNA and gene expression dynamics is greatly needed for biotechnological applications. Native RNA stabilizers or engineered 5' stability hairpins have been used to regulate transcript half-life to control recombinant protein expression. However, these methods have been mostly ad hoc and hence lack predictability and modularity. Here, we report a library of RNA modules called degradation-tuning RNAs (dtRNAs) that can increase or decrease transcript stability in vivo and in vitro. dtRNAs enable modulation of transcript stability over a 40-fold dynamic range in Escherichia coli with minimal influence on translation initiation. We harness dtRNAs in messenger RNAs and noncoding RNAs to tune gene circuit dynamics and enhance CRISPR interference in vivo. Use of stabilizing dtRNAs in cell-free transcription-translation reactions also tunes gene and RNA aptamer production. Finally, we combine dtRNAs with toehold switch sensors to enhance the performance of paper-based norovirus diagnostics, illustrating the potential of dtRNAs for biotechnological applications.


Conflict of interest statement

Competing interests

The authors declare the following competing financial interest(s): a patent application has been filed relating to this work.

Figures

Extended Data Figure 1
Extended Data Figure 1. Structure of ompA stabilizer and GFP expression measurement driven by a strong promoter.
(a) Schematic showing the structure of naturally occurring ompA stabilizer. (b-c) GFP fluorescence measurement results for circuits driven a strong promoter. (b) Design WT, Hp1 and Hp2 exhibits comparable GFP fluorescence. (c) Each design with small structure formation nearby RBS region shows low GFP fluorescence levels. Data represent the mean ± SD of four biological replicates. P (WT_I) = 0.0083, P (Hp1_I) = 0.0084, and P (Hp2_I) = 0.0497. n.s. (not significant) P > 0.05, * P < 0.05, ** P < 0.01, P value is measured by two-tailed student t test.
Extended Data Figure 2
Extended Data Figure 2. Fluorescence measurements on synthetic dtRNAs with inserted RNase E cleavage sites.
(a) Fifteen synthetic dtRNAs are designed without (-) or with single/multiple RNase E cleavage sites (UCUUCC) engineered into different structural regions of the stable dtRNA. The inserted regions are marked yellow (right). Fluorescence measurement result shows that insertion of cleavage sites have insignificant effects on RNA stability. (b) Fluorescence measurement for dtRNAs with multiple RNase E cleavage sites inserted into 18-nt loop region. (c) Characterize the effect of dtRNA 5’ spacing length on GFP expression. Seven dtRNAs with 5’ spacing lengths from 1-nt to 18-nt are designed to measurement their effect on GFP expression. (d) Fluorescence measurement of dtRNAs with RNase E cleavage sites engineered into 12-nt 5’ spacing region. All data represent the mean ± SD of six biological replicates.
Extended Data Figure 3
Extended Data Figure 3. Factors insignificantly affect dtRNA function.
(a) Relative GFP expression of circuits regulated by dtRNAs with or without the three-nucleotide bulge introduced in stem region. (b) Fluorescence measurement result for designs with the same stem feature but varying loop GC content. (c) Relative mRFP fluorescence regulated by selected dtRNAs with varying stabilizing abilities. Colors of the bar represent the fold enhancement of each dtRNA on GFP reporter. (d) Comparison between relative mRFP fluorescence and relative GFP fluorescence regulated by selected dtRNAs. The result exhibits high correlation (R2 = 0.8681) between the report gene expression suggesting dtRNA performance is transferable to the other genes with different sequence composition. (e) Commonality test for circuits with different promoters. Two promoters are selected (Biobrick number: J23105 and J23109, Supplementary Table 1) and engineered into the circuit with identical constructions. (f) Commonality test for circuits with different RBSs. Two RBSs (Biobrick number: B0031 and B0032) are engineered into the circuit with identical constructions (Supplementary Table 1). All data represent the mean ± SD of six biological replicates.
Extended Data Figure 4
Extended Data Figure 4. qPCR measurement and dtRNAs function prediction.
(a) RT-qPCR measurement of relative RNA levels for dtRNAs with diverse stabilizing efficiency. The result displays a strong correlation between relative RNA levels and relative GFP fluorescence (R2 = 0.9406). Data represent the mean ± SD of at least three biological replicates. (b) Relative fluorescence comparison between predicted relative GFP and observed relative GFP of circuits constructed followed by combined design rules (Supplementary Table 3). N is the total number for 54 single measurement regulated by additional designed dtRNAs (R2 = 0.5005). (c) Fluorescence measurement of dtRNA design f (Supplementary Table 3) without (left) or with (right) 18 nt 5’ spacing. Data represent the mean ± SD of six biological replicates. (d) Scatter plot reveals that structure MFE is not significantly correlated with GFP fluorescence enhancement regulated by synthetic dtRNA library (R2 = 0.000068). Data represent the mean ± SD of six biological replicates.
Extended Data Figure 5
Extended Data Figure 5. Hysteresis measurement for dtRNA-regulated positive feedback loop.
(a) Schematic showing the construction of positive feedback loop, dtRNA is only inserted at 5’ upstream of the LuxR gene. All genetic components are sharing the same colors as showed in Fig. 3a. (b) The hysteresis result of Fig. 3c regulated by dR1 and dR82 induced by 0 to 2 nM 3OC6HSL concentration. This figure serves to zoom in on lower induction doses shown in Fig. 3c to better visualize low dosage dynamics. (c) Hysteresis results for synthetic positive feedback circuit regulated by dR6 and dR81. Various concentrations of 3OC6HSL are applied to induce the circuit. The top panel is the enlarged result induced by 0 to 2 nM 3OC6HSL concentration. All data in b-c represent the mean ± SD of three biological replicates.
Extended Data Figure 6
Extended Data Figure 6. In vitro regulation of gene expression via synthetic dtRNAs.
(a) GFP fluorescence measurement results of designs without RNase inhibitor treatment. (b) GFP fluorescence measurement results of designs with RNase inhibitor treatment. All data represent the mean ± SD of three biological replicates. GFP fluorescence is measured every 50 seconds.
Extended Data Figure 7
Extended Data Figure 7. Relative GFP fluorescence comparison and in vitro dtRNA-regulated aptamer assay.
(a) Relative GFP fluorescence comparison among circuits regulated by the same dtRNAs in vitro and in vivo. Data represent the mean ± SD of at least three biological replicates. (b) Aptamer fluorescence measurement assay. (c) Comparison between in vivo relative GFP fluorescence and relative aptamer fluorescence in cell-free expression system. The result shows little correlation between relative GFP and aptamer fluorescence. Interestingly, dtRNAs with short stem-loop hairpins tend to exert stronger positive effect on aptamer fluorescence (green dots). (d) Aptamer fluorescence measurements with varying 5’ single-stranded length.
Extended Data Figure 8
Extended Data Figure 8. Two-hour in vitro norovirus diagnostics and the toehold sensor expression leakage.
(a) Leaky expression of sensors Ori, dR19_1 dR19_4 and dR19_5 without RNase inhibitor treatment. Leaky expression indicates the false positive result that reporter expresses even without viral input. (b) Plate reader measurement shows two-hour viral diagnostics result without RNase inhibitor treatment. “+” represents groups induced by synthetic norovirus RNA and “–” represents the negative control; The dash line indicates the detection threshold (ΔOD575 = 0.4). Data represent the mean ± SD of five biological replicates. (c) Plate reader measurement shows device dR19_2 and dR19_3 exhibit high expression leakage. Data represents the mean ± SD of five biological replicates. (d) Expression leakage of sensors Ori, dR19_1 dR19_4 and dR19_5 with RNase inhibitor treatment.
Fig. 1 |
Fig. 1 |. Modulation of RNA stability by native ompA stabilizer variants.
a, Schematic showing the stabilizer protection mechanism and the plasmid constructed for fluorescence measurements. The structure depicted by a red dashed line indicates the small hairpin structure design nearby the RBS of WT_I, Hp1_I and Hp2_I. For the plasmid map, the gray arrow represents the constitutive promoter; the blue rectangle represents the RNA stabilizer; the orange oval represents the RBS; the green box represents GFP gene; the gray T represents the transcriptional terminator. b, Plate reader measurement shows that GFP fluorescence is affected by engineered stabilizer variants. The designs adopt the whole (WT, P = 0.0264) or part (Hp1, P = 0.0048 and Hp2, P = 0.00048) of the native ompA stabilizer and exhibit GFP fluorescence enhancement. Low GFP expression is observed for circuits WT_I (P = 0.0004), Hp1_I (P =0.00037) and Hp2_I (P = 0.00039) with small hairpin structures nearby the RBS region. The gray bar represents the control circuit result (Ctrl). Data represent the mean ± SD of four biological replicates. * P < 0.05, ** P < 0.01, *** P < 0.001, P value is measured by two-tailed student’s t test. c, Comparison between relative mRNA level and relative GFP fluorescence for circuit WT, Hp1 and Hp2. The result shows a strong correlation between these two factors (R2 = 0.8997). Data represent the mean ± SD of at least three biological replicates.
Fig. 2 |
Fig. 2 |. Identifying functional structural features of synthetic dtRNAs.
a, Schematic showing the workflow for the present study. b-d, Correlations between each structural feature and the relative GFP expression. b, Correlation between dtRNA stem GC content (0% to 100%) and the relative GFP fluorescence, and the result was fitted using smoothing spline (solid curve); c, Correlation between dtRNA stem length (3 bp to 30 bp) and the relative GFP fluorescence, and the result was fitted using smoothing spline (solid curve); d, Correlation between dtRNA loop size (3 nt to 30 nt) and the relative GFP fluorescence, this result was linear fitted (solid line, R2 = 0.806). The insets color-code the characterized structural features of dtRNA, and the green arrow represents GFP mRNA. All data from b-d represent the mean ± SD of six biological replicates. e, (Left) Relative GFP fluorescence of synthetic dtRNA library. Orange bars represent designs with over 4-fold fluorescence enhancement; green bars represent designs with 2 to 4-fold enhancement; blue bars represent designs with 1-fold to 2-fold enhancement; gray bars represent designs with fluorescence lower than the control (c). Data represent the mean ± SD of six biological replicates. Asterisks represent the dtRNAs used for in vitro measurement. Inset: Growth curve measurement results showing the OD 600 values for dR1, dR42, dR56 and control over 20 hours. Data represent the mean ± SD of three biological replicates. (Right) Summary of GFP fold difference across dtRNA structures with the least and the most stable sequences, engineered stabilizer variant Hp1 (Fig. 1b) and the control. Data represent the mean ± SD of at least four biological replicates.
Fig. 3 |
Fig. 3 |. Using dtRNAs to modulate gene circuit dynamics and noncoding RNA levels.
a, Schematic showing the construction of the LuxR/LuxI quorum sensing gene circuit where a constitutive promoter (gray arrow) triggers the expression of LuxR gene (purple rectangle). After being expressed, the LuxR protein dimerizes with 3OC6HSL (orange dots) and interacts with the pLux promoter to activate GFP gene expression (green rectangle). The blue rectangle represents the location of dtRNA insertion (dR1 and dR6). b, Dose-response measurement results induced by various 3OC6HSL concentrations. Data represent the mean ± SD of six biological replicates. c, Hysteresis experiment results for the synthetic positive feedback loop (Extended Data Fig. 5a). The zoomed in hysteresis result of 0 to 2 nM (dashed line) 3OC6HSL concentration can be found in Extended Data Fig. 5b. The data represents the mean ± SD of three biological replicates. d, Two-parameter bifurcation analysis result. The red lines mark the bifurcation between the monostability and bistability. e, Schematic showing CRISPRi regulation controlled by dtRNAs. Selected dtRNAs (dR1, dR6, dR15 and dR19) are integrated with sgRNA which can guide dCas9 to repress GFP expression. f, Steady state fluorescence measurement for each CRISPRi system. All redesigned sgRNAs exhibit even lower GFP level compared to the original sgRNA (sgRNA_WT). sgRNA_NC represents the negative control result. Data represents the mean ± SD of six biological replicates. P (sgRNA_1) = 0.00277, P (sgRNA_6) = 0.000217, P (sgRNA_15) = 0.000665, P (sgRNA_19) = 0.000027. ** P < 0.01, *** P < 0.001, P value is measured by two-tailed student’s t test.
Fig. 4 |
Fig. 4 |. In vitro regulation of gene expression and RNA aptamer production via synthetic dtRNAs.
a, GFP expression measurement over time regulated by dtRNAs without (top)/with (bottom) RNase inhibitor treatment. Colored circles represent the observed mean GFP fluorescence of each design; solid lines represent model fitting results for each design. GFP fluorescence is measured every 50 seconds. b, Model simulation of GFP accumulation rate regulated by dtRNAs without (top)/with (bottom) RNase inhibitor treatment. c, Bar chart result shows the stabilizing efficacy of each dtRNA. Stabilizing efficacy is defined as the ratio between steady state GFP without RNase inhibitor and with RNase inhibitor treatment. The resultant values are further normalized against the control value. Data represent the mean ± SD of three biological replicates. d, RNA aptamer assay result showing Broccoli aptamer fluorescence regulated by dtRNAs (dR4, dR7, dR15 and dR19). Colored circles represent the observed aptamer fluorescence; solid lines represent model fitting results for each design. Aptamer fluorescence is measured every 90 seconds.
Fig. 5 |
Fig. 5 |. Redesigned dtRNA/toehold switch sensors improve the performance of paper-based viral diagnostics.
a, Schematic showing the structure of redesigned toehold switch sensors and their recognition of target RNAs. The dtRNA (dR19) is integrated upstream of the sensor for stabilization. During viral RNA recognition, the target RNA with a sequence X is recognized by the complementary X* region in the toehold switch. Binding through the single-stranded toehold region enables unwinding of the sensor hairpin to expose the RBS and start codon AUG for translation initiation. The synthetic dtRNA maintains its stable structure and protects the whole sensor transcript during the reaction. b, Norovirus diagnostics results without (top) and with (bottom) RNase inhibitor treatment. Each curve represents the average OD value of five reaction replicates. The details of each diagnostic result are shown in Supplementary Fig. 3. c-d, Photographs and their corresponding diagnostic results for each sensor after 1- or 1.5-hour reactions with/without RNase inhibitor treatment, respectively. + represents the addition of synthetic norovirus RNA to the sensor. - represents the negative control. The dashed line indicates the detection threshold for each device (ΔOD575 = 0.4). The data represents the mean ± SD of at least four biological replicates.

Similar articles

Cited by

References

    1. Cambray G, Guimaraes JC & Arkin AP Evaluation of 244,000 synthetic sequences reveals design principles to optimize translation in Escherichia coli. Nat Biotechnol 36, 1005–1015 (2018). - PubMed
    1. Delivering the promise of RNA therapeutics. Nat Med 25, 1321–1321 (2019). - PubMed
    1. Kole R, Krainer AR & Altman S RNA therapeutics: beyond RNA interference and antisense oligonucleotides. Nat Rev Drug Discov 11, 125–140 (2012). - PMC - PubMed
    1. Pardee K et al. Rapid, Low-Cost Detection of Zika Virus Using Programmable Biomolecular Components. Cell 165, 1255–1266 (2016). - PubMed
    1. Slomovic S, Pardee K & Collins JJ Synthetic biology devices for in vitro and in vivo diagnostics. Proc. Natl. Acad. Sci. U.S.A 112, 14429–14435 (2015). - PMC - PubMed

Publication types