. 2021 Aug;27(8):1401-1409.
doi: 10.1038/s41591-021-01383-w. Epub 2021 Jun 21.

Integrated genomic, epidemiologic investigation of Candida auris skin colonization in a skilled nursing facility

Collaborators, Affiliations

Integrated genomic, epidemiologic investigation of Candida auris skin colonization in a skilled nursing facility

Diana M Proctor et al. Nat Med. 2021 Aug.

Abstract

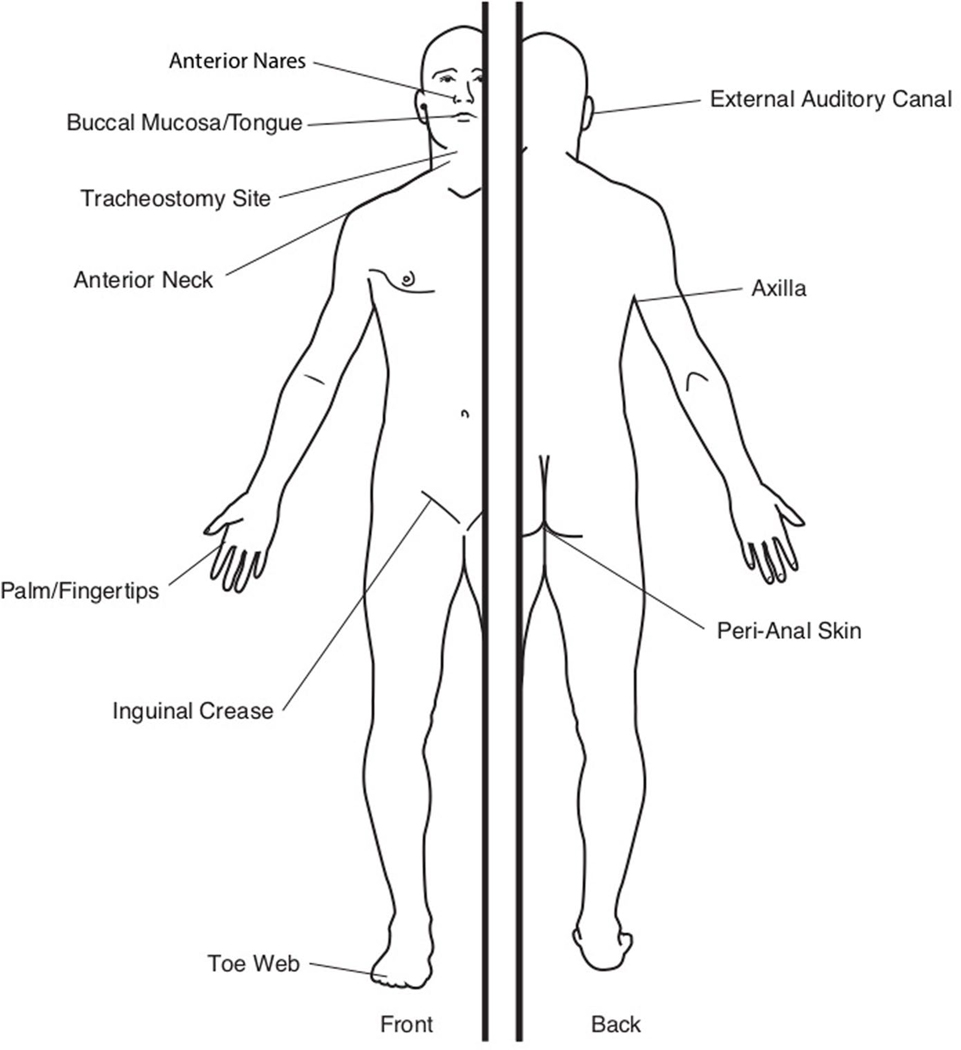
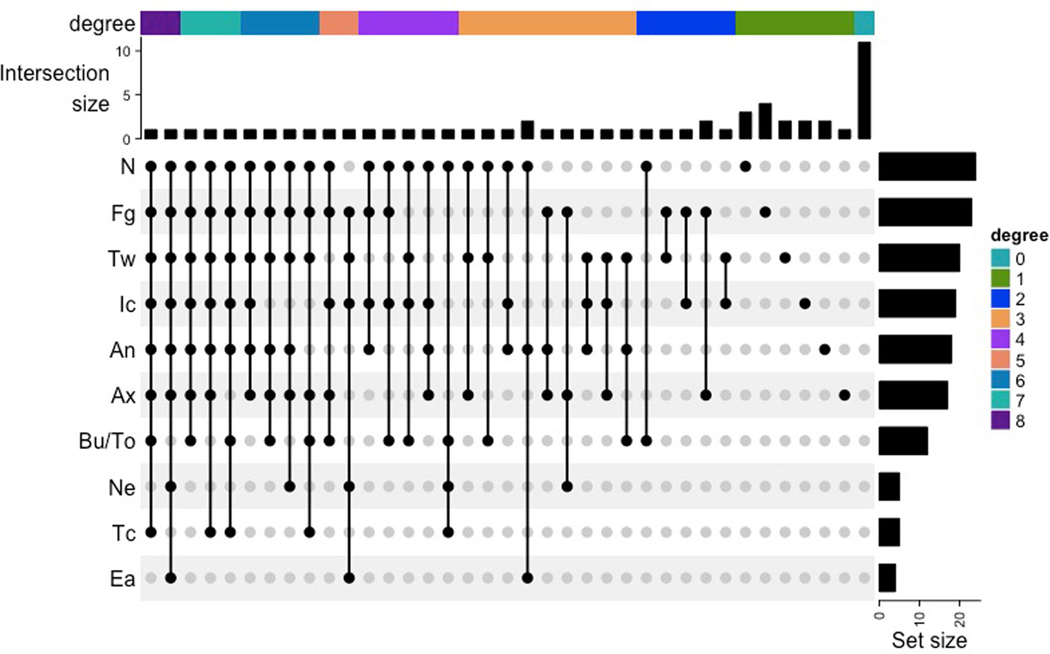
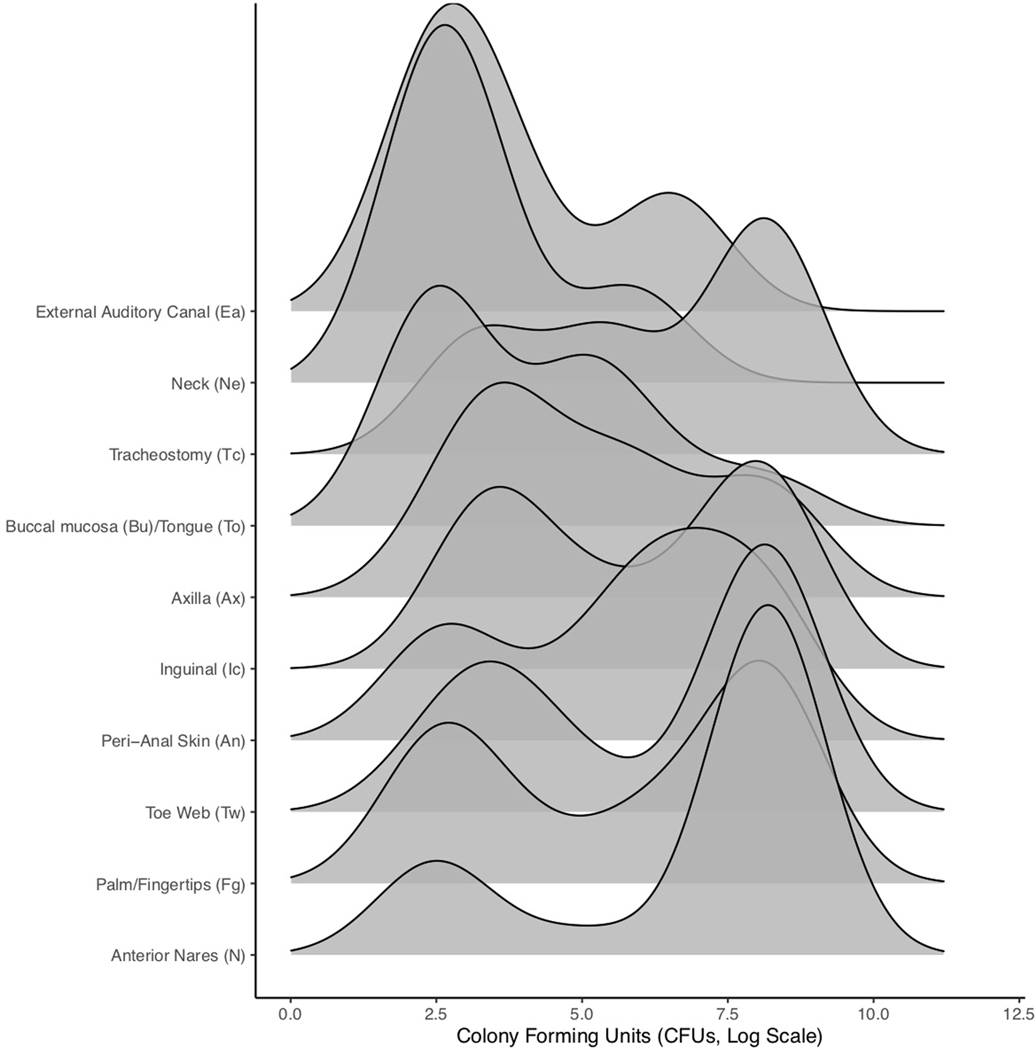
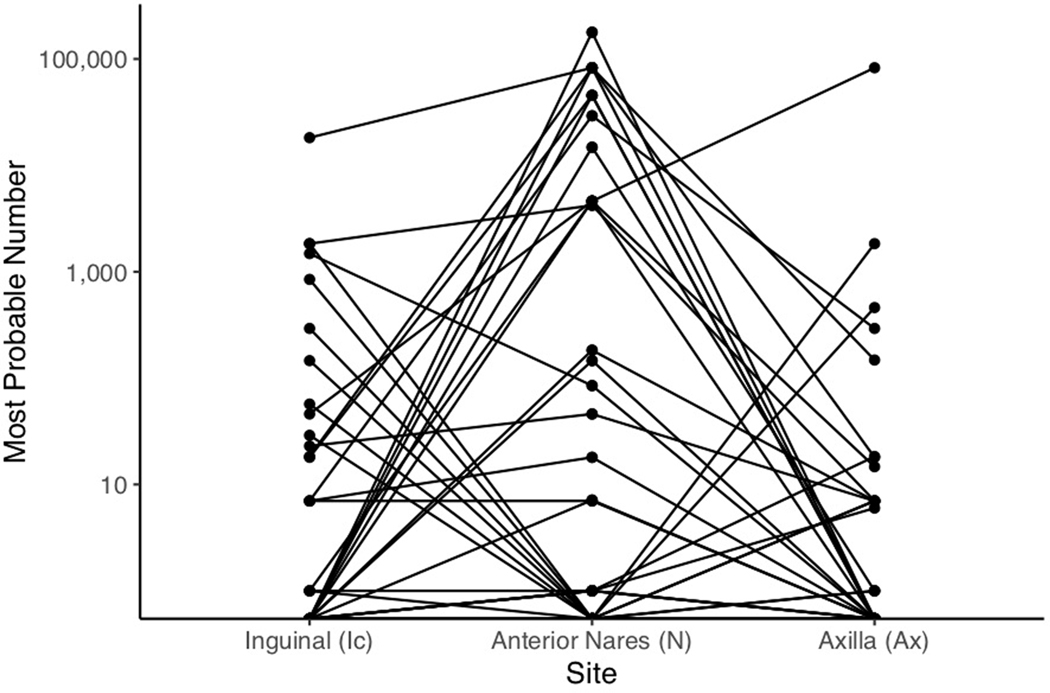
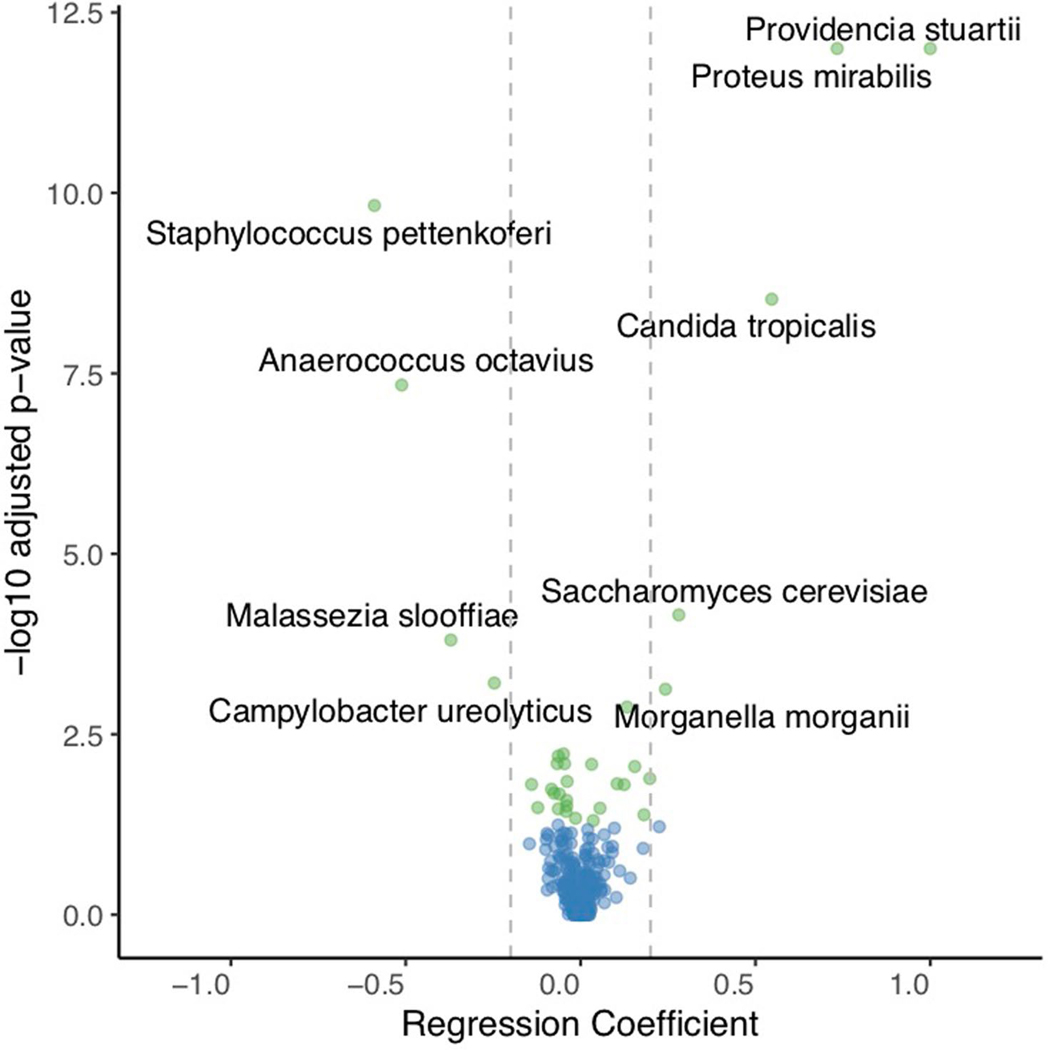
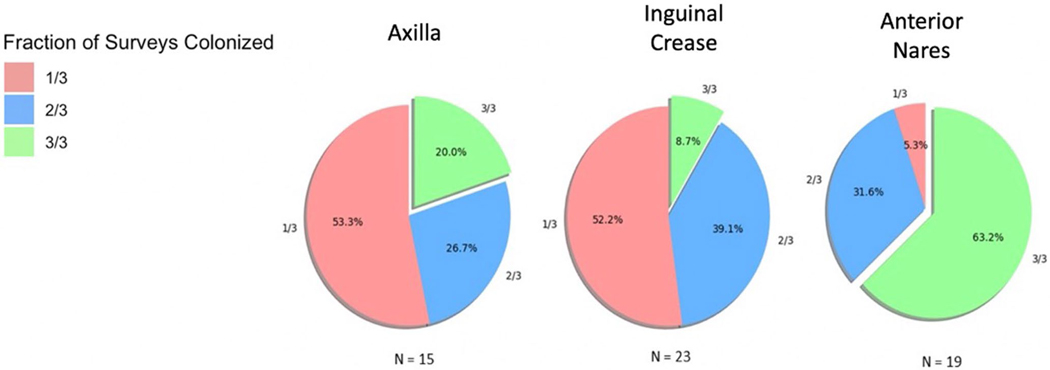
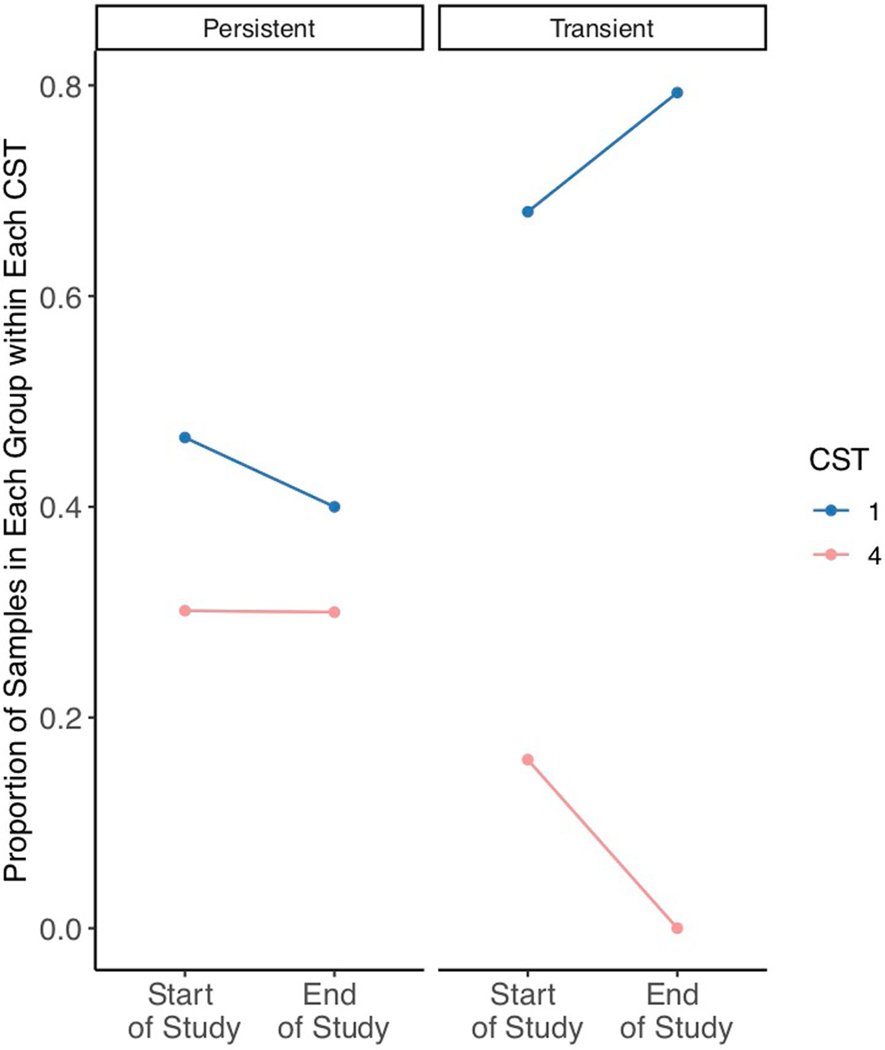
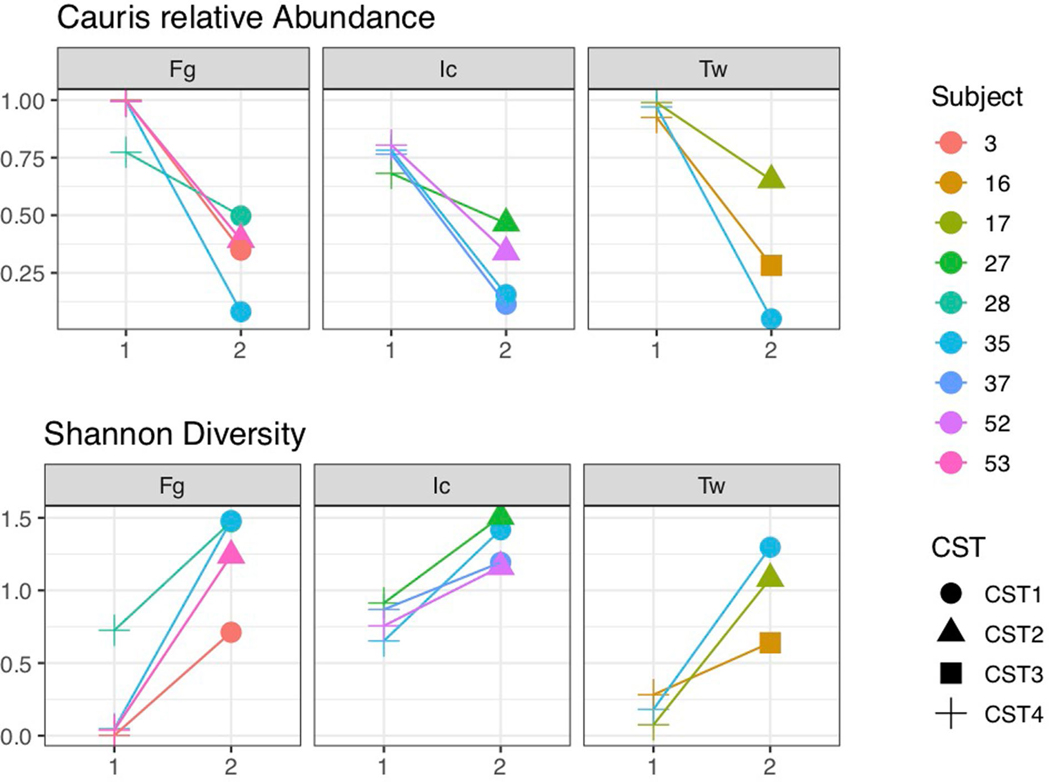
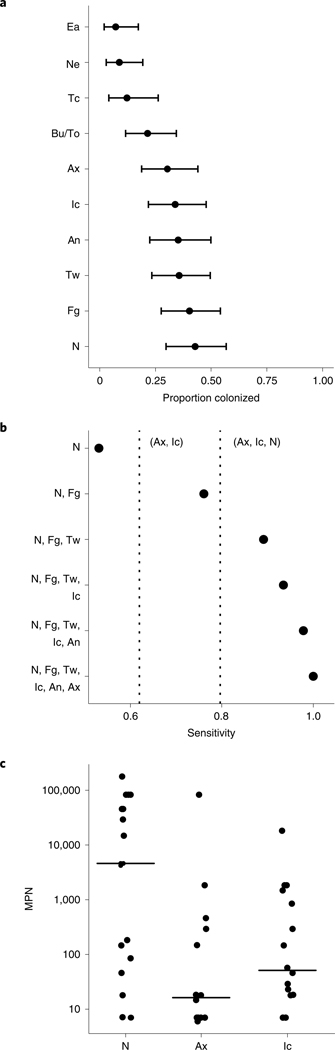
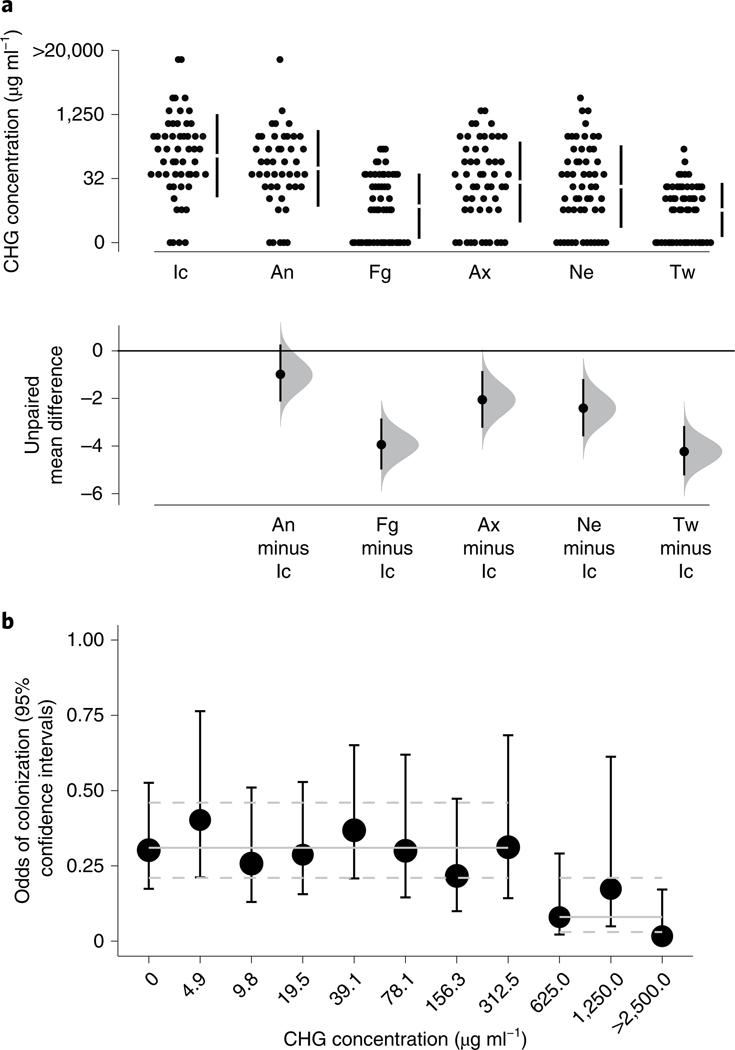
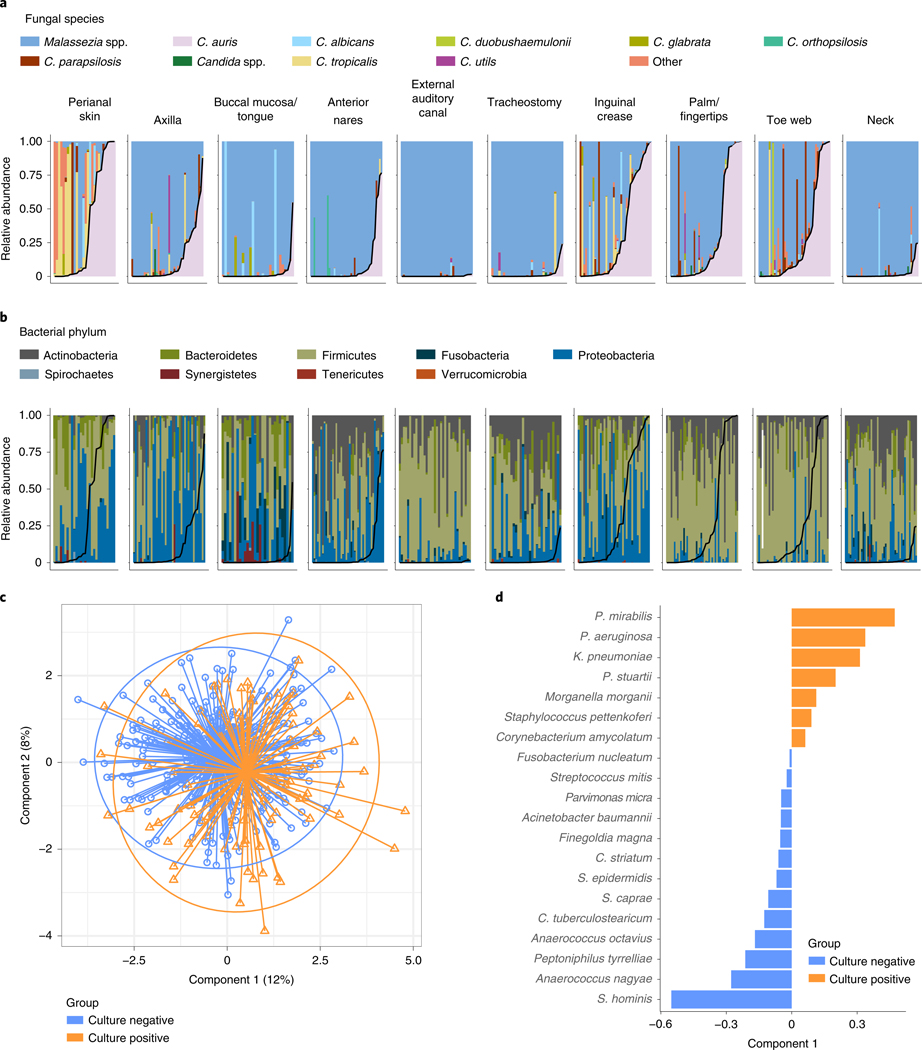
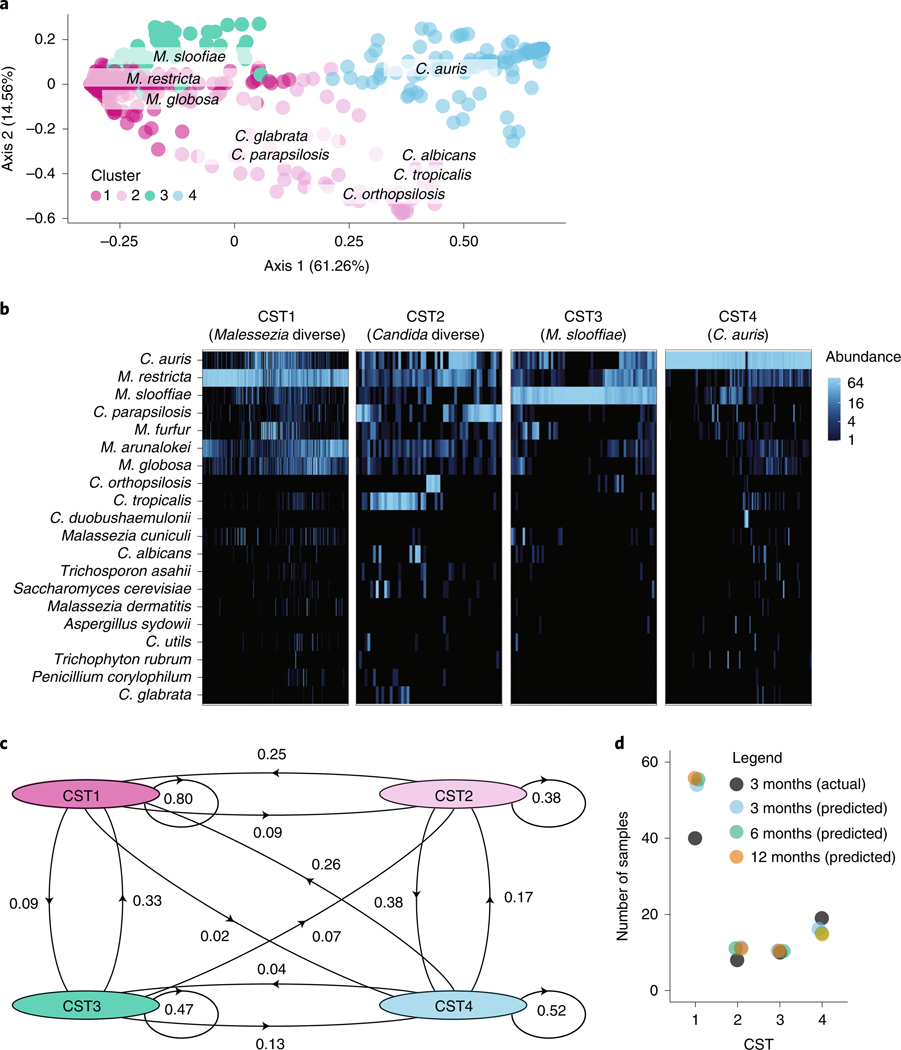
Candida auris is a fungal pathogen of high concern due to its ability to cause healthcare-associated infections and outbreaks, its resistance to antimicrobials and disinfectants and its persistence on human skin and in the inanimate environment. To inform surveillance and future mitigation strategies, we defined the extent of skin colonization and explored the microbiome associated with C. auris colonization. We collected swab specimens and clinical data at three times points between January and April 2019 from 57 residents (up to ten body sites each) of a ventilator-capable skilled nursing facility with endemic C. auris and routine chlorhexidine gluconate (CHG) bathing. Integrating microbial-genomic and epidemiologic data revealed occult C. auris colonization of multiple body sites not targeted commonly for screening. High concentrations of CHG were associated with suppression of C. auris growth but not with deleterious perturbation of commensal microbes. Modeling human mycobiome dynamics provided insight into underlying alterations to the skin fungal community as a possible modifiable risk factor for acquisition and persistence of C. auris. Failure to detect the extensive, disparate niches of C. auris colonization may reduce the effectiveness of infection-prevention measures that target colonized residents, highlighting the importance of universal strategies to reduce C. auris transmission.


Figures

Extended Data Fig. 1 |
Extended Data Fig. 1 |. Map of sample sites.
We surveyed 10 body sites per subject, including the anterior nares (N), tracheostomy site (Tc), anterior neck (Ne), palms/fingertips (Fg), buccal mucosa/tongue (Bu/To), inguinal crease (Ic), axilla (Ax), toe web (Tw), external auditory canal (Ea), and peri-anal skin (An).
Extended Data Fig. 2 |
Extended Data Fig. 2 |. Patterns of body site colonization visualized with UpSetR.
Colors map to degree, a measure of the number of co-colonized sizes. A total of 36 distinct co-colonization patterns were observed, each arranged from the left to the right as a function of decreasing degree. The intersection size is the number of subjects whose body-site colonization matches the points connecting sites for each of the 36 unique co-colonization patterns. For example, the nares (N) and fingertips/palm (Fg) are more frequently mono-colonized than any of the other sites while the buccal mucosa/tongue (Bu/To), neck (Ne), tracheostomy site (Tc), and external auditory canal (Ea) are never mono-colonized. Most patients have a distinct pattern of co-colonization with the most frequent pattern being singular colonization of the nares (N) or fingertips/palm (Fg). The set size corresponds to the frequency of colonization for each site for the first time point.
Extended Data Fig. 3 |
Extended Data Fig. 3 |. Ridgeline plot of sample colony counts for each site during the first survey.
The cumulative distribution for each ridgeline sums to 1, with peaks corresponding to peak bioburden (log colony forming units), for each site. For any given site, a bimodal distribution indicates a subset of subjects shared relatively high bioburdens and another a subset of subjects shared relatively low bioburdens. Sites with low level colonization include the external auditory canal and neck while sites having the highest bioburden include nares and inguinal crease.
Extended Data Fig. 4 |
Extended Data Fig. 4 |. Paired Most Probable Number (MPN) Analysis.
MPN estimates are shown for the inguinal crease, anterior nares, and axilla. Data represented are from the first point prevalence survey. Each line represents an individual. Individual trajectories reveal a large number of individuals with high counts at the nares and either absent or low-level colonization at the axilla or inguinal crease.
Extended Data Fig. 5 |
Extended Data Fig. 5 |. Volcano plot of statistical significance (-Log adjusted p-value) against the regression coefficients from linear mixed effects models.
Each point represents a regression coefficient for a bacterial or fungal species. The vertical lines demarcate regression coefficients of −0.2 and 0.2. Species having Holm adjusted p-values < 0.05 are highlighted in green while non-significant taxa are in blue. Species exhibiting a positive association with CHG concentration (skin concentrations (estimate > 0.2, Holm adjusted p < 0.05) include Providencia stuartii, Proteus mirabilis, Candida tropicalis, Saccharomyces cerevisiae and Morganella morganii. Species exhibiting a negative correlation with CHG skin concentrations (estimate < −0.2, Holm adjusted p < 0.05) include Staphylococcus pettenkoferi, Anaerococcus octavius, Malassezia slooffiae, and Campylobacter ureolyticus.
Extended Data Fig. 6 |
Extended Data Fig. 6 |. Evaluation of the robustness of cluster formation.
Weighted UniFrac (Wuf) and Bray-Curtis (Bray) distances were computed prior to partition around medoids analysis. The gap statistic (y-axis) is plotted as a function of K (x-axis), defined as the number of clusters evaluated. The error bars correspond to the confidence interval generated on 1000 bootstraps. The optimal number of clusters corresponds to K where additional clusters fail to increase the gap statistic using both a phylogenetically aware distance metric (UniFrac) and Bray Curtis.
Extended Data Fig. 7 |
Extended Data Fig. 7 |. Temporal stability of C. auris colonization at the axilla, inguinal crease and anterior nares.
Patients who were qualitatively categorized as positive at least once, based on MPN data, were categorized as positive in 1 of 3 (pink), 2 of 3 (blue) or 3 of 3 (green) surveys. The majority of subjects colonized at axilla and inguinal crease were positive in 1/3 surveys while the majority of individuals colonized at the nares were positive at all 3 surveys.
Extended Data Fig. 8 |
Extended Data Fig. 8 |. Proportion of sites within each CST over time for individuals who were either transiently or persistently colonized.
The proportion of samples dominated by C. auris (CST4) remained roughly constantly (∼30%) for individuals who were persistently colonized (Left). In contrast, the proportion of sites dominated by C. auris dropped from 16% to 0% from the first to the third time point in transiently colonized individuals (Right). Among those transiently colonized, the reduction in sites dominated by C. auris was accompanied by a concomitant increase in the proportion of sites dominated by commensal Malassezia species. Of special interest, the proportion of sites dominated by Malassezia species was higher across all time points for those who were transiently colonized compared to those persistently colonized.
Extended Data Fig. 9 |
Extended Data Fig. 9 |. Examination of the mycobiome at sites that transition away from C. auris domination between survey 1 and survey 2.
Colors correspond to unique subjects. Shapes correspond to the mycobiome CST. Across all panels, survey 1 or 2 is shown on the x-axis. On the y-axes, the relative abundance of C. auris (top panel) or Shannon diversity (bottom panel) is depicted. For this analysis we looked exclusively at sites that transitioned away from domination by C. auris at the first survey (Survey 1) towards domination by another species at the second time point (Survey 2).
Fig. 1 |
Fig. 1 |. Screening of multiple skin, nares, perianal and oral body sites for prevalence and individual-level bioburden of C. auris colonization.
a, The proportion of residents colonized at each body site. n = 542 independent samples of each of ten body sites of each of 57 residents at the time of the first screening. Data are presented as a point estimate ±95% confidence intervals. An, perianal skin; Ax, axilla; Bu, buccal mucosa; Ea, external auditory canal; Fg, palm and/or fingertips; Ic, inguinal crease; N, anterior nares; Ne, neck; Tc, tracheostomy; To, tongue; Tw, toe web. b, Sensitivity analysis to calculate the proportion of colonized residents captured by screening different groupings of sites. Sensitivity is defined as the proportion colonized at each site grouping divided by the total number of residents identified as colonized at any body site. Dashed vertical lines correspond to the sensitivity of two routine screening strategies targeting the body sites axilla and inguinal crease (left dashed line) and axilla, inguinal crease and nares (right dashed line). A minimum of six sites was required to achieve 100% sensitivity, capturing all colonized individuals. c, Number of viable C. auris, determined by the MPN, plotted for the inguinal crease (n = 16), nares (n = 19) and axilla (n = 16). Groupwise medians are demarcated with black lines. Statistical significance of differences between sites was assessed with the Kruskal–Wallis test (P < 0.05).
Fig. 2 |
Fig. 2 |. High concentrations of CHG are needed to reduce the odds of C. auris colonization.
a, Gardner–Altman estimation plot comparing the mean difference in CHG concentrations (µg ml−1) across body sites. Top, raw data are shown as a scatterplot of CHG concentration plotted as a function of body site for the first survey (54 residents, n = 319). Bottom, data are presented as the mean difference between CHG concentration (µg ml−1) at each body site and the inguinal crease, the site reaching the highest average CHG concentration, ±95% confidence intervals. Histograms reflect the sampling distribution from a nonparametric bootstrap. b, Each point represents the modeled odds of C. auris colonization (±95% confidence intervals) plotted against the measured skin CHG concentration (µg ml−1), adjusted for multiple measurements within resident and over time. The solid horizontal lines represent odds of colonization per respective group (that is, <625 µg ml−1 versus ≥625 µg ml−1), while the dashed lines encompass the 95% confidence interval surrounding each group estimate. Significance tests were based on the model-estimated log odds divided by the standard error, distributed as a t distribution.
Fig. 3 |
Fig. 3 |. Underlying skin microbiome (fungal and bacterial communities) integrated with C. auris–colonization status.
Panels represent the body-site-specific relative abundance of fungal (a) or bacterial (b) organisms. Bars represent the 51 participants, ordered by C. auris abundance. The inner black curve represents the relative abundance of C. auris for each sample for each participant. a, Relative abundance of fungal species at each body site surveyed for each participant. Colors correspond to fungal genera or individual Candida spp. Genera included in the ‘other’ category include Saccharomyces, Trichosporon, Trichophyton and Aspergillus. b, Relative abundance of bacteria, colored by phylum, reveals site-specific associations of C. auris with Proteobacteria. c,d, Colors correspond to sample or loadings associated with culture negativity or positivity. c, Sample projection across first and second components of sPLS-DA. d, Variable loadings across the first sPLS-DA component.
Fig. 4 |
Fig. 4 |. Skin fungal communities, dominated by Malassezia and Candida species, have differential stability, resilience and likelihood of invasion by C. auris.
a, Principal-coordinate analysis of the weighted UniFrac metric of the fungal community at each body site (toe webs, fingertips and/or palm, inguinal crease, anterior nares). Samples are shaded according to CST identity, as revealed by ‘partition around medoids’ analysis. CST1 tends to be dominated by M. restricta (N = 256, 53.0%), CST2 by a variety of Candida species (N = 52, 10.7%), CST3 by M. slooffiae (N = 62, 12.8%) and CST4 by C. auris (N = 113, 23.4%). Segregation of Malassezia and Candida species across the first axis explains 61% of the variance. Candida species segregate across the second major axis, which accounts for ∼15% of the variance. b, Relative abundance of the top 20 species in each sample, clustered by CST. Shading is based on the relative abundance of taxa within each sample. c, Self and interstate transition probabilities inferred for samples of the toe webs, palm and/or fingertips, inguinal crease and anterior nares. d, Scatterplot of the predicted numbers of samples in each CST at 3, 6 and 12 months after sample collection compared to the actual number of samples at 3 months. Predictions were generated using the Markov chain in c.

References

    1. Jeffery-Smith A et al. Candida auris: a review of the literature. Clin. Microbiol. Rev. 31, e00029–17 (2018). - PMC - PubMed
    1. Tsay S et al. Notes from the field: ongoing transmission of Candida auris in health care facilities—United States, June 2016–May 2017. MMWR Morb. Mortal. Wkly Rep. 66, 514–515 (2017). - PMC - PubMed
    1. Vallabhaneni S et al. Investigation of the first seven reported cases of Candida auris, a globally emerging invasive, multidrug-resistant fungus—United States, May 2013–August 2016. Am. J. Transplant. 17, 296–299 (2017). - PubMed
    1. Chen J et al. Is the superbug fungus really so scary? A systematic review and meta-analysis of global epidemiology and mortality of Candida auris. BMC Infect. Dis. 20, 827 (2020). - PMC - PubMed
    1. Centers for Disease Control and Prevention. Antibiotic Resistance Threats in the United States, 2019 (US Department of Health and Human Services, CDC, 2019). .

Publication types