. 2022 Apr;12(3):285-298.
doi: 10.1089/brain.2021.0015. Epub 2021 Aug 23.

A Wavelet-Based Approach for Estimating Time-Varying Connectivity in Resting-State Functional Magnetic Resonance Imaging

Affiliations

A Wavelet-Based Approach for Estimating Time-Varying Connectivity in Resting-State Functional Magnetic Resonance Imaging

Antonis D Savva et al. Brain Connect. 2022 Apr.

Abstract

Introduction: The selection of an appropriate window size, window function, and functional connectivity (FC) metric in the sliding window method is not straightforward due to the absence of ground truth. Methods: A previously proposed wavelet-based method was accordingly adjusted for estimating time-varying FC (TVFC) and was applied to a large high-quality, low-motion dataset of 400 resting-state functional magnetic resonance imaging data. Specifically, the wavelet coherence magnitude and relative phase were averaged across wavelet (frequency) scales to yield TVFC and synchronization patterns. To assess whether the observed fluctuations in TVFC were statistically significant (dynamic FC [dFC]; the distinction between TVFC and dFC is intentional), surrogate data were generated using the multivariate phase randomization (MVPR) and multivariate autoregressive randomization (MVAR) methods to define the null hypothesis of dFC absence. Results: By averaging across all frequencies, core regions of the default mode network (DMN; medial prefrontal and posterior cingulate cortices, inferior parietal lobes, hippocampal formation) were found to exhibit dFC (test-retest reproducibility of 90%) and were also synchronized in activity (-15° ≤ phase ≤15°). When averaging across distinct frequency bands, the same dynamic connections were identified, with the majority of them identified in the frequency range (0.01, 0.198) Hz, though with lower test-retest reproducibility (<66%). Additional analysis suggested that MVPR method better preserved properties (p < 10-10), including time-averaged coherence, of the original data compared with MVAR approach. Conclusions: The wavelet-based approach identified dynamic associations between the core DMN regions with fewer choices in parameters, compared with sliding window method. Impact statement We employed a wavelet-based method, previously used in the literature, and proposed modifications to assess time-varying functional connectivity in resting-state functional magnetic resonance imaging. With this approach, dynamic connections within the default mode network were identified, involving the medial prefrontal and posterior cingulate cortices, inferior parietal lobes, and hippocampal formation, which were also highly consistent in test-retest analysis (test-retest reproducibility of 90%), without the need to select window size, window function, and functional connectivity metric as with the sliding window method, whereby no consensus on the appropriate choices of hyperparameters currently exists in the literature.

Keywords: Morlet wavelet; dynamic functional connectivity; multivariate autoregressive randomization; multivariate phase randomization; surrogate data; wavelet transform coherence.


Conflict of interest statement

No competing financial interests exist.

Figures
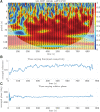
FIG. 1.
FIG. 1.
Representative example of WTC, TVFC, and time-varying relative phase. (A) WTC and relative phase estimated from the mPFC–PCC time series from a representative subject (HCP 156536; mean FD = 0.076 mm; LR scanning session). Right pointing arrows indicate 0° relative phase, while upward pointing arrows denote relative phase of 90° (plotted for coherence values >0.5); (B) TVFC and (C) time-varying relative phase. For averaging coherence and phase in (B) and (C), respectively, values across all frequency scales and outside the COI (shaded area) were considered. COI, cone of influence; FD, framewise displacement; HCP, human connectome project; LR, left–right encoding; mPFC, medial prefrontal cortex; PCC, posterior cingulate cortex; TVFC, time-varying functional connectivity; WTC, wavelet transform coherence. Color images are available online.
FIG. 2.
FIG. 2.
TAC. Thresholded WTC at the 95th percentile (left) and TAC curves (right) within each phase interval for a representative low-motion subject (HCP 156536; mean FD = 0.076 mm; LR dataset). The highest coherence between mPFC and PCC regions was observed for the phase interval 0 ± π/4 (blue curve in the right panel). TAC denotes the coherence distribution across the scanning session at different frequency scales relative to phase values. TAC, time-averaged coherence. Color images are available online.
FIG. 3.
FIG. 3.
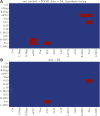
Dynamic connections within DMN using the MVPR approach. Dynamically connected region pairs (p < 0.05, Bonferroni corrected) for (A) LR and (B) RL datasets, identified by averaging coherence values across all frequency scales. The identified dynamically connected pairs involve regions of the medial prefrontal and posterior cingulate cortices, inferior parietal lobes and hippocampal formation, which have been characterized as the core DMN regions. ACG, anterior cingulate gyrus; Cer, cerebellum; DMN, default mode network; L-Hipp, left hippocampus; L-IP, left inferior parietal; L-IP(2), left inferior parietal—2; L-MFG, left middle frontal gyrus; MVPR, multivariate phase randomization; Prec, precuneus; R-Hipp, right hippocampus; R-IP, right inferior parietal; RL, right–left encoding; R-MFG, right middle frontal gyrus; Thal, thalamus. Color images are available online.
FIG. 4.
FIG. 4.
Dynamic connections within DMN using the MVAR approach. Dynamically connected region pairs (p < 0.05, Bonferroni corrected) for (A) LR and (B) RL datasets, identified by averaging coherence values across all frequency scales. Color images are available online.
FIG. 5.
FIG. 5.
Time-varying relative phase distribution. Circular histograms (blue lines) of mPFC–PCC TVRP values from all subjects for the LR (left panel) and RL (right panel) datasets. TVRP values were estimated by averaging phase values across all frequency scales. The red lines denote the circular mean (ā) and the black vectors denote the circular spread (r) of the data, while the confidence interval of the mean is provided in the title (confidence level of 0.05). The mPFC–PCC pair apart from being dynamically connected (Fig. 3) was synchronized in time for both scanning sessions. Color images are available online.
FIG. 6.
FIG. 6.
Frequency-dependent dynamic connections within DMN using the MVPR approach. Identified dynamically connected region pairs (LR dataset, p < 0.05, Bonferroni corrected) by averaging coherence values across the specified frequency bands. The majority of dynamic connections were found in the frequency range (0.01, 0.198) Hz (scales between 5.1 and 100 sec) involving the core DMN regions. Color images are available online.
FIG. 7.
FIG. 7.
Frequency-dependent dynamic connections within DMN using the MVPR approach. Identified dynamically connected region pairs (RL dataset, p < 0.05, Bonferroni corrected) by averaging coherence values across the specified frequency bands. The majority of dynamic connections were found in the frequency range (0.01, 0.198) Hz (scales between 5.1 and 100 sec) involving the core DMN regions. Color images are available online.
FIG. 8.
FIG. 8.
Number of dynamic connections for each region. The mPFC, PCC, L/R-IP, and L/R-MFG were found to be involved in the majority of dynamic connections. Color images are available online.

References

    1. Allen EA, Damaraju E, Plis SM, et al. . 2014. Tracking whole-brain connectivity dynamics in the resting state. Cereb Cortex 24:663–676. - PMC - PubMed
    1. Andrews-Hanna JR, Reidler JS, Sepulcre J, et al. . 2010. Functional-anatomic fractionation of the brain's default network. Neuron 65:550–562. - PMC - PubMed
    1. Berens P. 2009. CircStat: AMATLABToolbox for circular statistics. J Stat Softw 31:21.
    1. Buckner RL, Andrews-Hanna JR, Schacter DL. 2008. The brain's default network: anatomy, function, and relevance to disease. Ann N Y Acad Sci 1124:1–38. - PubMed
    1. Chang C, Glover GH. 2010. Time-frequency dynamics of resting-state brain connectivity measured with fMRI. Neuroimage 50:81–98. - PMC - PubMed

Publication types

LinkOut - more resources