. 2021 Jun 22:10:e69209.
doi: 10.7554/eLife.69209.

Adipsin promotes bone marrow adiposity by priming mesenchymal stem cells

Affiliations

Adipsin promotes bone marrow adiposity by priming mesenchymal stem cells

Nicole Aaron et al. Elife. .

Abstract

Background: Marrow adipose tissue (MAT) has been shown to be vital for regulating metabolism and maintaining skeletal homeostasis in the bone marrow (BM) niche. As a reflection of BM remodeling, MAT is highly responsive to nutrient fluctuations, hormonal changes, and metabolic disturbances such as obesity and diabetes mellitus. Expansion of MAT has also been strongly associated with bone loss in mice and humans. However, the regulation of BM plasticity remains poorly understood, as does the mechanism that links changes in marrow adiposity with bone remodeling.

Methods: We studied deletion of Adipsin, and its downstream effector, C3, in C57BL/6 mice as well as the bone-protected PPARγ constitutive deacetylation 2KR mice to assess BM plasticity. The mice were challenged with thiazolidinedione treatment, calorie restriction, or aging to induce bone loss and MAT expansion. Analysis of bone mineral density and marrow adiposity was performed using a μCT scanner and by RNA analysis to assess adipocyte and osteoblast markers. For in vitro studies, primary bone marrow stromal cells were isolated and subjected to osteoblastogenic or adipogenic differentiation or chemical treatment followed by morphological and molecular analyses. Clinical data was obtained from samples of a previous clinical trial of fasting and high-calorie diet in healthy human volunteers.

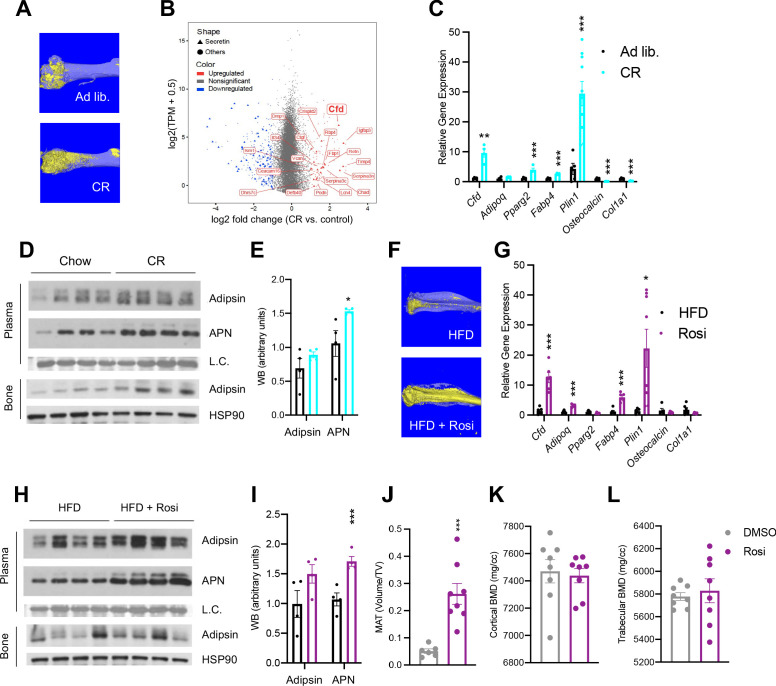
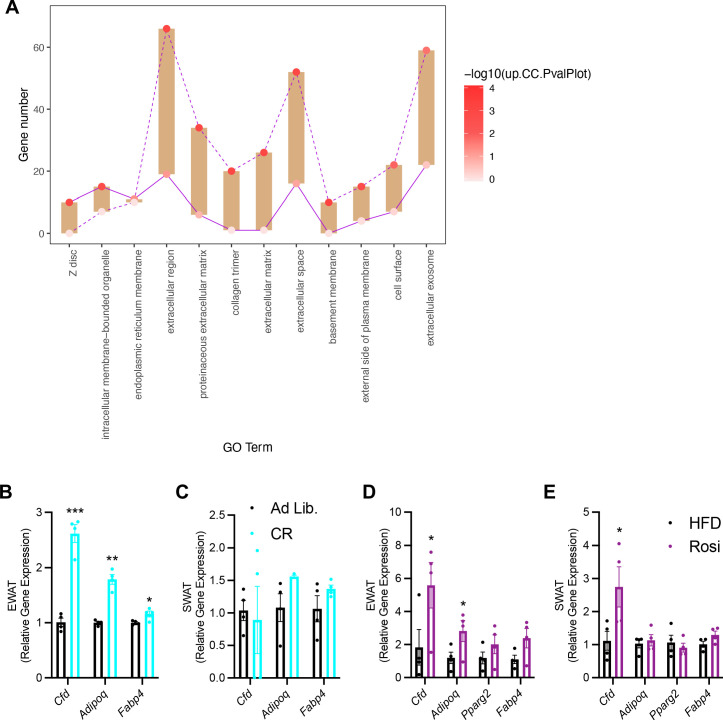
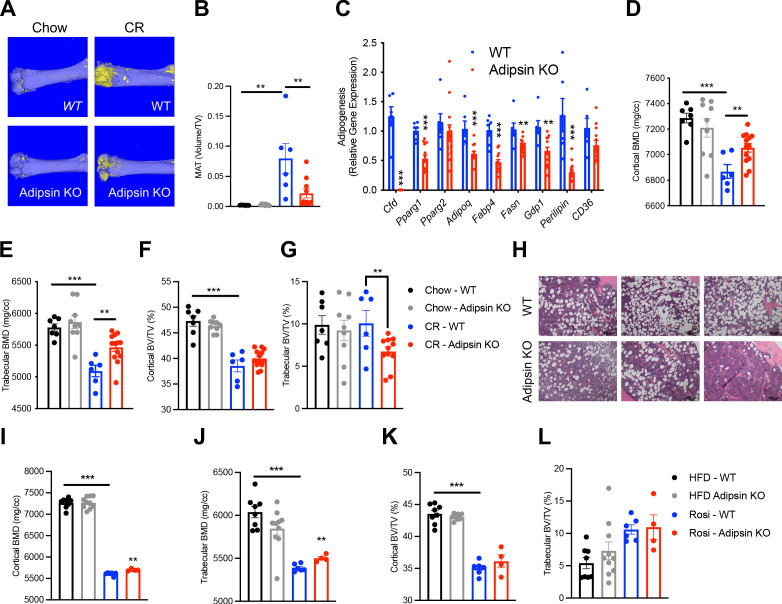
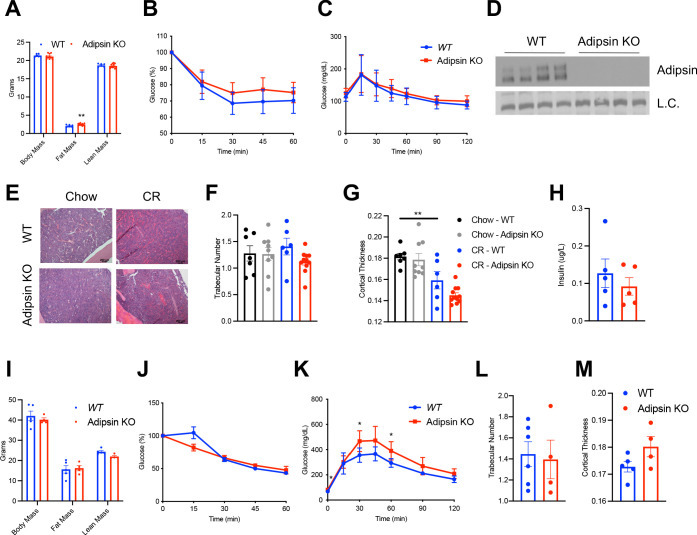
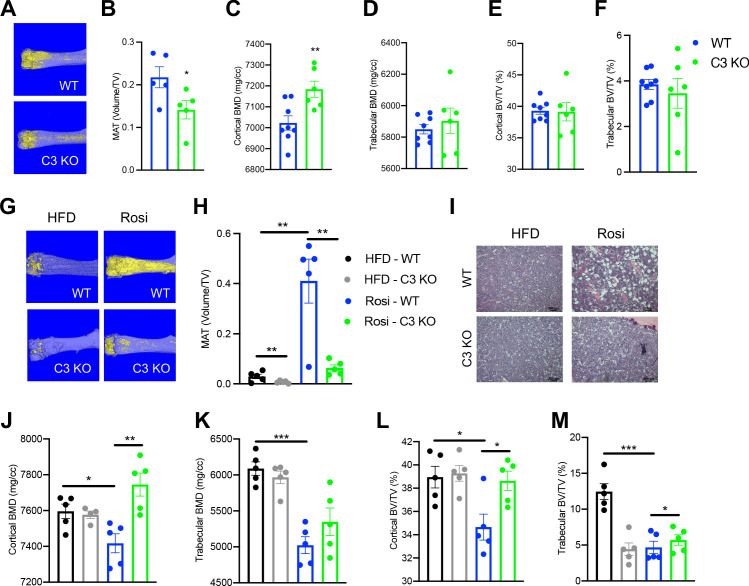
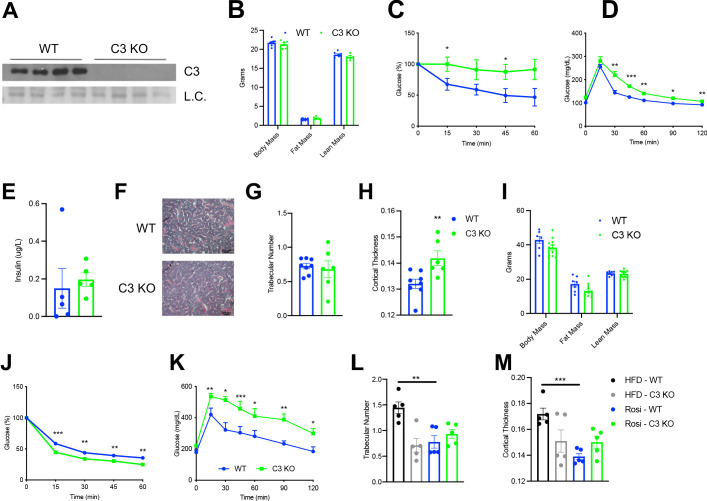
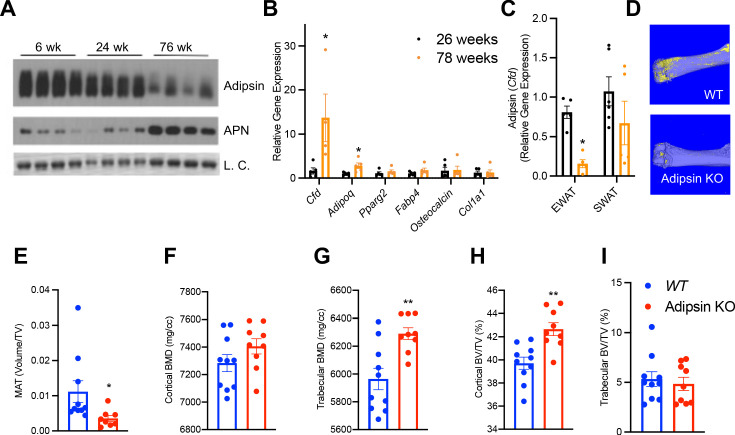
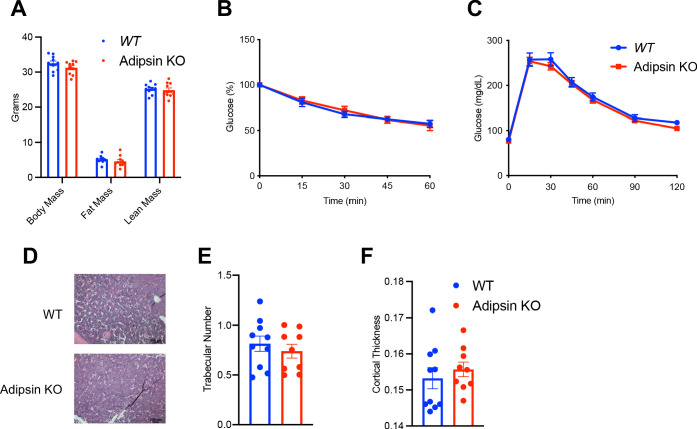
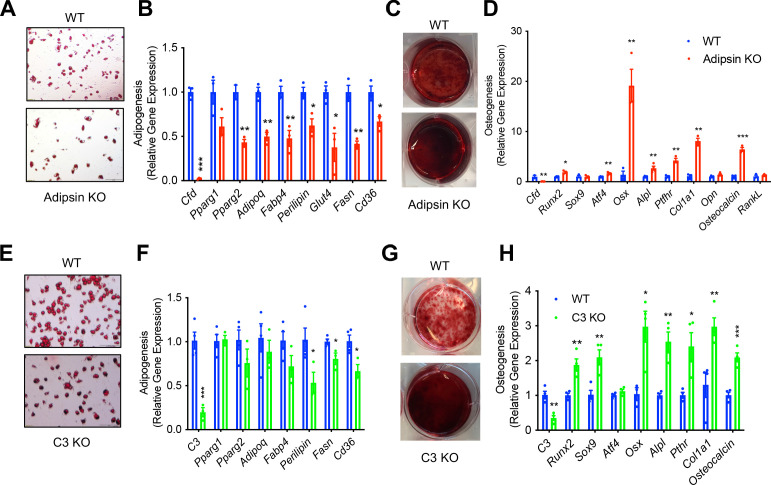
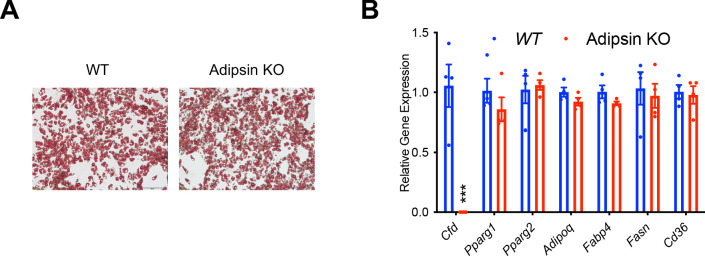
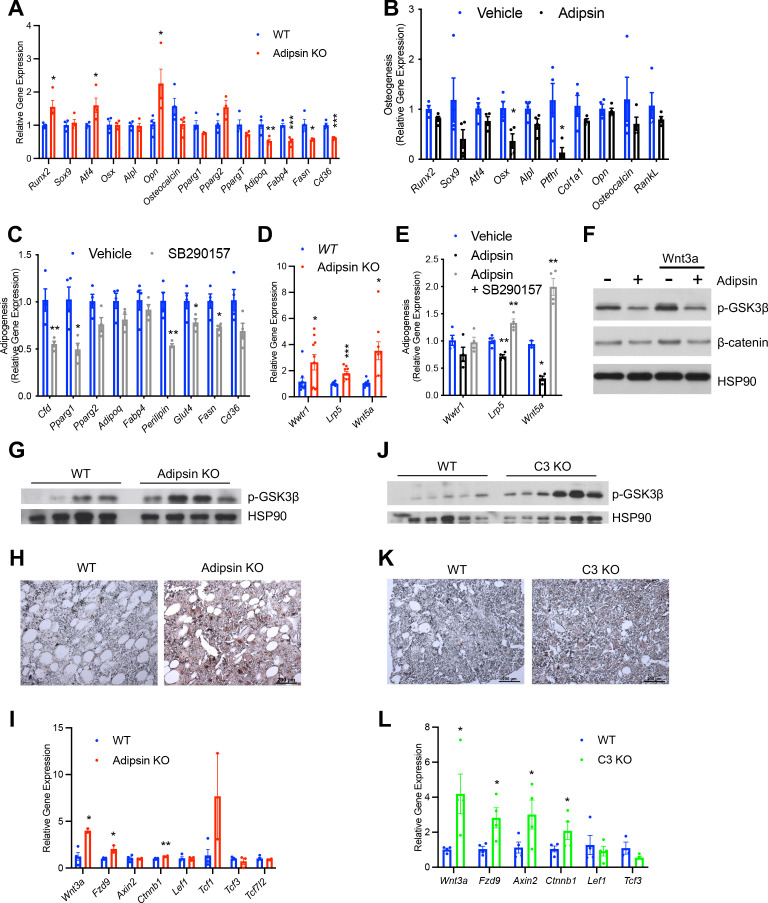
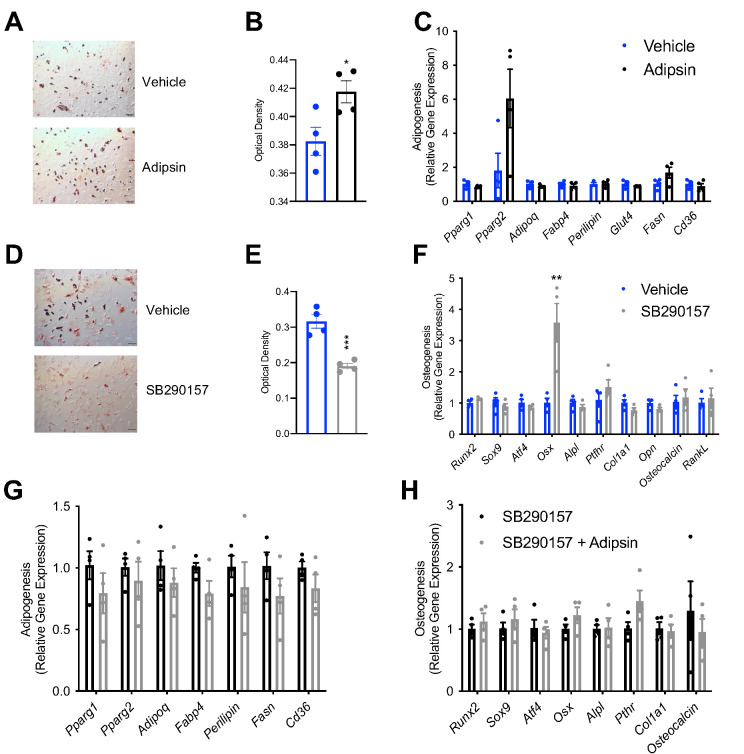
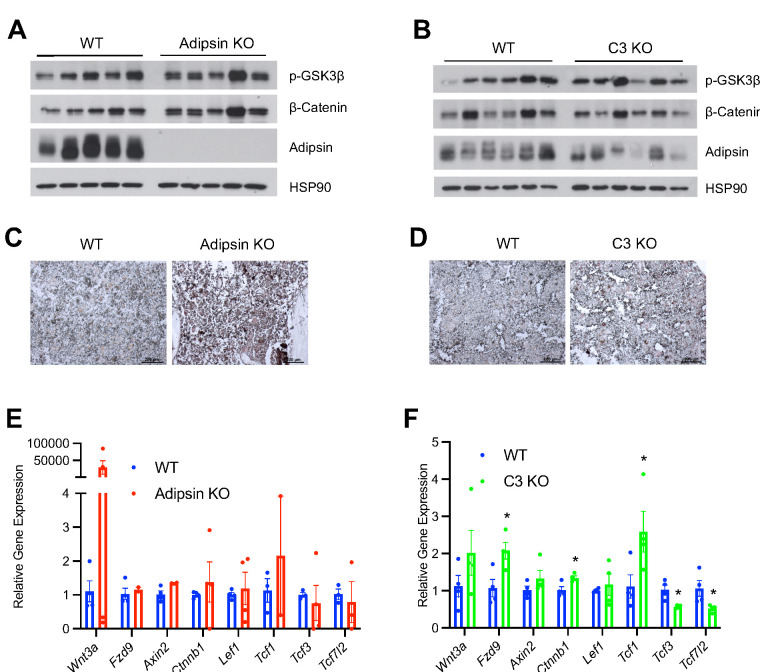
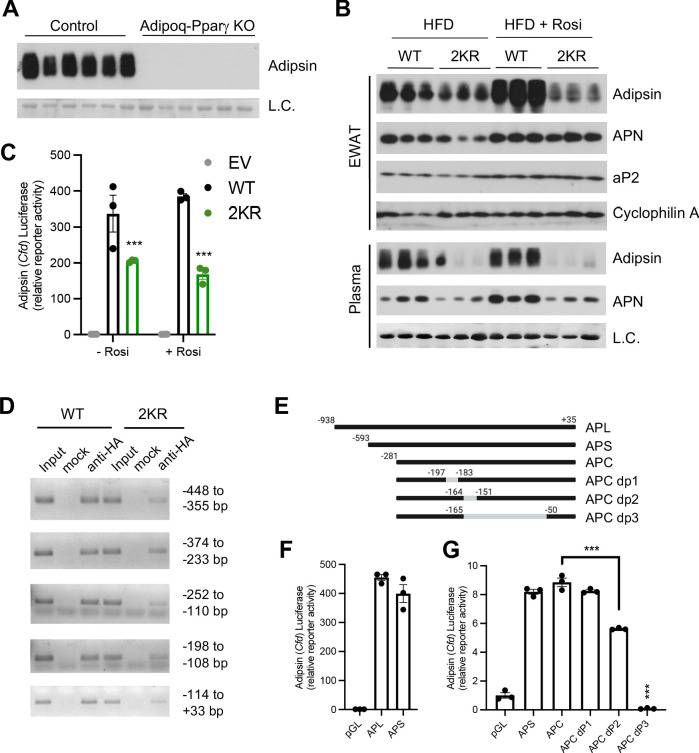
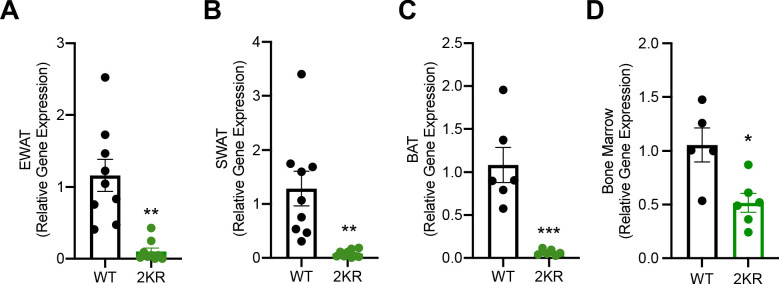
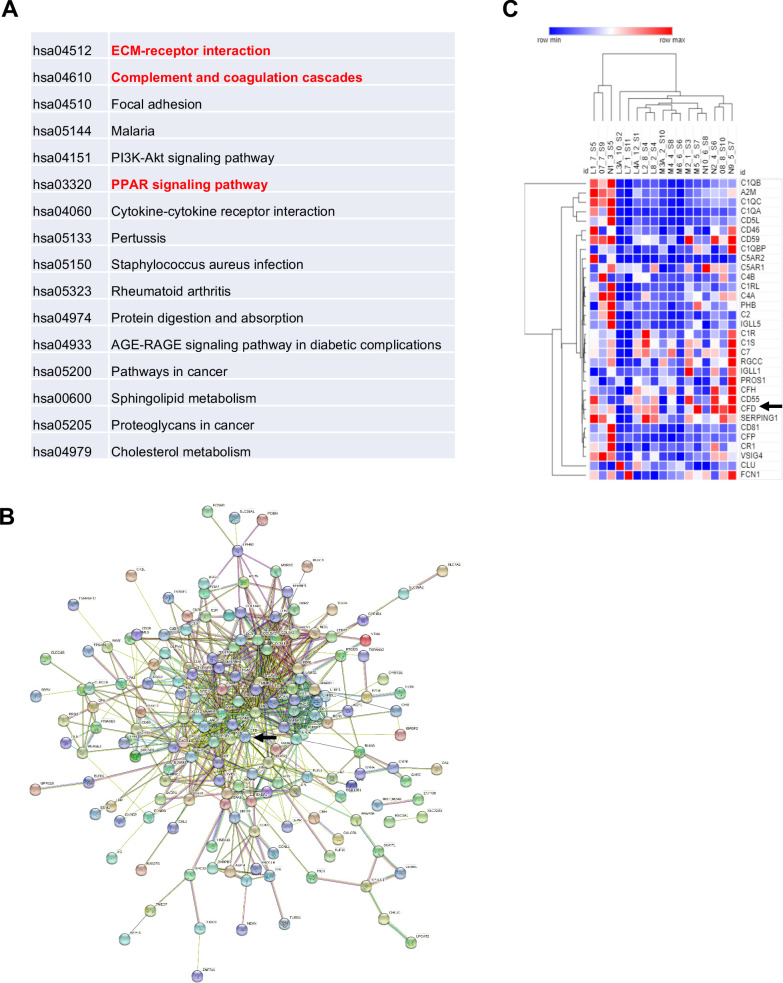
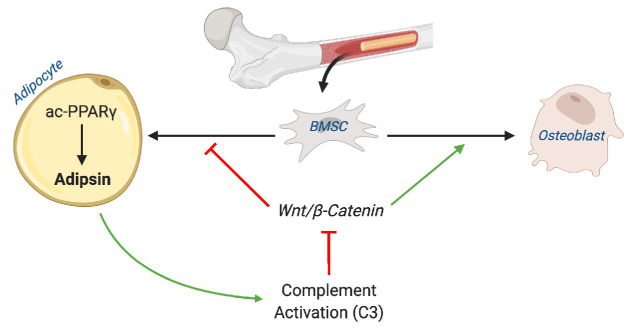
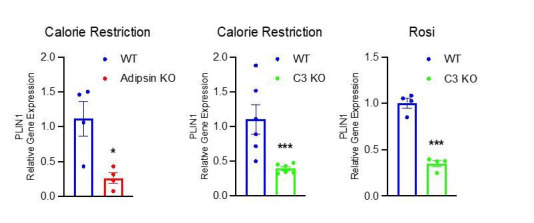
Results: We show that Adipsin is the most upregulated adipokine during MAT expansion in mice and humans in a PPARγ acetylation-dependent manner. Genetic ablation of Adipsin in mice specifically inhibited MAT expansion but not peripheral adipose depots, and improved bone mass during calorie restriction, thiazolidinedione treatment, and aging. These effects were mediated through its downstream effector, complement component C3, to prime common progenitor cells toward adipogenesis rather than osteoblastogenesis through inhibiting Wnt/β-catenin signaling.

Conclusions: Adipsin promotes new adipocyte formation and affects skeletal remodeling in the BM niche. Our study reveals a novel mechanism whereby the BM sustains its own plasticity through paracrine and endocrine actions of a unique adipokine.

Funding: This work was supported by the National Institutes of Health T32DK007328 (NA), F31DK124926 (NA), R01DK121140 (JCL), R01AR068970 (BZ), R01AR071463 (BZ), R01DK112943 (LQ), R24DK092759 (CJR), and P01HL087123 (LQ).

Keywords: PPARgamma; adipokine; adipsin; bone marrow adiposity; complement; medicine; mouse.


Conflict of interest statement

NA, MK, QZ, QL, SC, JY, LL, LY, LW, YH, LF, HH, LD, JL, WW, BZ, EG, LS, CR, LQ No competing interests declared

Figures

Figure 1.
Figure 1.. Adipsin is robustly induced in the bone marrow (BM) during bone marrow adipose tissue (BMAT) expansion.
(A) Representative osmium tetroxide staining of MAT assessed by μCT scanning in the femurs of ad libitum and calorie restriction (CR)-fed mice. (B) Scatterplot displaying the gene expression (y-axis) and fold change (x-axis) in whole bone tissue between CR and control, induced secretory genes is highlighted. (C–E) CR-induced bone loss model: 18-week-old male mice subjected to 30% CR for 4 weeks. (C) qPCR analyses of gene expression in the BM isolated from the tibia (n = 6, 6); (D) immunoblot of plasma Adipsin and Adiponectin (APN) – Coomassie staining of the membrane was used as loading control (L.C.) (n = 4, 4); and immunoblot of Adipsin from bone – HSP90 was used as the loading control (n = 4, 4); (E) quantification of plasma Adipsin and APN from western blot. (F–I) Rosiglitazone (Rosi)-induced bone loss model: adult male mice on HFD for 12 weeks followed by 6 weeks of HFD supplemented with Rosi. (F) Representative osmium tetroxide staining of MAT assessed by μCT scanning in the tibia; (G) qPCR analyses of gene expression in the BM isolated from the femurs (n = 6, 6); (H) immunoblot of plasma Adipsin and APN and bone Adipsin; (I) quantification of plasma Adipsin and APN from western blot (n = 4, 4). (J–L) Adult male mice on HFD for 8 weeks followed by daily injections of 10 mg/kg Rosi or dimethyl sulfoxide solution (DMSO) (10%) for 3 weeks with continuous HFD feeding. (J) Quantification of femoral MAT (n = 6, 8); (K, L) femoral bone mineral density (BMD) in the cortical (K) and trabecular (L) regions determined by μCT scans (n = 8, 8). *p<0.05, **p<0.01, ***p<0.001 for control group vs. treatment group. Data represent mean ± SEM. Two-tailed Student’s t-tests were used for statistical analyses.
Figure 1—figure supplement 1.
Figure 1—figure supplement 1.. The unique regulation of bone marrow (BM) Adipsin.
(A) Floating bar plot of enriched Cellular Component for upregulated or downregulated genes in the transcriptome of BM from control and calorie restriction (CR) mice. The dot color indicates the enrichment level for the Cellular Component in upregulated and downregulated genes, separately. (B, C) qPCR analyses of gene expression in the epididymal white adipose tissue (EWAT) (B) and subcutaneous white adipose tissue (SWAT) (C) of adult male mice on chow diet and after 4 weeks of 30% CR (n = 4, 4). (D, E) qPCR analyses of gene expression in the EWAT (D) and SWAT (E) of adult male mice on HFD for 12 weeks followed by 6 weeks of HFD or HFD supplemented with rosiglitazone (Rosi) (n = 4, 4). *p<0.05, **p<0.01, ***p<0.001 for control vs. treatment group. Data represent mean ± SEM. Two-tailed Student’s t-tests were used for statistical analyses.
Figure 2.
Figure 2.. Ablation of Adipsin inhibits bone marrow (BM) adipogenesis and protects bone.
(A–G) 18-week-old male mice on chow diet ad libitum or subjected to calorie restriction (CR) for 4 weeks. Chow WT (n = 7), Adipsin KO (n = 9); CR WT (n = 6), Adipsin KO (n = 10). (A) Representative osmium tetroxide staining and (B) quantification of femoral marrow adipose tissue (MAT); (C) qPCR analyses of gene expression for markers of adipocytes in the BM from the tibia of CR mice; (D, E) femoral bone mineral density (BMD) in the cortical (D) and trabecular (E) regions; (F, G) bone volume (BV) normalized by total volume (TV) in the cortical (F) and trabecular (G) regions of the femurs determined by μCT scans. (H–L) Adult male mice on HFD for 12 weeks followed by 6 weeks of HFD (n = 8, 10) or HFD supplemented with rosiglitazone (Rosi) treatment (n = 6, 4). (H) Hematoxylin and eosin stain (H&E) staining of the femoral MAT in the same region of three different mice (Rosi only); (I, J) femoral BMD in the cortical (I) and trabecular (J) regions; (K, L) BV normalized by TV in the cortical (K) and trabecular (L) regions of the femurs determined by μCT scans. *p<0.05, **p<0.01, ***p<0.001 for WT vs. Adipsin KO. Data represent mean ± SEM. Two-tailed Student’s t-tests were used for statistical analyses.
Figure 2—figure supplement 1.
Figure 2—figure supplement 1.. Mild metabolic phenotype of Adipsin KO mice during calorie restriction (CR) and rosiglitazone (Rosi) treatment.
(A–G) 18-week-old male mice subjected to 30% CR for 4 weeks. WT (n = 9), Adipsin KO (n = 11). (A) Body weight and composition assessed by EchoMRI; (B) insulin tolerance test (ITT) at 3 weeks of CR; (C) GTT at 4 weeks of CR; (D) immunoblot of plasma Adipsin to validate model (L.C. = Coomassie); (E) hematoxylin and eosin (H&E) staining of the femoral marrow adipose tissue (MAT) in chow-fed and CR mice; (F, G) trabecular number (F) and cortical thickness (G) of femurs determined by μCT scans. Chow WT (n = 7), Adipsin KO (n = 9); CR WT (n = 6), Adipsin KO (n = 10). (H) Insulin measured by ELISA from the plasma of CR mice (n = 5, 5). (I–M) Adult male mice on HFD for 12 weeks followed by 6 weeks of HFD supplemented with Rosi. WT (n = 6), Adipsin KO (n = 4). (I) Body weight and composition assessed by EchoMRI; (J) ITT at 4 weeks of Rosi; (K) GTT at 5 weeks of Rosi; (L, M) trabecular number (L) and cortical thickness (M) of femurs determined by μCT scans. *p<0.05, **p<0.01 for WT vs. Adipsin KO. Data represent mean ± SEM. Two-tailed Student’s t-tests were used for statistical analyses.
Figure 3.
Figure 3.. Ablation of C3 recapitulates the bone marrow phenotype of Adipsin KO mice.
(A–F) 18-week-old male mice subjected to 30% calorie restriction for 4 weeks. WT (n = 8), C3 KO (n = 6). (A) Representative osmium tetroxide staining and (B) quantification of femoral marrow adipose tissue (MAT) (n = 5, 5); (C, D) femoral bone mineral density (BMD) in the cortical (C) and trabecular (D) regions; (E, F) bone volume (BV) normalized by total volume (TV) in the cortical (E) and trabecular (F) regions of the femurs determined by μCT scans. (G–M) Adult male mice on HFD for 12 weeks followed by 8 weeks of HFD or HFD supplemented with rosiglitazone (Rosi) treatment (n = 5/group). (G) Representative osmium tetroxide staining and (H) quantification of femoral MAT; (I) hematoxylin and eosin (H&E) staining of femoral MAT; (J, K) femoral BMD in the cortical (J) and trabecular (K) regions; (L, M) BV normalized by TV in the cortical (L) and trabecular (M) regions of the femurs determined by μCT scans. *p<0.05, **p<0.01 for WT vs. C3 KO. Data represent mean ± SEM. Two-tailed Student’s t-tests were used for statistical analyses.
Figure 3—figure supplement 1.
Figure 3—figure supplement 1.. Metabolic phenotype of C3 KO mice during calorie restriction (CR) and rosiglitazone (Rosi) treatment.
(A–G) 18-week-old male mice subjected to 30% CR for 4 weeks. WT (n = 8), C3 KO (n = 6). (A) Immunoblot of plasma C3 to validate model (L.C. = Coomassie). (B) Body weight and composition assessed by EchoMRI; (C) insulin tolerance test (ITT) at 3 weeks of CR; (D) GTT at 4 weeks of CR; (E) insulin measured by ELISA from the plasma of CR mice (n = 5, 5). (F) Hematoxylin and eosin (H&E) staining of the femoral MAT; (G, H) average trabecular number (G) and cortical thickness (H) of femurs determined by μCT scans. (I–M) Adult male mice on HFD for 12 weeks followed by 8 weeks of HFD supplemented with Rosi (n = 5/group). (I) Body weight and composition assessed by EchoMRI; (J) ITT at 6 weeks of Rosi; (K) GTT at 7 weeks of Rosi; (L, M) average trabecular number (L) and cortical thickness (M) of femurs determined by μCT scans. *p<0.05, **p<0.01, ***p<0.001 for WT vs. C3 KO. Data represent mean ± SEM. Two-tailed Student’s t-tests were used for statistical analyses.
Figure 4.
Figure 4.. Bone marrow (BM) Adipsin induces bone marrow adiposity expansion during aging.
(A) Immunoblot of Adipsin and Adiponectin from plasma of chow-fed male mice at 6, 24, and 76 weeks of age (L.C. = Coomassie staining of the membrane). (B, C) qPCR analyses of gene expression in the BM from tibia (B) and Cfd expression in the epididymal white adipose tissue and subcutaneous white adipose tissue (C) from chow-fed male mice at 26 and 78 weeks of age (n = 5, 5). *p<0.05 for young vs. aging mice. (D–I) Chow-fed 1-year-old male mice. WT (n = 10) and Adipsin KO (n = 9). (D) Representative osmium tetroxide staining and (E) quantification of femoral MAT; (F, G) femoral bone mineral density (BMD) in the cortical (F) and trabecular (G) regions, and (H, I) bone volume normalized by total voume in the cortical (H) and trabecular (I) regions of the femur determined by μCT scans. **p<0.01 for WT vs. Adipsin KO mice. Data represent mean ± SEM. Two-tailed Student’s t-tests were used for statistical analyses.
Figure 4—figure supplement 1.
Figure 4—figure supplement 1.. Metabolic phenotyping of Adipsin KO mice during aging.
Chow-fed 1-year-old male mice. WT (n = 10) and Adipsin KO (n = 9). (A) Body weight and composition assessed by EchoMRI; (B) insulin tolerance test; (C) GTT; (D) hematoxylin and eosin staining of femoral marrow adipose tissue. (E, F) Average trabecular number (E) and cortical thickness (F) of femurs determined by μCT scans. Data represent mean ± SEM. Two-tailed Student’s t-test was used for statistical analyses.
Figure 5.
Figure 5.. Adipsin influences the fate of bone marrow stromal cell (BMSC) differentiation.
(A, B) Adipogenesis of WT and Adipsin KO BMSCs. (A) Oil Red O staining of lipid droplets after 2 weeks of differentiation; (B) qPCR analysis of adipogenic genes (n = 4, 4). (C, D) Osteoblastogenesis of WT and Adipsin KO BMSCs. (C) Alizarin Red staining of calcium after 21 days of differentiation; (D) qPCR analysis of osteoblastogenic genes (n = 4, 4). (E, F) Adipogenesis of WT and C3 KO BMSCs. (E) Oil Red O staining of lipid droplets after 2 weeks of differentiation; (F) qPCR analysis of adipogenic genes (n = 4, 4). (G, H) Osteoblastogenesis of WT and C3 KO BMSCs. (G) Alizarin Red staining of calcium after 21 days of differentiation; (H) qPCR analysis of osteoblastogenic genes (n = 4, 4). *p<0.05, **p<0.01, ***p<0.001 for WT vs. mutant cells. Data represent mean ± SEM. Two-tailed Student’s t-tests were used for statistical analyses.
Figure 5—figure supplement 1.
Figure 5—figure supplement 1.. Absence of an effect of Adipsin in subcutaneous white adipose tissue (SWAT)-derived adipose stromal cells.
(A, B) Adipose stromal cells isolated from the SWAT of WT or Adipsin KO mice were differentiated into adipocytes (n = 4/group). (A) Oil Red O staining of lipid droplets after differentiation. (B) qPCR analysis of adipocyte genes. ***p<0.001 for WT vs. Adipsin KO cells. Data represent mean ± SEM. Two-tailed Student’s t-tests were used for statistical analyses.
Figure 6.
Figure 6.. Adipsin primes bone marrow stromal cells (BMSCs) toward adipogenesis through inhibition of Wnt signaling.
(A) qPCR analysis of adipogenic and osteoblastogenic genes in BMSCs isolated from WT and Adipsin KO mice prior to differentiation following 48 hr of dexamethasone (1 μM) treatment. *p<0.05, **p<0.01, ***p<0.001 for WT vs. Adipsin KO BMSCs (n = 4, 4). (B) qPCR analysis of osteoblastogenic markers in Adipsin KO BMSCs differentiated into osteoblasts with or without recombinant mouse Adipsin (1 μg/mL) treatment. *p<0.05 for vehicle vs. Adipsin (n = 4, 4). (C) qPCR analysis of adipogenic markers in WT BMSCs differentiated into adipocytes with or without C3aR antagonist SB290157 (1 μM) treatment. *p<0.05, **p<0.01 for vehicle vs. SB290157 (n = 4, 4). (D) qPCR analysis of genes associated with Wnt pathway activation in undifferentiated BMSCs isolated from WT and Adipsin KO mice. *p<0.05, ***p<0.001 for WT vs. Adipsin KO BMSCs (n = 4, 4). (E) qPCR analysis of genes associated with Wnt pathway activation in Adipsin KO BMSCs treated with recombinant Adipsin (1 μg/mL) or SB290157 (1 μM). *p<0.05, **p<0.01, ***p<0.001 for vehicle vs. treatment (n = 4/group). (F) Immunoblot of phospho-GSK3β and β-catenin from C3H10T1/2 cells treated with Adipsin (1 μg/mL) and Wnt3a (20 ng/mL) (L.C. = HSP90). (G–I) Immunoblot of phospho-GSK3β (L.C. = HSP90) (G), immunohistochemical staining of β-catenin (H), and qPCR analysis of Wnt signaling markers (I) in the femurs of WT and Adipsin KO mice on rosiglitazone (Rosi) diet (n = 4, 4, bones lost due to harvesting and processing). (J–L) Immunoblot of phospho-GSK3β (L.C. = HSP90) (J), immunohistochemical staining of β-catenin (K), and qPCR analysis of Wnt signaling markers (L) in the femurs of WT and C3 KO mice on Rosi diet (n = 4, 4, bones lost due to harvesting and processing). *p<0.05, **p<0.01 for WT vs. mutant. Data represent mean ± SEM. Two-tailed Student’s t-tests were used for statistical analyses.
Figure 6—figure supplement 1.
Figure 6—figure supplement 1.. Adipsin modulates bone marrow stromal cell (BMSC) differentiation and Wnt signaling in vitro.
(A–C) Adipsin KO BMSCs were differentiated into adipocytes for 7 days with or without recombinant mouse Adipsin (1 μg/mL). (A, B) Oil Red O staining (A) and quantification (B) of neutral lipid content; (C) qPCR analysis of adipogenic gene expression (n = 4, 4). (D, E) WT BMSCs were differentiated into adipocytes for 7 days with or without C3aR inhibitor SB290157 (1 μM) treatment. Oil Red O staining (D) and quantification (E) of neutral lipid content (n = 4, 4). (F) qPCR analysis of osteoblastogenic gene expression of WT BMSCs differentiated into osteoblasts for 7 days with or without C3aR inhibitor SB290157 (1 μM) (n = 4, 4). *p<0.05, **p<0.01, ***p<0.001 for vehicle vs. treatment group. (G, H) WT BMSCs were differentiated into adipocytes (G) or osteoblasts (H) for 7 days with C3aR inhibitor SB290157 (1 μM) treatment with or without recombinant mouse Adipsin (1 μg/mL) (n = 4/group). qPCR analyses of adipogenic gene expression and osteoblastogenic gene expression. Data represent mean ± SEM. Two-tailed Student’s t-tests were used for statistical analyses.
Figure 6—figure supplement 2.
Figure 6—figure supplement 2.. Adipsin modulates bone marrow stromal cell (BMSC) differentiation and Wnt signaling in vitro.
(A, B) Immunoblotting of EWAT in Adipsin KO (A) and C3 KO mice (B) on rosiglitazone (Rosi) treatment. (C, D) Immunohistochemical staining of β-catenin in the femurs of Adipsin KO (C) and C3 KO mice (D) on calorie restriction (CR). (E, F) qPCR analysis of Wnt signaling markers in the femurs of Adipsin KO (E) and C3 KO mice (F) on CR (n = 4, 4, loss of bone during harvesting and processing). *p<0.05 for WT vs. mutant. Data represent mean ± SEM. Two-tailed Student’s t-tests were used for statistical analyses.
Figure 7.
Figure 7.. Adipsin is a downstream target of PPARγ deacetylation.
(A) Immunoblot of Adipsin in the plasma from adult male adipocyte conditional PPARγ KO (Adipoq-Pparγ KO) and control mice on HFD for 12 weeks (L.C. = Coomassie staining of the membrane). (B) Adult male WT and 2KR mice on HFD for 12 weeks followed by 8 weeks of HFD or HFD supplemented with rosiglitazone (Rosi). Immunoblots of Adipsin, Adiponectin (APN), and aP2 from epididymal white adipose tissue (EWAT) (loading control = cyclophilin A) and Adipsin and APN from plasma (L.C. = Coomassie stain of the membrane). (C) Adipsin promoter-driven luciferase reporter assay from HEK293T cells transfected with WT or 2KR overexpression of PPARγ with or without Rosi treatment (n = 3/group). (D) ChIP assay for PPARγ binding to the Adipsin promoter. Pparg-/- mouse embryonic fibroblasts (MEFs) were reconstituted with Flag-HA-tagged WT or 2KR PPARγ2 and adipogenesis was induced. Anti-HA ChIP assay was performed on day 7 of differentiation. (E) Scheme of Adipsin promoter designs: long Adipsin promoter (APL), short Adipsin promoter (APS), Adipsin promoter core (APC), delete −197 to −183 (dP1), delete −164 to −151 (dP2), delete −165 to −50 (dP3). (F, G) Adipsin promoter-driven luciferase reporter assay in HEK293T cells with various deletions in the Adipsin promoter region. ***p<0.001 for WT vs. 2KR. Data represent mean ± SEM. Two-tailed Student’s t-tests were used for statistical analyses.
Figure 7—figure supplement 1.
Figure 7—figure supplement 1.. PPARγ deacetylation represses Adipsin expression in peripheral adipose tissues.
(A–C) Adult male WT and 2KR mice on HFD for 12 weeks followed by 8 weeks of HFD supplemented with rosiglitazone (Rosi). qPCR analyses of Cfd expression in epididymal white adipose tissue (EWAT) (n = 9, 9) (A), subcutaneous white adipose tissue (SWAT) (n = 9, 9) (B), brown adipose tissue (BAT) (n = 6, 6) (C). (D) qPCR analysis of Cfd expression in the bond marrow (BM) of ad libitum-fed adult male WT and 2KR mice (n = 5, 6). *p<0.05, **p<0.01, ***p<0.001 for WT vs. 2KR. Data represent mean ± SEM. Two-tailed Student’s t-tests were used for statistical analyses.
Figure 8.
Figure 8.. Adipsin is induced in human bone marrow adipose tissue during fasting.
Five subjects (three females and two males) had qualified RNA from paired bone marrow adipocyte samples for RNA-seq. Analysis was performed by STRING and protein-coding genes were assessed with p-value<0.05, false discovery rate < 0.05. (A) Enriched pathways of selected genes; (B) STRING map, with Complement Factor D (CFD) (Adipsin) indicated by arrow; (C) heat map of the complement pathway. Five individuals are denoted by letters L–N and their respective number for pre- and post-sample time. Arrows represent CFD (Adipsin).
Figure 9.
Figure 9.. Schematic model.
Adipsin from bone marrow adipocytes regulates bone marrow stromal cell fate determination through its activation of the complement system (C3) and, ultimately, downstream inhibition of the canonical Wnt signaling cascade through β-catenin. Furthermore, Adipsin transcription is determined by the acetylation post-translational modification of PPARγ.
Author response image 1.

References

    1. Abbas A, Blandon J, Rude J, Elfar A, Mukherjee D. PPAR- γ agonist in treatment of diabetes: cardiovascular safety considerations. Cardiovascular & Hematological Agents in Medicinal Chemistry. 2012;10:124–134. doi: 10.2174/187152512800388948. - DOI - PubMed
    1. Azizieh FY, Shehab D, Al Jarallah K, Mojiminiyi O, Gupta R, Raghupathy R. Circulatory pattern of cytokines, adipokines and bone markers in postmenopausal women with low BMD. Journal of Inflammation Research. 2019;12:99–108. doi: 10.2147/JIR.S203590. - DOI - PMC - PubMed
    1. Bateman A, UniProt Consortium UniProt: a worldwide hub of protein knowledge. Nucleic Acids Research. 2019;47:D506–D515. doi: 10.1093/nar/gky1049. - DOI - PMC - PubMed
    1. Bloom AC, Collins FL, Van't Hof RJ, Ryan ES, Jones E, Hughes TR, Morgan BP, Erlandsson M, Bokarewa M, Aeschlimann D, Evans BAJ, Williams AS. Deletion of the membrane complement inhibitor CD59a drives age and gender-dependent alterations to bone phenotype in mice. Bone. 2016;84:253–261. doi: 10.1016/j.bone.2015.12.014. - DOI - PMC - PubMed
    1. Botolin S, McCabe LR. Bone loss and increased bone adiposity in spontaneous and pharmacologically induced diabetic mice. Endocrinology. 2007;148:198–205. doi: 10.1210/en.2006-1006. - DOI - PubMed

Publication types

Associated data