. 2021 Jul 6;93(26):9258-9266.
doi: 10.1021/acs.analchem.1c01616. Epub 2021 Jun 22.

Acoustic Mist Ionization Mass Spectrometry for Ultrahigh-Throughput Metabolomics Screening

Affiliations

Acoustic Mist Ionization Mass Spectrometry for Ultrahigh-Throughput Metabolomics Screening

Matthew J Smith et al. Anal Chem. .

Abstract

Incorporating safety data early in the drug discovery pipeline is key to reducing costly lead candidate failures. For a single drug development project, we estimate that several thousand samples per day require screening (<10 s per acquisition). While chromatography-based metabolomics has proven value at predicting toxicity from metabolic biomarker profiles, it lacks sufficiently high sample throughput. Acoustic mist ionization mass spectrometry (AMI-MS) is an atmospheric pressure ionization approach that can measure metabolites directly from 384-well plates with unparalleled speed. We sought to implement a signal processing and data analysis workflow to produce high-quality AMI-MS metabolomics data and to demonstrate its application to drug safety screening. An existing direct infusion mass spectrometry workflow was adapted, extended, optimized, and tested, utilizing three AMI-MS data sets acquired from technical and biological replicates of metabolite standards and HepG2 cell lysates and a toxicity study. Driven by criteria to minimize variance and maximize feature counts, an algorithm to extract the pulsed scan data was designed; parameters for signal-to-noise-ratio, replicate filter, sample filter, missing value filter, and RSD filter were all optimized; normalization and batch correction strategies were adapted; and cell phenotype filtering was implemented to exclude high cytotoxicity samples. The workflow was demonstrated using a highly replicated HepG2 toxicity data set, comprising 2772 samples from exposures to 16 drugs across 9 concentrations and generated in under 5 h, revealing metabolic phenotypes and individual metabolite changes that characterize specific modes of action. This AMI-MS workflow opens the door to ultrahigh-throughput metabolomics screening, increasing the rate of sample analysis by approximately 2 orders of magnitude.


Conflict of interest statement

The authors declare no competing financial interest.

Figures

Figure 1
Figure 1
Data-processing workflow from raw AMI–MS and cell imaging data to single metabolite and profile analyses. The “ML” (MassLynx) MSconvert and “AMIMSpy” labels pertain to the required software for these processing steps.
Figure 2
Figure 2
(a) Total ion current versus scan number showing “on-” (green) and “off-” (red) scans for AMI–MS metabolomics data acquisition of a representative HepG2 extract; (b) distribution of the percentage detectability of standards in scans across each sample, and the RSD of the intensities of the standards, comparing “all-scans” (blue), “on-scans” (yellow), and “on-scans-no-edge” (green) methods for extracting scan data from AMI–MS analysis of the standard sample set.
Figure 3
Figure 3
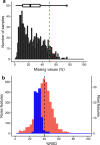
(a) Distribution of missing values in all samples from AMI–MS analysis of the biological control sample data set; (b) overlaid distributions of noise (red) and real features (blue) from AMI–MS analysis of the technical replicate data set. Note that y-axes are on different scales, and in both plots, the vertical lines indicate our optimized parameter for noise filtering.
Figure 4
Figure 4
Scatter plot showing the intensity changes in the citrate internal standard from AMI–MS analysis across eight plates of the biological technical replicate data (a) before and (b) after batch correction, respectively, where each plate is colored differently. PCA score plot from AMI–MS metabolomics analysis of the DMSO-control (red) and death-control (blue) samples in the HepG2 toxicity study (c) before and (d) after batch correction. The batch correction algorithm reduces unwanted intensity variations and improves the separation between positive and negative control samples.
Figure 5
Figure 5
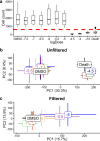
(a) Box plot representation of the cell count at each tamoxifen concentration from the cell imaging data, the red line indicates the cell phenotype filter threshold applied. PCA score plots from AMI–MS metabolomics analysis of the HepG2 toxicity study highlighting the metabolic responses to tamoxifen (b) before and (c) after cell phenotype filtering, respectively. The cell phenotype filter enables the more subtle concentration response associated with low tamoxifen exposure levels to be visualized.
Figure 6
Figure 6
AMI–MS metabolomics analysis of the HepG2 toxicity study samples: (a) UMAP analysis of the highest noncytotoxic concentration of each of the 16 drugs, showing a clustering based on metabolic perturbations. Concentration–response relationships of key metabolite features (m/z) following exposure to (b) tamoxifen and (c) deferoxamine, respectively. Dashed lines are derived from smoothing functions, not dose–response models. Gray region in plot (b) indicates cytotoxic concentrations.

References

    1. Morgan P.; Brown D. G.; Lennard S.; Anderton M. J.; Barrett J. C.; Eriksson U.; Fidock M.; Hamrén B.; Johnson A.; March R. E.; Matcham J.; Mettetal J.; Nicholls D. J.; Platz S.; Rees S.; Snowden M. A.; Pangalos M. N. Impact of a Five-Dimensional Framework on R&D Productivity at AstraZeneca. Nat. Rev. Drug Discovery 2018, 17, 167–181. 10.1038/nrd.2017.244. - DOI - PubMed
    1. Booth B.; Zemmel R. Prospects for Productivity. Nat. Rev. Drug Discovery 2004, 3, 451–456. 10.1038/nrd1384. - DOI - PubMed
    1. Sinclair I.; Stearns R.; Pringle S.; Wingfield J.; Datwani S.; Hall E.; Ghislain L.; Majlof L.; Bachman M. Novel Acoustic Loading of a Mass Spectrometer. J. Lab. Autom. 2016, 21, 19–26. 10.1177/2211068215619124. - DOI - PubMed
    1. Sinclair I.; Bachman M.; Addison D.; Rohman M.; Murray D. C.; Davies G.; Mouchet E.; Tonge M. E.; Stearns R. G.; Ghislain L.; Datwani S. S.; Majlof L.; Hall E.; Jones G. R.; Hoyes E.; Olechno J.; Ellson R. N.; Barran P. E.; Pringle S. D. Acoustic Mist Ionization Platform for Direct and Contactless Ultrahigh-Throughput Mass Spectrometry Analysis of Liquid Samples. Anal. Chem. 2019, 91, 3790–3794. 10.1021/acs.analchem.9b00142. - DOI - PubMed
    1. Bowes J.; Brown A. J.; Hamon J.; Jarolimek W.; Sridhar A.; Waldron G.; Whitebread S. Reducing Safety-Related Drug Attrition: The Use of in Vitro Pharmacological Profiling. Nat. Rev. Drug Discovery 2012, 11, 909–922. 10.1038/nrd3845. - DOI - PubMed

Publication types