. 2021 Aug 9;6(15):e149950.
doi: 10.1172/jci.insight.149950.

Distinct populations of antigen-specific tissue-resident CD8+ T cells in human cervix mucosa

Affiliations

Distinct populations of antigen-specific tissue-resident CD8+ T cells in human cervix mucosa

Tao Peng et al. JCI Insight. .

Abstract

The ectocervix is part of the lower female reproductive tract (FRT), which is susceptible to sexually transmitted infections (STIs). Comprehensive knowledge of the phenotypes and T cell receptor (TCR) repertoire of tissue-resident memory T cells (TRMs) in the human FRT is lacking. We took single-cell RNA-Seq approaches to simultaneously define gene expression and TCR clonotypes of the human ectocervix. There were significantly more CD8+ than CD4+ T cells. Unsupervised clustering and trajectory analysis identified distinct populations of CD8+ T cells with IFNGhiGZMBloCD69hiCD103lo or IFNGloGZMBhiCD69medCD103hi phenotypes. Little overlap was seen between their TCR repertoires. Immunofluorescence staining showed that CD103+CD8+ TRMs were preferentially localized in the epithelium, whereas CD69+CD8+ TRMs were distributed evenly in the epithelium and stroma. Ex vivo assays indicated that up to 14% of cervical CD8+ TRM clonotypes were HSV-2 reactive in HSV-2-seropositive persons, reflecting physiologically relevant localization. Our studies identified subgroups of CD8+ TRMs in the human ectocervix that exhibited distinct expression of antiviral defense and tissue residency markers, anatomic locations, and TCR repertoires that target anatomically relevant viral antigens. Optimization of the location, number, and function of FRT TRMs is an important approach for improving host defenses to STIs.

Keywords: Adaptive immunity; Immunology; T cells; Virology.


Conflict of interest statement

Conflict of interest: The authors have declared that no conflict of interest exists.

Figures

Figure 1
Figure 1. Plating whole single-cell suspension for 1 hour before single-cell RNA-Seq library construction significantly removed fibroblast cells and enriched CD8+ and CD4+ T cells in the human cervix.
CD8A and CD4 are markers for CD8+ and CD4+ T cells and SFRP2 is a marker for fibroblast cells. CD3D is a marker for both CD8+ and CD4+ T cells. Comparisons of CD8A, CD4, CD3D, and SFRP2 gene expression in UMAP between C1 (whole suspension) and C2 (whole suspension with 1-hour plating to deplete adherent cells), and between C3 (CD8 negative selection) and C4 (CD8 negative selection with 1-hour plating), are marked by line segments with arrows at both ends.
Figure 2
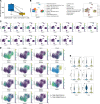
Figure 2. Two subsets of CD8+ TRMs with differential expression of tissue residency markers and cytolytic and noncytolytic genes in the human cervix.
Eight cervix samples from 6 participants described in Table 1 were used in the analysis. (A) More CD8+ than CD4+ T cells in the human cervix. P = 0.003 (paired t test, n = 8). (B) Unsupervised clustering analysis of single-cell gene expression data from the 8 cervical samples identified 17 clusters of cells (left). Contribution of the 8 cervical samples to individual clusters of cells (right). (C) UMAP to display gene expression of CD8A, CD4, CD3D, IFNG, GZMB, FOXP3, CD79A, HLA-DRA, SFRP2, KRT5, PECAM1, PROX1, TAGLN, and HBB in individual clusters of cells. CD8A, CD4, CD3D, IFNG, GZMB mark T cells and their cytolytic and noncytolytic gene expression; FOXP3, CD79A, HLA-DRA, SFRP2, KRT5, PECAM1, PROX1, TAGLN, and HBB mark Tregs, B cells, macrophages/monocytes/DCs, fibroblast cells, epithelial cells, vascular endothelial cells, lymphatic endothelial cells, vascular smooth muscle cells, and erythrocytes, respectively. (D) UMAP to display gene expression of CD8A, GZMB, GNLY, ITGAE, ITGA1, IL7R, ZNF683, IFNG, TNF, CCL3, CCL4, CD69, ITGB2, and EOMES. Except CD8A, all the other genes were significantly differentially expressed between the 2 clusters of CD8+ TRM (P < 10–10). The IFNG/CD69hi cluster of cells was labeled as TRM IFNG/CD69hi and the GZMB/ITGAEhi cluster of cells was labeled as TRM GZMB/ITGAEhi. (E) Expression of ITGAE and ITGB7 (CD103), ITGA1 and ITGB1 (CD49a), and ITGAL and ITGB2 (LFA-1) in TRM IFNG/CD69hi and TRM GZMB/ITGAEhi. *Three genes (ITGAE, ITGA1, and ITGB2) were significantly differentially expressed between the 2 subsets of CD8+ TRMs.
Figure 3
Figure 3. Trajectory analysis of purified CD8+ T cells in the human cervix.
(A) Clustering analysis of single cells. Top panel: expression of CD8A in different clusters; clusters 1 and 7 are marked and labeled as TRM GZMB/ITGAEhi and TRM IFNG/CD69hi, respectively. Bottom panel: heatmap to show gene expression of functional categories (CD8, cytolytic, noncytolytic, TRM marker, survival, and TRM transcription factor) in different clusters. (B) Trajectory analysis of single cells. Top panel: gene expression of individual cells in partition. Genes for IFNG, TNF, CD69, GZMB, PRF1, ITAGE, CCR7, S1PR1, and CD8A are shown. Bottom panel: trajectory analysis in pseudo time. Two trajectory curves were generated with 2 root nodes marked in partitions 1 and 2. The results shown in A and B were generated from CD8+ T cells, which were negatively selected from the cervical sample C4.
Figure 4
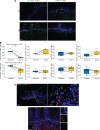
Figure 4. Distinct anatomic location of CD103+GZMB+CD8A+ and CD69+IFNG+CD8A+ T cells in the human cervix.
(A) Double immunofluorescence staining of cervix biopsies (C5 and C9) with CD8A and CD103 antibodies or CD8A and CD69 antibodies. (B) Quantitation of CD103+CD8A+ and CD69+CD8A+ cells and density of CD8A+ cells in epithelium and stroma from individual cervix biopsies (top row, n = 5, C1, C5, C7.2, C8.1, and C8.2 from HSV-2–seropositive participants; bottom row: n = 6, C9 to C15 from HSV-2–seronegative participants). (C) CD103+GZMB+ cells in epithelium and CD69+IFNG+ cells in stroma of cervix biopsies (n = 3). Top panels: RNA FISH for GZMB and immunofluorescence staining for CD103; bottom panels: RNA FISH for IFNG and immunofluorescence staining for CD69. Scale bar: 50 μm.
Figure 5
Figure 5. Single-cell TCR clonotype analysis of the human cervix.
Top, middle, and bottom rows are from C4, C2, and C5 cervical samples, respectively. Left: display of vdj clone count and expression of 5 genes (CD8A, IFNG, CD69, GZMB, and ITGAE) in the 2 clusters of cells representing TRM IFNG/CD69hi and TRM GZMB/ITGAEhi in UMAP. VDJ clone count refers to the number of cells that share the same TCR clonotype. Middle: graphs to show TCR clonotype size (number of cells sharing the same clonotype) and TCR clonotype overlaps between TRM GZMB/ITGAEhi and TRM IFNG/CD69hi. Individual circles represent individual clonotypes that are shared between the 2 subsets of CD8+ TRMs; Half circles represent individual clonotypes that are unique to TRM GZMB/ITGAEhi (x axis) or TRM IFNG/CD69hi (y axis). Right: Venn diagrams show clonotype overlaps between TRM GZMB/ITGAEhi and TRM IFNG/CD69hi. The 2 numbers in the middle of circles in the Venn diagrams refer to numbers of unique clonotypes associated with TRM GZMB/ITGAEhi and TRM IFNG/CD69hi. The numbers in the middle of the Venn diagrams refer to numbers of shared TCR clonotypes between TRM GZMB/ITGAEhi and TRM IFNG/CD69hi.
Figure 6
Figure 6. The expanded clonotypes in the human cervix were weighted toward CD8+ T cells.
(A) Frequency of individual clonotypes in CD8A+ and CD4+ T cells from the 4 cervix samples (top row: C2 and C5; bottom row: C1 and C6.1). X axis: individual clonotypes. Y axis: cell barcode frequency for individual clonotypes. The tables in individual graphs show numbers of cells that were CD8A+ or CD4+, numbers of unique TCR clonotypes, and percentages of clonotypes with a frequency of at least 2. (B) Differential gene expression between T cells with clonotype frequency of at least 2 and those with singletons in the 4 cervical samples (C4, C3, C6.1, and C1). Top graphs: distribution of clonotypes with frequency of at least 2 and those with singletons in tSNE plots. Bottom tables: lists of genes differentially expressed between T cells with clonotype frequency of at least 2 and those with singletons (P ≤ 0.05).

References

    1. Centers for Disease Control Prevention (CDC) Seroprevalence of herpes simplex virus type 2 among persons aged 14-49 years--United States, 2005-2008. MMWR Morb Mortal Wkly Rep. 2010;59(15):456–459. - PubMed
    1. Chemaitelly H, et al. Characterizing herpes simplex virus type 1 and type 2 seroprevalence declines and epidemiological association in the United States. PLoS One. 2019;14(6):e0214151. doi: 10.1371/journal.pone.0214151. - DOI - PMC - PubMed
    1. Tronstein E, et al. Genital shedding of herpes simplex virus among symptomatic and asymptomatic persons with HSV-2 infection. JAMA. 2011;305(14):1441–1449. doi: 10.1001/jama.2011.420. - DOI - PMC - PubMed
    1. Wald A, et al. Reactivation of genital herpes simplex virus type 2 infection in asymptomatic seropositive persons. N Engl J Med. 2000;342(12):844–850. doi: 10.1056/NEJM200003233421203. - DOI - PubMed
    1. Schiller JT, et al. An update of prophylactic human papillomavirus L1 virus-like particle vaccine clinical trial results. Vaccine. 2008;26(suppl 10):K53–K61. - PMC - PubMed

Publication types

MeSH terms