. 2021 Aug 2;131(15):e146301.
doi: 10.1172/JCI146301.

The clear cell sarcoma functional genomic landscape

Affiliations

The clear cell sarcoma functional genomic landscape

Emanuele Panza et al. J Clin Invest. .

Abstract

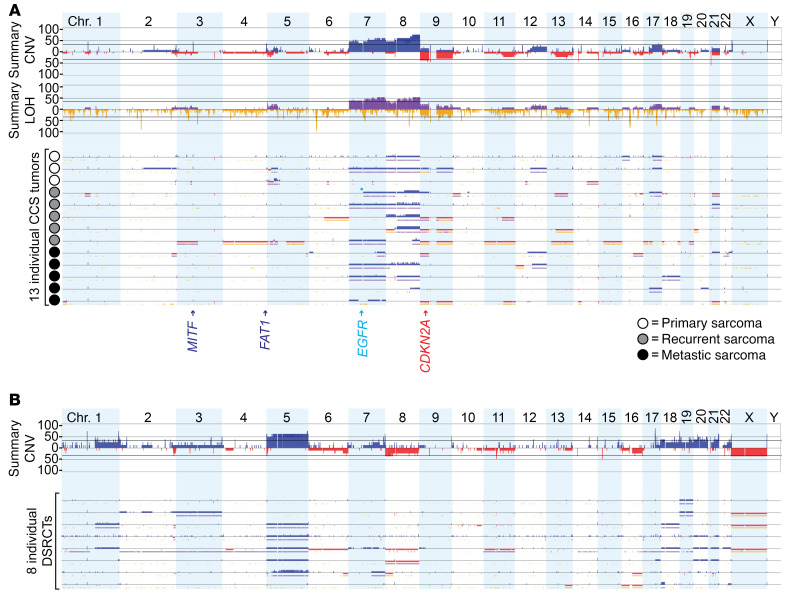
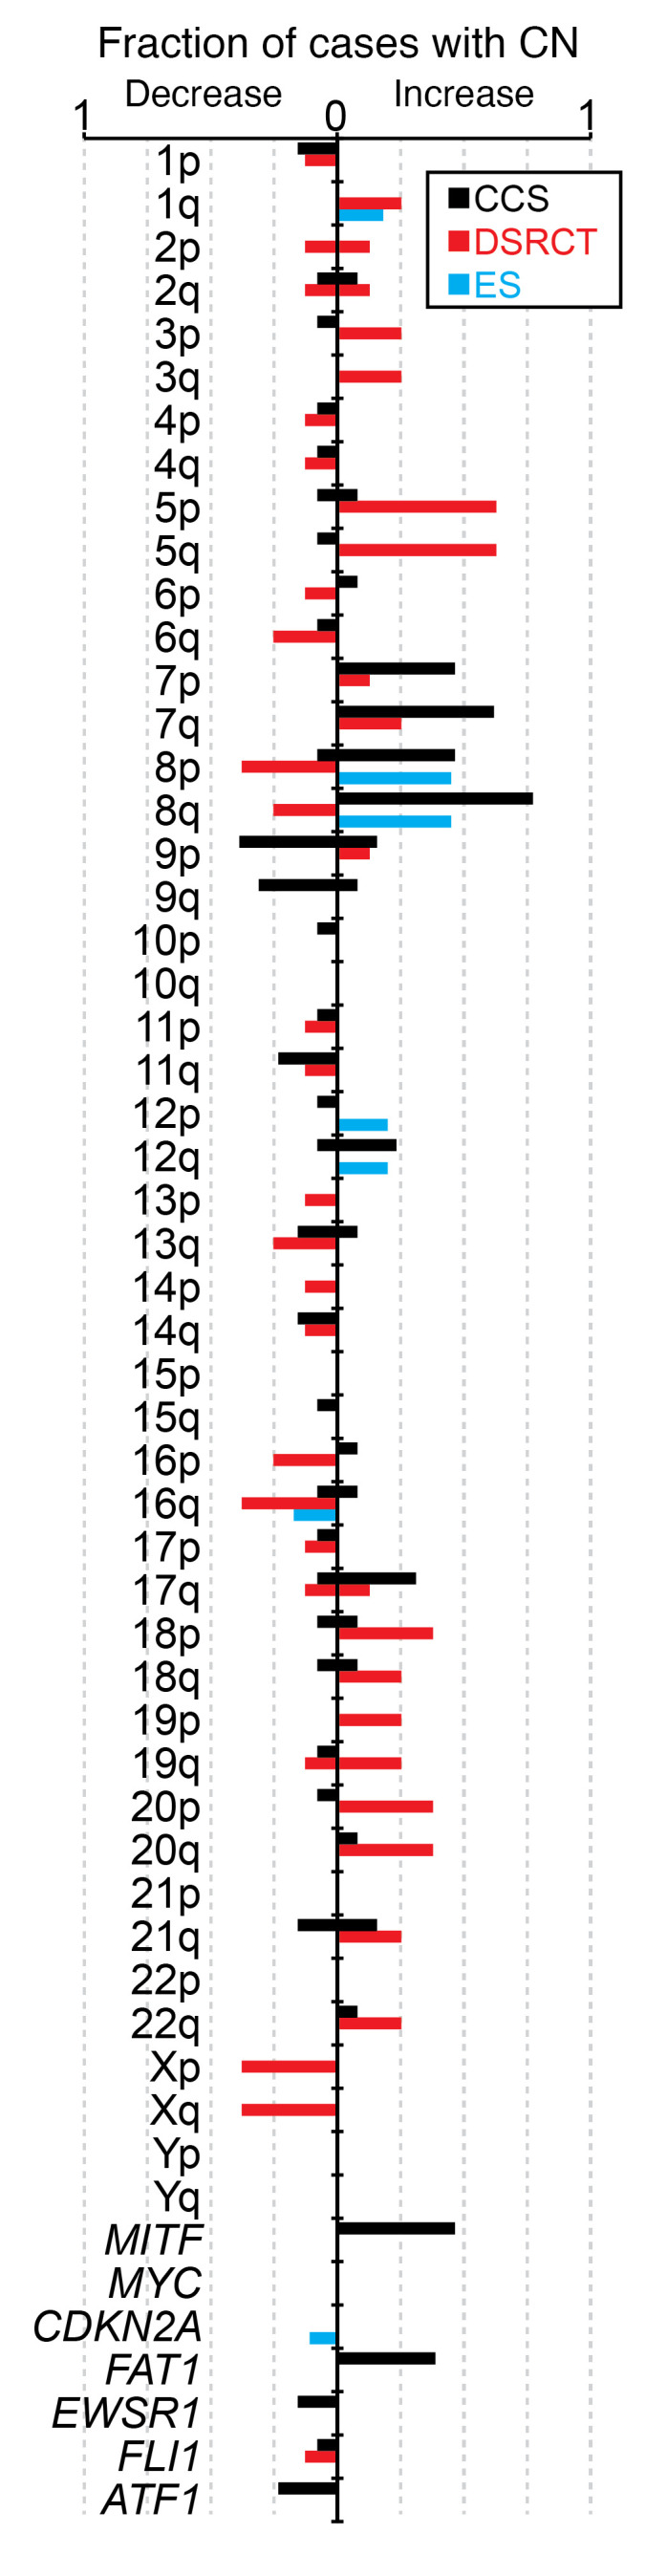
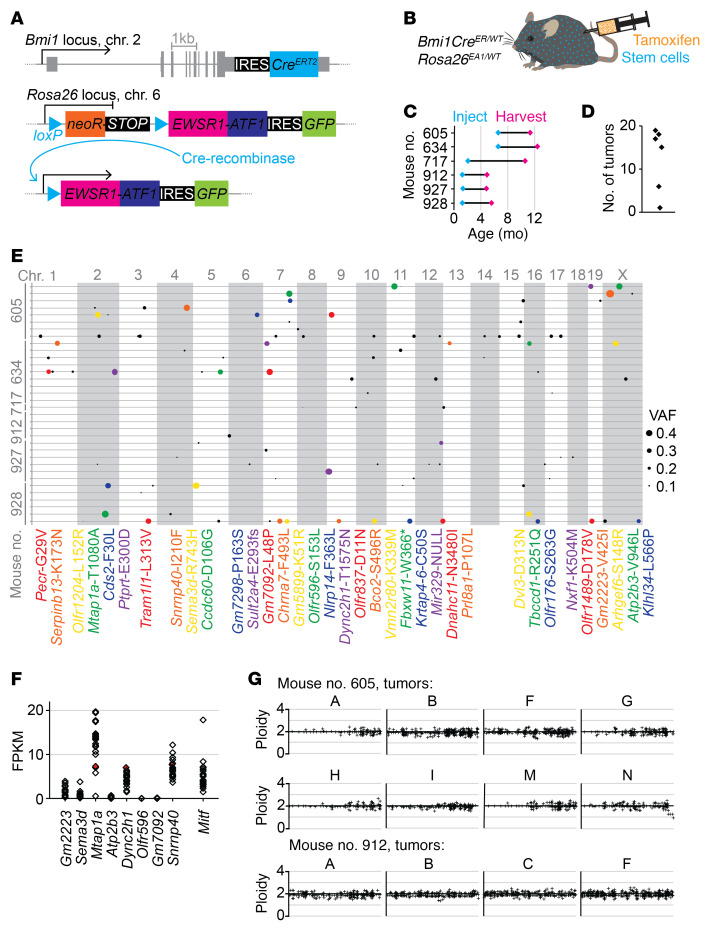
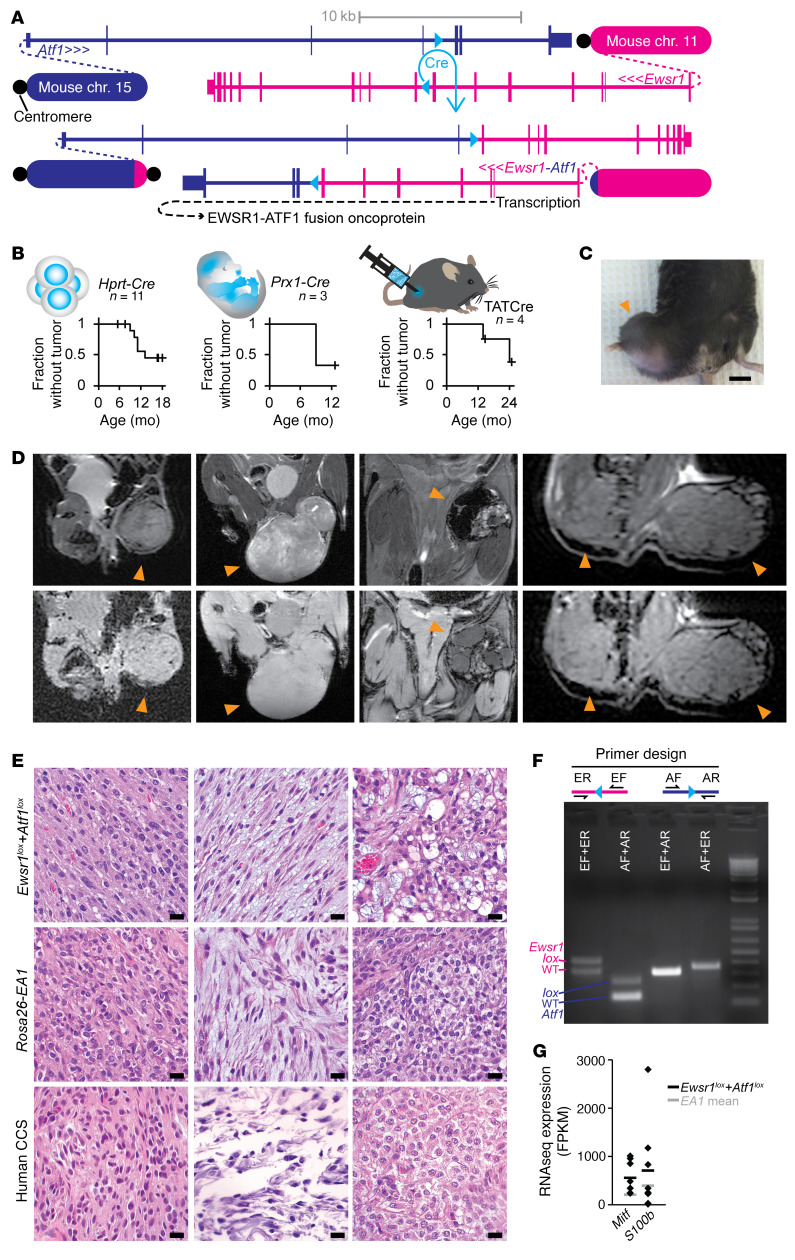
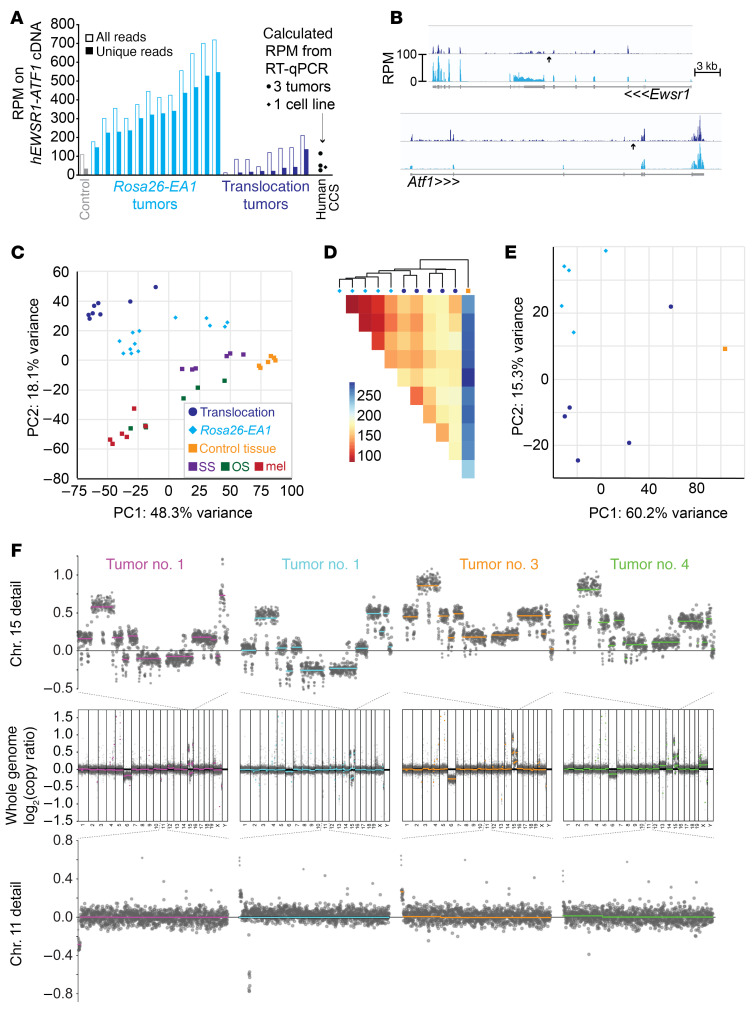
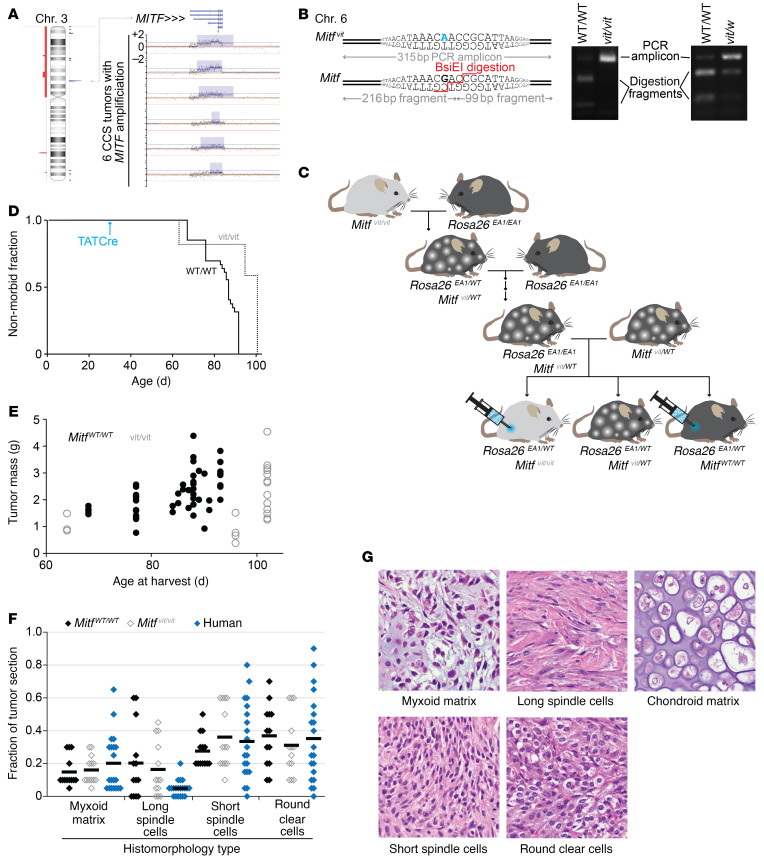
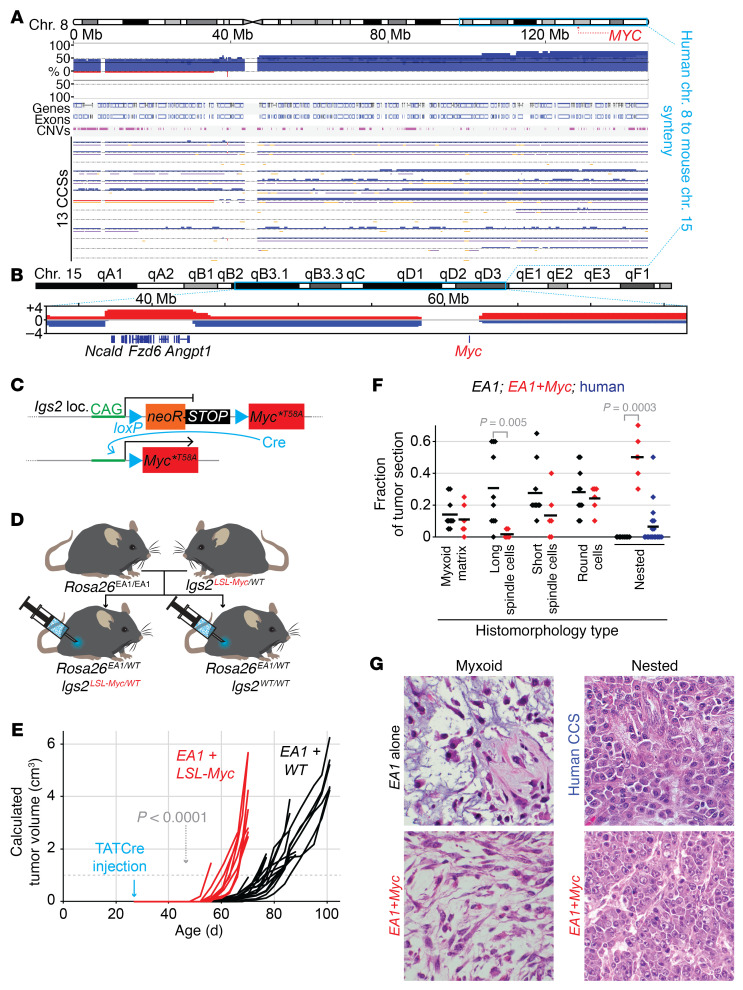
Clear cell sarcoma (CCS) is a deadly malignancy affecting adolescents and young adults. It is characterized by reciprocal translocations resulting in expression of the chimeric EWSR1-ATF1 or EWSR1-CREB1 fusion proteins, driving sarcomagenesis. Besides these characteristics, CCS has remained genomically uncharacterized. Copy number analysis of human CCSs showed frequent amplifications of the MITF locus and chromosomes 7 and 8. Few alterations were shared with Ewing sarcoma or desmoplastic, small round cell tumors, which are other EWSR1-rearranged tumors. Exome sequencing in mouse tumors generated by expression of EWSR1-ATF1 from the Rosa26 locus demonstrated no other repeated pathogenic variants. Additionally, we generated a new CCS mouse by Cre-loxP-induced chromosomal translocation between Ewsr1 and Atf1, resulting in copy number loss of chromosome 6 and chromosome 15 instability, including amplification of a portion syntenic to human chromosome 8, surrounding Myc. Additional experiments in the Rosa26 conditional model demonstrated that Mitf or Myc can contribute to sarcomagenesis. Copy number observations in human tumors and genetic experiments in mice rendered, for the first time to our knowledge, a functional landscape of the CCS genome. These data advance efforts to understand the biology of CCS using innovative models that will eventually allow us to validate preclinical therapies necessary to achieve longer and better survival for young patients with this disease.

Keywords: Cancer; Genetics; Mouse models; Oncogenes; Oncology.


Conflict of interest statement

Conflict of interest: The authors have declared that no conflict of interest exists.

Figures

Figure 1
Figure 1. Human CCSs demonstrate a few repeated CNAs across the genome.
(A) The frequency of copy number gains (blue) or losses (red), LOH (yellow), and point mutations (cyan diamond), as called by BioDiscovery Nexus Express, is shown for CCSs (n = 13). (B) The frequency of copy number gains (blue) or losses (red) is shown for DSRCTs (n = 8), as analyzed in parallel with CCSs for an accurate comparison. chr., chromosome.
Figure 2
Figure 2. CCS shares few secondary genomic alterations with other EWSR1-rearranged cancers.
Summary of CNAs by chromosome arm and genes of interest, displayed as the fraction (0–1) for each sarcoma subtype: CCS (n = 13), DSRCT (n = 8), and ES (n = 112). The prevalence of gains and losses for CCSs and DSRCTs reflects the heterozygous or homozygous loss or copy number (CN) gains present with at least 10% estimated clonality.
Figure 3
Figure 3. Exome sequencing of EWSR1-ATF1 expression–initiated mouse tumors reveals that no secondary alterations are strictly required to complete sarcomagenesis.
(A) Schematic illustrating CreERT2 engineered at the Bmi1 locus in conjunction with Cre-inducible human EWSR1-ATF1 engineered at the Rosa26 locus. Cre recombinase removes the neoR-STOP cassette to induce expression of EWSR1-ATF1, and the GFP reporter confirms EWSR1-ATF1 expression. (B) Tamoxifen injection induces CreERT2 activity in Bmi1-expressing stem cells (blue), and then in turn, Cre recombinase induces Rosa26-mediated expression of EWSR1-ATF1 (EA1). (C) Time course showing age at injection and age at tumor harvesting (n = 6). (D) Summary of total number of tumors detected and harvested per mouse (n = 6). (E) Exome sequencing of 34 mouse tumors, with 1 tumor’s exome presented on each line, clustered by host mouse, and each variant allele denoted by a circle whose size corresponds to the VAF. All variants with a VAF of greater than 0.25 are also identified by corresponding colors in the list of gene symbols and protein amino acid substitutions below. (F) RNA-Seq rendered expression levels relative to Gapdh for the 8 genes with variants present at fractions higher than 0.4. The level of Mitf expression is included for reference. (G) Exome-wide CNV was inferred from exome sequencing data, as shown for 12 mouse tumors. Normal diploidy is represented by the x axis crossing at a value of y = 2.
Figure 4
Figure 4. Cre-mediated chromosomal translocation induces sarcomagenesis in the mouse.
(A) Schematic representation of the loxP sites targeted to Ewsr1 intron 7 and Atf1 intron 4, as well as the 2 products of Cre-mediated chromosomal translocation. (B) Schematics and Kaplan-Meier survival plots of tumorigenesis in mice heterozygous for Ewsr1-loxP and Atf1-loxP, induced by 3 different Cre recombinase delivery methods: a knockin allele (HprtCre), a transgenic allele (Prx1Cre), and injection of Cre recombinase protein (TATCre). (C) Gross photo of a hind-limb Prx1Cre-induced tumor (arrowhead) forming in a mouse. Scale bar: 10 mm. (D) Magnetic resonance images of HprtCre- or TATCre-induced tumors (indicated by arrowheads) forming in the thigh, dorsal pelvis, thigh, and both the pelvis and contralateral thigh of mice (upper panels, T2-weighted; lower panels, proton density–weighted). (E) Representative H&E-stained photomicrographs of histological sections of tumors from translocation (top panels), Rosa26-EA1–expressing (middle panels), and human CCS tumors (below), with (from left to right) short spindle cell, myxoid, and clear cell morphologies. Scale bars: 10 μm. (F) Schematic of the PCR amplification strategy with a schematic of primers that amplify across each translocation site, tested in genomic tumor DNA from a TATCre-induced tumor, with WT and lox alleles as well as each translocation product detected by specified primer combinations. ER, Ewsr1 reverse; EF, Ewsr1 forward; AF, Atf1 forward; AR, Atf1 reverse. (G) Graph showing the RNA-Seq–determined expression (in fragments per kilobase per million reads [FPKM]) of 2 melanocytic marker genes, with 8 HprtCre-induced translocation tumors and their mean indicated in black and the mean of 13 EA1-induced tumors in gray.
Figure 5
Figure 5. Cre-mediated translocation model of clear cell sarcomagenesis mimics the transcriptome of the EWSR1-ATF1 expression model but has additional genome CNAs.
(A) Graph of the RPM that aligned onto the human EWSR1-ATF1 fusion oncogene cDNA coding sequence expressed conditionally from the Rosa26 locus and from the HprtCre-induced translocation tumor. For reference, also noted are the RT-qPCR–calculated RPM levels of EWSR1-ATF1 expression from the human SU-CCS1 cell line and from 3 FFPE human CCS tumor specimens, using B2M as a control in the human samples and its average expression across the mouse samples to calculate an RPM estimate. (B) RPM alignments across the genomic sequence for Ewsr1 and Atf1, averaged across 8 translocation-generated tumors (dark blue) and 12 Rosa26-EA1 tumors (cyan), demonstrating overall lower expression (compared with cDNA expression in the EA1 tumors) and a reduced 3′ bias in the exons 3′ to the translocation point (arrow) of Ewsr1 relative to the same in Atf1 in the translocation-generated tumors, which may represent reduced expression of the exons 3′ to the translocation in Ewsr1 or increased expression of the exons 3′ to the translocation in Atf1. (C) PCA demonstrating relative clustering of 8 translocation-driven sarcomas with Rosa26-EA1–driven comparators, separate from the clusterings of other mouse cancer subtypes sequenced in the same batch as the EA1 tumors. SS, synovial sarcoma; OS, osteosarcoma; mel, melanoma. (D) Heatmap of the Pearson’s correlation distance between single-batch–sequenced transcriptomes of the Rosa26-EA1–driven (cyan diamonds) or HprtCre-induced translocation–driven (blue circles) sarcomas, as well as 1 control tissue sample. (E) PCA of the same transcriptomes as in D. (F) CNA analysis on 4 HprtCre-induced translocation tumors, using a low-read-depth whole-genome sequencing approach. The upper row shows higher-resolution images of chromosome 15 from the sequencing of each tumor, the middle row shows the CNAs across the entire genome, and lower row shows chromosome 11 from each.
Figure 6
Figure 6. MITF contributes to oncogenesis driven by EWSR1-ATF1.
(A) Left: Human chromosome 3 is shown with the spike in amplification (in blue) that occurred in 6 of 13 human CCS tumors. Right: Copy number microarray data showing that the recurrent, focal amplification occurred at the MITF locus in all 6 tumors. (B) Mouse DNA sequences depicting the Mitf vitiligo (Mitf vit) mutation (top left panel, in blue) and the normal Mitf sequence. The BsiEI restriction enzyme was used to confirm Mitf vit after PCR, because it recognizes and cuts WT Mitf but not Mitf vit (right panel). (C) Mouse breeding schematic showing the strategy to generate EA1 heterozygotic mice with homozygous mutant or homozygous WT Mitf littermates, which we injected with TATCre to induce EWS-ATF1 expression. (D) Kaplan-Meier curve shows the achievement of morbidity of Mitf WT/WT mice (solid line) and Mitf vit/vit mice (dotted line) following TATCre injection at 28 days of age (n = 37 Mitf WT/WT mice and n = 15 Mitf vit/vit mice). The 50% median survival time to morbidity for Mitf vit/vit mice was 102 days compared with 87 days for WT mice. A log-rank test was performed, and the difference was deemed statistically significant (P < 0.0001, z score = 4.52). (E) Tumor mass measurements for Mitf WT/WT mice (black dots) and Mitf vit/vit mice (gray circles). The tumors were not significantly different in size (P = 0.6, by 2-tailed Student’s t test). (F) Graph of the blinded quantitation of histological features of tumors developing from EA1 expression in either Mitf WT/WT mice (black diamonds, n = 37) or Mitf vit/vit mice (gray diamonds, n = 15), with human CCSs on a tissue microarray (n = 20, blue diamonds). P = 0.05, by 2-tailed Student’s t test (none of these comparisons between the 2 mouse groups reached statistical significance). (G) Representative histomorphologies in H&E-stained tissue sections of EA1-expressing tumors. Each photomicrograph is a 100 μm square obtained with a 60× original magnification objective lens.
Figure 7
Figure 7. MYC stabilization enhances EWSR1-ATF1–induced sarcomagenesis but alters tumor phenotypes.
(A) BioDiscovery data on CNAs in regions of human chromosome 8 that are syntenic to amplified regions of mouse chromosome 15 and that flank MYC. (B) CNAs in regions of mouse chromosome 15 syntenic to human chromosome 8 and surrounding Myc. (C) Schematic showing the floxed stop cassette that allows for Cre-inducible expression of MycT58A at the Igs2 locus. (D) Breeding strategy to generate mice that express both EWSR1-ATF1 (EA1) and MycT58A upon TATCre injection, as well as Igs2WT/WT littermate controls. (E) Tumor growth curves for Rosa26EA1/WT mice with either Igs2LSL-Myc/WT (red) or Igs2WT/WT (black), following TATCre injection at 28 days of age. (F) Graph of the blinded quantitation of H&E-stained slides for histologic features distinguishing tumors expressing EA1 alone and tumors expressing EA1 plus MycT58A (EA1+Myc, red), with, for reference, the prevalence of the nested morphology observed in human CCSs on a tissue microarray (n = 20). (G) Photomicrographs of H&E-stained tissue sections demonstrating the 2 variants on myxoid features, 1 in each genotype, as well as the nested histomorphology observed focally in 7 human tumors (n = 20) and all Myc-activating mouse tumors (each photomicrograph is a 100 μm square obtained with a 60× original magnification objective lens).

Similar articles

Cited by

References

    1. Hanahan D, et al. The origins of oncomice: a history of the first transgenic mice genetically engineered to develop cancer. Genes Dev. 2007;21(18):2258–2270. doi: 10.1101/gad.1583307. - DOI - PubMed
    1. Goodwin ML, et al. Modeling alveolar soft part sarcomagenesis in the mouse: a role for lactate in the tumor microenvironment. Cancer Cell. 2014;26(6):851–862. doi: 10.1016/j.ccell.2014.10.003. - DOI - PMC - PubMed
    1. Haldar M, et al. A conditional mouse model of synovial sarcoma: insights into a myogenic origin. Cancer Cell. 2007;11(4):375–388. doi: 10.1016/j.ccr.2007.01.016. - DOI - PubMed
    1. Jones KB, et al. The impact of chromosomal translocation locus and fusion oncogene coding sequence in synovial sarcomagenesis. Oncogene. 2016;35(38):5021–5032. doi: 10.1038/onc.2016.38. - DOI - PMC - PubMed
    1. Straessler KM, et al. Modeling clear cell sarcomagenesis in the mouse: cell of origin differentiation state impacts tumor characteristics. Cancer Cell. 2013;23(2):215–227. doi: 10.1016/j.ccr.2012.12.019. - DOI - PMC - PubMed

Publication types

MeSH terms

Substances