. 2021 Aug 9;6(15):e142073.
doi: 10.1172/jci.insight.142073.

Early defects in mucopolysaccharidosis type IIIC disrupt excitatory synaptic transmission

Affiliations

Early defects in mucopolysaccharidosis type IIIC disrupt excitatory synaptic transmission

Camila Pará et al. JCI Insight. .

Abstract

The majority of patients affected with lysosomal storage disorders (LSD) exhibit neurological symptoms. For mucopolysaccharidosis type IIIC (MPSIIIC), the major burdens are progressive and severe neuropsychiatric problems and dementia, primarily thought to stem from neurodegeneration. Using the MPSIIIC mouse model, we studied whether clinical manifestations preceding massive neurodegeneration arise from synaptic dysfunction. Reduced levels or abnormal distribution of multiple synaptic proteins were revealed in cultured hippocampal and CA1 pyramidal MPSIIIC neurons. These defects were rescued by virus-mediated gene correction. Dendritic spines were reduced in pyramidal neurons of mouse models of MPSIIIC and other (Tay-Sachs, sialidosis) LSD as early as at P10. MPSIIIC neurons also presented alterations in frequency and amplitude of miniature excitatory and inhibitory postsynaptic currents, sparse synaptic vesicles, reduced postsynaptic densities, disorganized microtubule networks, and partially impaired axonal transport of synaptic proteins. Furthermore, postsynaptic densities were reduced in postmortem cortices of human MPS patients, suggesting that the pathology is a common hallmark for neurological LSD. Together, our results demonstrate that lysosomal storage defects cause early alterations in synaptic structure and abnormalities in neurotransmission originating from impaired synaptic vesicular transport, and they suggest that synaptic defects could be targeted to treat behavioral and cognitive defects in neurological LSD patients.

Keywords: Genetics; Lysosomes; Neuroscience; Synapses.


Conflict of interest statement

Conflict of interest: The authors have declared that no conflict of interest exists.

Figures

Figure 1
Figure 1. Primary and secondary storage in cultured hippocampal neurons from MPSIIIC mice.
(A) Cultured primary hippocampal neurons from MPSIIIC mice at DIV21 contain multiple coarse HS+/LAMP1+ cytoplasmic puncta, consistent with the lysosomal storage of HS. (B) Cultured hippocampal MPSIIIC neurons show storage of GM2 ganglioside in the granules, only partially colocalizing with LAMP1+ vacuoles. (C and D) The dual pattern of storage is confirmed by electron microscopy, where both electron-dense storage bodies (arrows) containing lipids and misfolded proteins and electron-lucent organelles (asterisks) with glycan storage can be observed in both cultured neurons and microglia derived from the brains of MPSIIIC embryos. Scale bar: 10 μm (A and B), 2 μm (C), and 500 nm (D). Data show representative images from 3 experiments, each involving pooled embryos from at least 3 mice per genotype.
Figure 2
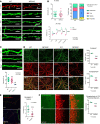
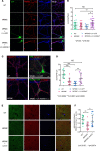
Figure 2. MPSIIIC hippocampal neurons present decreased density of mature dendritic spines, reduced densities of Syn1, and synaptophysin+ puncta in the axons.
(A) Representative images of dendritic spines in cultured neurons at DIV21 and in CA1 pyramidal EGFP-expressing neurons of mice in vitro and at P10, P20, 3 months and 8 months. In cultured neurons, mature (mushroom) spines are marked with yellow arrows, while immature spines (filopodia) are marked with white arrows. The majority of dendritic spines in MPSIIIC are immature. Dendrites in pyramidal MPSIIIC neurons have wider areas resembling spheroids. (B) Top: Quantification (left) and distribution of different types of spines (right) in cultured neurons. Bottom: Quantification of dendritic spines in pyramidal neurons. (C) Representative images and quantification of dendritic spines in CA1 pyramidal EGFP-expressing neurons of a 3-month-old sialidosis (Neu1–/–) mouse and a Tay-Sachs (Hexa–/–) mouse and their respective WT littermates. The quantification of spines was performed in a blinded manner for 20 μm–long dendrite segments starting at 30 μm from the soma. Scale bar: 25 μm for panels and 10 μm for enlargements. (D) Representative images of cultured hippocampal neurons at DIV21 from WT and MPSIIIC mice stained for Syn1 and synaptophysin. MPSIIIC neurons have lower density of Syn1+ and synaptophysin+ puncta. (E) Representative images of cultured neurons, stained for Syn1 and an axonal marker, neurofilament medium chain protein. MPSIIIC neurons have lower density of Syn1+ puncta per length of the axon. (F) Representative images of CA1 pyramidal neurons of 2-month-old MPSIIIC and WT mice stained for synaptophysin and NeuN. MPSIIIC mice have lower density of synaptophysin+ puncta. Scale bar: 25 μm (D and F) and 10 μm (E). Graphs show quantification values, mean ± SD obtained for at least 30 cells from 3 mice per each age and genotype. P values were calculated using unpaired 2-tailed t test (B [upper graph] and DF); 1-way ANOVA with Tukey post hoc test (C), and 2-way ANOVA with Bonferoni post hoc test (B, lower graph).
Figure 3
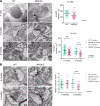
Figure 3. MPSIIIC hippocampal neurons present scarcity of synaptic vesicles in the synaptic terminals.
(A) Representative TEM images and quantification of synaptic vesicles in terminals of cultured hippocampal neurons at DIV21 and of pyramidal neurons from the CA1 hippocampus region of 3- and 6-month-old mice. An autophagosome in the synaptic terminal is marked with an arrowhead. Scale bar: 200 nm. (B) Representative TEM images and quantification of docking synaptic vesicles (arrowheads) in terminals of CA1 neurons from 3- and 6-month-old mice. Graphs show quantification values, mean ± SD obtained for at least 30 cells from 3 mice per each age and genotype. P values were calculated using unpaired 2-tailed t test.
Figure 4
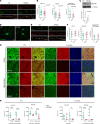
Figure 4. MPSIIIC hippocampal and cortical neurons present alterations in the distribution of protein markers of the excitatory synapse.
(A) Representative images of hippocampal cultured neuron at DIV21 stained for VGLUT1 and PSD-95. Scale bars: 10 μm. (B) MPSIIIIC cells show significantly lower densities of PSD-95+ puncta and PSD-95+ puncta in juxtaposition with VGLUT1+ puncta. (C) Immunoblotting confirms the reduction of PSD-95 in cultured hippocampal MPSIIIC neurons. (D) Representative images of cultured hippocampal neurons stained for Nlgn1 and nuclear marker DRAQ5. In MPSIIIC neurons, Nlgn1 shows perinuclear accumulation instead of fine puncta observed in the neurites of WT cells. Scale bars: 15 μm. (E) Representative images of hippocampal cultured neuron at DIV21 stained for VGAT and gephyrin. Juxtaposition between the VGAT+ and gephyrin+ puncta indicates functional synapses. Scale bars: 10 μm. (F) Quantification of VGAT+ puncta, gephyrin+ puncta, and their juxtaposition. A, C, D, and E show representative results of 3 experiments, each involving pooled embryos from at least 3 mice per genotype. The quantification of puncta in B and F was performed within 25 μm segments of dendrites at 30 μm from the soma in a double-blinded manner, using cultures from 3 independent experiments with a total of 10 cells being analyzed for each experiment. All graphs show individual data, mean ± SD. P values were calculated by 2-tailed t test. (G) Representative confocal images of somatosensory cortex (layers 2/3) and CA1 hippocampal regions of WT and MPSIIIC mice at P10 and 6 months stained for the markers of excitatory synapse, PSD-95 and VGLUT1. Scale bars: 25 μm. (H) Density of VGLUT1+ and PSD-95+ puncta were quantified using ImageJ software. The quantification of puncta was performed in a blinded manner using 3 mice per age per genotype. Three adjacent panels were analyzed in each mouse. Graph shows individual values, mean ± SD. P values were calculated by 2-tailed t test.
Figure 5
Figure 5. Cortical neurons of neurological MPS patients and hippocampal neurons of MPSIIIC mice present reduction of postsynaptic densities.
(A) Representative confocal images of postmortem human cortices from controls and MPS patients stained with antibodies against PSD-95. (B) Density of PSD-95+ puncta in human cortices. Scale bar: 10 μm. (C) Representative TEM images of synapses in cultured hippocampal neurons at DIV21 and in pyramidal neurons from the CA1 region of the hippocampus of 3- and 6-month-old mice. PSDs are marked with arrowheads. Scale bar: 250 nm. (D) Quantification of length (nm) and area (μm2) of PSDs in hippocampal cultured neurons and in pyramidal neurons from the CA1 region of the hippocampus. Data show individual values, mean ± SD of 3 different neuronal cultures or 3 mice per genotype with at least 10 images analyzed for each experiment. Only asymmetric (excitatory) PSDs were considered for analysis. P values were calculated by 2-tailed t test.
Figure 6
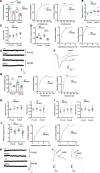
Figure 6. Alteration of miniature excitatory and inhibitory postsynaptic currents in MPSIIIC neurons.
(A) Distribution of mEPSC amplitudes showing significant decrease in the mEPSC amplitude in MPSIIIC mice at P14–P20 and P45–P60. (B and C) No significant difference in the decay constant (B) or rise time (C) of mEPSC events was detected at P14–P20 or P45–P60. (D) Distribution of mEPSC instantaneous frequencies showing significant decrease in the mEPSC frequency in MPSIIIC mice as compared with WT in P14–P20 and P45–P60 hippocampal slices. (E and F) Representative traces of mEPSCs at P14–P20 and P45–P60 (E) and overlay of representative individual events from MPSIIIC and WT mice at P45–P60 (F). (G) Distribution of mIPSC amplitudes showing significant decrease in the mIPSC amplitude in MPSIIIC as compared with WT in P14–P20 and P45–P60 hippocampal slices. (H) No significant differences in the fast decay constant or the fast rise time at both ages. (I) No significant differences in the slow decay constant or the slow rise time of mIPSCs. (J) Distribution of mIPSC instantaneous frequencies showing significant decrease in the mIPSCs frequency in MPSIIIC mice as compared with WT in P45–P60 hippocampal slices. (K and L) Representative traces of mIPSCs at P14–P20 and P45–P60 (K) and overlay of representative individual mIPSC events with fast kinetics (left panel) and slow kinetics (right panel) for MPSIIIC and WT mice at P45–P60 (L). Statistical analyses for Gaussian-distributed events were performed using 1-way ANOVA with Tukey’s post test. Non-Gaussian–distributed events were analyzed by Kruskal-Wallis test, followed by Dunn’s test. * P < 0.05, ** P < 0.01, *** P < 0.001, and **** P < 0.0001. Kolmogorov-Smirnov test was performed for not normally distributed events.
Figure 7
Figure 7. Deficit of PSD-95 and Syn1 in MPSIIIC neurons is rescued in vitro and in vivo by transduction with viral vectors encoding for WT human HGSNAT.
( A) Representative images of cultured hippocampal WT and MPSIIIC neurons, and MPSIIIC neurons, transduced with either LV-GFP or LV-HGSNAT-GFP, stained with anti–PSD-95 and anti-MAP2 antibodies. (B) Quantification of PSD-95 puncta in WT, and MPSIIIC cells — as well as in MPSIIIC cells — transduced with LV-GFP or LV-HGSNAT-GFP. (C) Representative images of cultured WT and MPSIIIC neurons, and MPSIIIC neurons, transduced with either LV-GFP or LV-HGSNAT-GFP, stained with anti-Syn1 and anti-neurofilament antibodies. (D) Quantification of Syn1 puncta in the axons of cultured neurons. Graphs in B and D show individual data, mean ± SD for at least 9 cells from 3 independent cultures, each with cells pooled from 3 or more embryos per genotype. P values were calculated using 1-way ANOVA with Bonferroni post hoc test. (E) Representative images of CA1 region of the hippocampus from untreated WT and MPSIIIC mice or MPSIIIC mice treated with AAV9-HGSNAT, stained with anti-Syn1 and anti–PSD-95 antibodies. Scale bar: 10 μm. (F) Quantification of Syn1+ and PSD-95+ puncta in juxtaposition. Graphs show data from 4 or 5 different mice per condition, with 3 images analyzed per animal. P value was calculated by 1-way ANOVA with Bonferroni analysis for multiple comparisons.
Figure 8
Figure 8. Semiquantitative LC-MS/MS analysis of proteins present in synaptosomes from brains of 3- and 6-month-old mice reveals deficiencies of synaptic, mitochondrial, and trafficking vesicle–associated proteins in MPSIIIC mice.
(A) Total number of proteins identified by LC-MS/MS in synaptosomes extracted from the brains of WT and MPSIIIC mice at 3 and 6 months of age. (B) Volcano plots of the proteins identified in synaptosomes showing proteins that are statistically different between WT and MPSIIIC. (C) Gene ontology (GO) terms versus fold-change of the proteins reduced in MPSIIIC synaptosomes. The data represent values where the Benjamini-Hochberg-corrected P value is below the highest Benjamini-Hochberg-corrected P value for the GO terms. (D) Numbers of q values per ontology term showing significantly enriched biological processes. The q values represent P values adjusted for FDR: q value = P value × (total number of hypotheses tested)/(rank of the P value).
Figure 9
Figure 9. Deficiencies of synaptic, mitochondrial, and trafficking vesicle–associated proteins in brains of 3- and 6-month-old MPSIIIC mice.
(A) Exclusive unique peptide counts of synaptic proteins. (B) Western blots of total protein extracts from brains of 6-month-old mice and their respective quantifications confirming changes in protein abundance identified by proteomic analysis. (C) Exclusive unique peptide counts of mitochondrial proteins. (D) Exclusive unique peptide counts of proteins associated with intracellular vesicle trafficking and endocytosis. Proteomic analyses and Western blots were performed using synaptosomes extracted from 3 different animals per age per genotype. P values for the exclusive unique peptide counts areas on the peptide chromatograms were calculated using 2-way ANOVA with Bonferroni post hoc test. P values for B were calculated using 2-tailed t test.
Figure 10
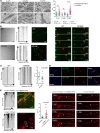
Figure 10. Vesicle transport defects in MPSIIIC neurons.
(A) Microtubules in MPSIIIC hippocampal cultured neurons are disorganized, sparse, and nonparallel, with storage vacuoles between the filaments. Graphs show individual distances between adjacent microtubules, mean ± SD from at least 30 cells from 3 experiments with different neuronal cultures or 3 different animals per genotype. P values were calculated using 2-tailed t test. (B) Bright-field images (left), fluorescence images (right), and kymographs of Syn1+ vesicles (middle) in WT and MPSIIIC neurons transduced with LV-Syn1-GFP. In MPSIIIC neurons, moving GFP+ vesicles show a wiggling pattern, while in WT cells, the majority of vesicles travel in 1 direction (red arrowhead). (C) GFP+ vesicles in MPSIIIC neurons have a slower speed. Videos were recorded every 2 seconds for 10 minutes. The bar graph shows the speed of individual Syn1+ vesicles, mean ± SD measured in 17 WT and 12 MPSIIIC cells in 3 different sets of experiments for each genotype; P value was calculated by 2-tailed t test. (D) The Syn1-GFP+ granules in MPSIIIC neurons do not colocalize with LAMP2 or LC3. (E) Fluorescence images (left) and kymographs (right) of Syn1-mCherry+ vesicles in MPSIIIC hippocampal neurons transduced with LV-Syn1-mCherry or cotransduced with LV-Syn1-mCherry and LV-HGSNAT-GFP. In GFP neurons, moving mCherry+ vesicles show a wiggling pattern, while in GFP+ cells, the majority of moving vesicles travel in 1 direction (white arrowhead). mCherry+ vesicles in the MPSIIIC neurons expressing HGSNAT-GFP move at a higher speed than those in nontransduced MPSIIIC cells. Videos were recorded every 2 seconds for 10 minutes. The bar graph shows the speed of individual Syn1+ vesicles, mean ± SD measured in 10 nontransduced (17 vesicles) and 9 transduced (17 vesicles) MPSIIIC cells originating from 3 different sets of experiments. P value was calculated by 2-tailed t test. Scale bars: 500 nm (A) and 10 μm (B, D, and E).

Similar articles

Cited by

References

    1. Boustany RM. Lysosomal storage diseases--the horizon expands. Nat Rev Neurol. 2013;9(10):583–598. doi: 10.1038/nrneurol.2013.163. - DOI - PubMed
    1. Meikle PJ, et al. Prevalence of lysosomal storage disorders. JAMA. 1999;281(3):249–254. doi: 10.1001/jama.281.3.249. - DOI - PubMed
    1. Bartsocas C, et al. Sanfilippo type C disease: clinical findings in four patients with a new variant of mucopolysaccharidosis III. Eur J Pediatr. 1979;130(4):251–258. doi: 10.1007/BF00441361. - DOI - PubMed
    1. Scriver CR, et al. The Metabolic and Molecular Bases of Inherited Disease. McGraw-Hill Professional; 2001.
    1. Valstar MJ, et al. Sanfilippo syndrome: a mini-review. J Inherit Metab Dis. 2008;31(2):240–252. doi: 10.1007/s10545-008-0838-5. - DOI - PubMed

Publication types

MeSH terms