. 2021 Aug 9;6(15):e149346.
doi: 10.1172/jci.insight.149346.

Endothelial STING controls T cell transmigration in an IFNI-dependent manner

Affiliations

Endothelial STING controls T cell transmigration in an IFNI-dependent manner

Marina Anastasiou et al. JCI Insight. .

Abstract

The stimulator of IFN genes (STING) protein senses cyclic dinucleotides released in response to double-stranded DNA and functions as an adaptor molecule for type I IFN (IFNI) signaling by activating IFNI-stimulated genes (ISG). We found impaired T cell infiltration into the peritoneum in response to TNF-α in global and EC-specific STING-/- mice and discovered that T cell transendothelial migration (TEM) across mouse and human endothelial cells (EC) deficient in STING was strikingly reduced compared with control EC, whereas T cell adhesion was not impaired. STING-/- T cells showed no defect in TEM or adhesion to EC, or immobilized endothelial cell-expressed molecules ICAM1 and VCAM1, compared with WT T cells. Mechanistically, CXCL10, an ISG and a chemoattractant for T cells, was dramatically reduced in TNF-α-stimulated STING-/- EC, and genetic loss or pharmacologic antagonisms of IFNI receptor (IFNAR) pathway reduced T cell TEM. Our data demonstrate a central role for EC-STING during T cell TEM that is dependent on the ISG CXCL10 and on IFNI/IFNAR signaling.

Keywords: Cell migration/adhesion; Endothelial cells; Inflammation; Vascular Biology.


Figures
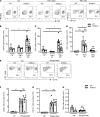
Figure 1
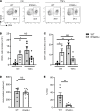
Figure 1. Impaired leukocyte recruitment in response to TNF-α–induced peritonitis in STING–/– mice compared with WT mice.
(AH) WT and STING–/– mice received PBS, TNF-α 4 hours (h), or TNF-α 24 h (AD) or thioglycollate 3 days (EH) via i.p. injection, and the peritoneal lavage was analyzed by FACS. (A) Representative flow cytometric panels of CD45+CD4+ cells recruited to the peritoneal cavity at 24 h and of CD45+Gr1+ at 4 h. (BD) Quantification of total CD45+ (B), CD45+CD4+ (C), and CD45+Gr1+ (D) recruited to the peritoneal cavity. n = 3 (control); n = 12 (TNF-α 24 h); n = 3-4 (TNF-α 4 h). (E) Representative flow cytometric panels of CD45+CD11b+ cells recruited to the peritoneal cavity in response to thioglycolate of 3 independent experiments. (FH) Quantification of CD45+ (F), CD45+CD11b+ (G), and CD45+CD4+ (H) recruited cells to the peritoneal cavity. n = 3 (control); n = 8 (thioglycollate). Data are shown as mean ± SEM values. *P < 0.05 and **P < 0.01; 2-way ANOVA (BD) and 1-way ANOVA (FH).
Figure 2
Figure 2. STING deficiency in EC but not in T cells results in impaired TEM in response to TNF-α.
(A) Cultured MHEC from WT and STING–/– mice were lysed and analyzed by immunoblot to evaluate STING expression and β-actin, used as a loading control. (B and C) Quantification of adhesion and %TEM of WT and STING–/– Th1 cells perfused across WT and STING–/– MHEC (for WT Th1 groups: n = 3 independent experiments with WT and STING–/– MHEC preparations and Th1 preparations, using duplicate or triplicate coverslips). (D) Representative images of WT and STING–/– Th1 cell adhesion on ICAM1- and VCAM1-coated coverslips following perfusion under flow conditions. Scale bar: 100 μm. (E and F) Quantification of Th1 adhesion on ICAM1 (n = 3 independent experiments, triplicate coverslips) and on VCAM1 (n = 3 independent experiments). (G and H) Representative flow cytometry histograms and quantification of VLA-4 (G) and of LFA-1 (H) from WT and STING–/– Th1 cells (n = 3 independent Th1 cell preparations). Data are shown as mean ± SEM. ***P < 0.001; 1-way ANOVA (B and C) and t test (E and H).
Figure 3
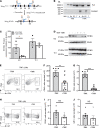
Figure 3. Decreased T cell recruitment into the peritoneal cavity of EC-STING–/– mice in response to TNF-α.
(A) Schematic gene-targeting map of STING gene showing STING floxed and STING conditional alleles before and after tamoxifen (TMX) treatment (75 mg/kg body weight) and primer (P1 and P2) binding sites, with orange arrows pointing at the LoxP sites. (B) Primer pair P1 and P2 were used to detect unexcised and excised STING alleles in the heart (H), Splenocytes (Sp), MHEC (EC), and T cells (T) purified from Cad5ERTCre2+/– STINGfl/fl treated with vehicle or TMX. (C) Quantification of STING protein expression in cultured MHEC from Cad5ERTCre2+/– STINGfl/fl and WT Th1 cells treated with vehicle or 4OH-TMX for 24 h. (D) Western blotting images of 4OH-TMX–treated cell lysate. Each line is an independent cell preparation (n = 3). (E) Representative flow cytometric panels of CD45+CD4+ cells recruited to the peritoneal cavity 24 h after TNF-α. (F and G)Quantification of total CD45+ (F) and CD4+ (G) cells recruited cells to the peritoneal cavity 24 h after TNF-α. (H) Representative flow cytometric panels of CD45+Gr1+ cells recruited to the peritoneal cavity 4 h after TNF-α. (I and J) Quantification of total CD45+ (I) and Gr1+ (J) cells recruited to the peritoneal cavity 4 h after TNF-α. Data represent n = 2 independent experiments; n = 3 control and n = 4 TMX-treated mice per experiment (24 h TNF-α.); and n = 6 animals per group (4 h TNF-α). *P < 0.05, **P < 0.01 and ***P < 0.001; t test.
Figure 4
Figure 4. STING modulation of T cell TEM is independent of NF-κΒ–inducible adhesion molecules and dependent on the ISG CXCL10.
(A and B) Immunoblot (A) and quantification from 3 independent experiments (B) of STING and β-actin expression in control and STING KD HUVEC monolayers using CRISPR. (C and D) CD3+ T cells isolated from human blood were perfused under flow conditions across WT and STING KD HUVEC stimulated for 4 h with TNF-α, and accumulation (C) and %TEM (D) were quantified. n = 8 control and n = 10 TNF-α coverslips from 3 independent experiments. (E and F) Representative histograms of surface PECAM-1, ICAM1, and VCAM1 per cell fluorescent intensity on HUVEC (E) and MHEC (F). (G) Quantification of CXCL10 in supernatants collected from WT and STING–/– MHEC at baseline and in response to 4-h TNF-α stimulation from n = 3 cell preparations. (H and I) Quantification of accumulation (H) and %TEM (I) of Th1 cells perfused across control and anti-CXCL10-treated MHEC from n = 3 independent experiments. Data are shown as mean ± SEM values. *P < 0.05, **P < 0.01 and ***P < 0.001; t test.
Figure 5
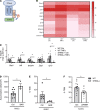
Figure 5. T cell TEM is dependent of EC JAK/STAT and IFNI.
(A) Schematic of IFN-α and IFN-β molecules binding to the heterodimeric IFNAR and signal through JAK1 to recruit STAT1. (B) Representative heatmap corresponding to log2 values from RNA-seq of WT and STING–/– control and 4-h TNF-α–stimulated MHEC (n = 3 mice/group were pulled for RNA-seq). (C) qPCR validation of STAT1 and the indicated ISG in WT and STING–/– control and 4-h TNF-α–stimulated MHEC (n = 3 independent MHEC preparations, n = 2 replicates per condition). (D) Quantification of WT Th1 T cell accumulation. (E) WT Th1 T cell %TEM across 4-h TNF-α–stimulated MHEC treated with JAK1 inhibitor BAR. n = 3 independent experiments (duplicate coverslips for control). (F) Quantification of human CD3+ T cell %TEM across 4-h TNF-α–stimulated HUVEC with IFNAR blockade. n = 4 independent experiments, triplicate coverslips. Data are mean ± SEM. *P < 0.05; t test.
Figure 6
Figure 6. Exogenous Paracrine IFNI signaling contributes to leukocyte recruitment in response to TNF-α–induced peritonitis and TEM in vitro.
(AC) WT and IFNAR–/– mice received PBS or TNF-α i.p., and the peritoneal lavage was harvested and analyzed by FACS. (A) Representative flow cytometric panels of CD45+CD4+ cells recruited to the peritoneal cavity. (B and C) Quantification of total CD45+ (B) and CD4+ (C) cells recruited cells to the peritoneal cavity (n = 4–7 mice/group). (D and E) WT Th1 cells were perfused across TNF-α–stimulated MHEC monolayers, and adhesion (D) and WT %TEM (E) were quantified from n = 3 independent experiments using duplicate or triplicate coverslips. Data are mean ± SEM. *P < 0.05 and **P < 0.01; 1-way ANOVA (B and C) and t test (D and E).
Figure 7
Figure 7. Schematic representation of the role of endothelial cell STING1 in T cell TEM and recruitment to sites of TNF-α–mediated inflammation.
The absence of endothelial STING impairs TEM in a IFNI manner via the IFNAR and impairment of the IFNI induced gene CXCL10, a chemoattractant for T cells.

References

    1. Schnoor M, et al. Crossing the vascular wall: common and unique mechanisms exploited by different leukocyte subsets during extravasation. Mediators Inflamm. 2015;2015:946509. - PMC - PubMed
    1. Ishikawa H, Barber GN. Erratum: STING is an endoplasmic reticulum adaptor that facilitates innate immune signalling. Nature. 2008;456(7219):274 - PMC - PubMed
    1. Smith JA. STING, the endoplasmic reticulum, and mitochondria: is three a crowd or a conversation? Front Immunol. 2020;11:611347. - PMC - PubMed
    1. Chen Q, et al. Regulation and function of the cGAS-STING pathway of cytosolic DNA sensing. Nat Immunol. 2016;17(10):1142–1149. doi: 10.1038/ni.3558. - DOI - PubMed
    1. Woo SR, et al. STING-dependent cytosolic DNA sensing mediates innate immune recognition of immunogenic tumors. Immunity. 2014;41(5):830–842. doi: 10.1016/j.immuni.2014.10.017. - DOI - PMC - PubMed

Publication types

MeSH terms