. 2021 Aug 2;131(15):e146323.
doi: 10.1172/JCI146323.

Extracellular matrix protein laminin β1 regulates pain sensitivity and anxiodepression-like behaviors in mice

Affiliations

Extracellular matrix protein laminin β1 regulates pain sensitivity and anxiodepression-like behaviors in mice

Zhen-Zhen Li et al. J Clin Invest. .

Abstract

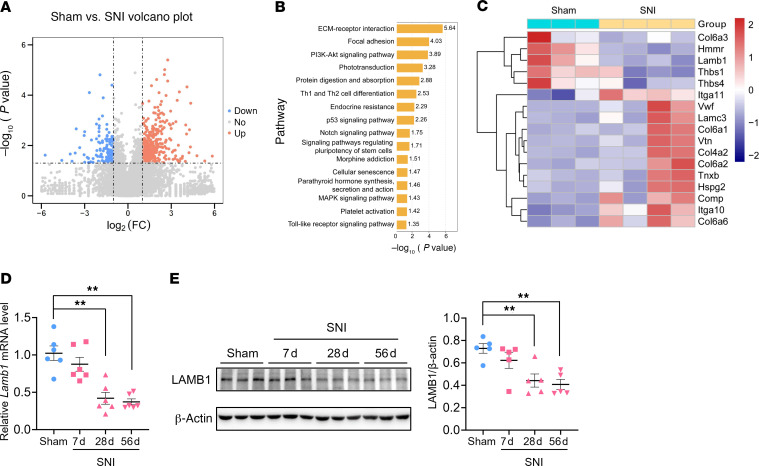
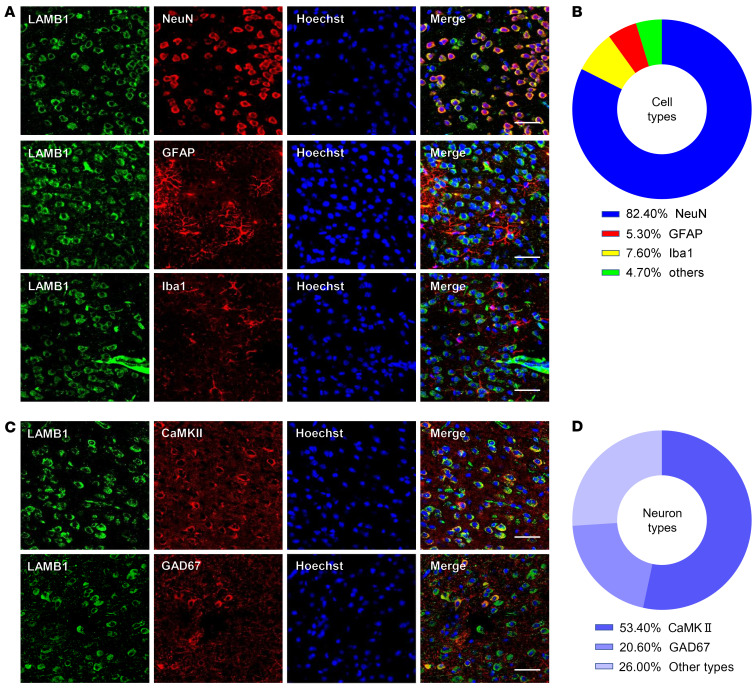
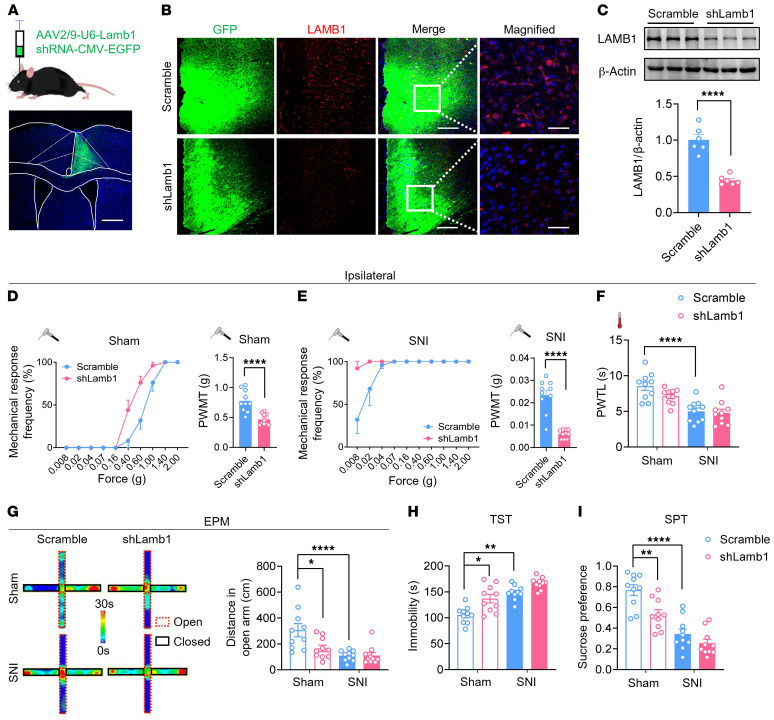
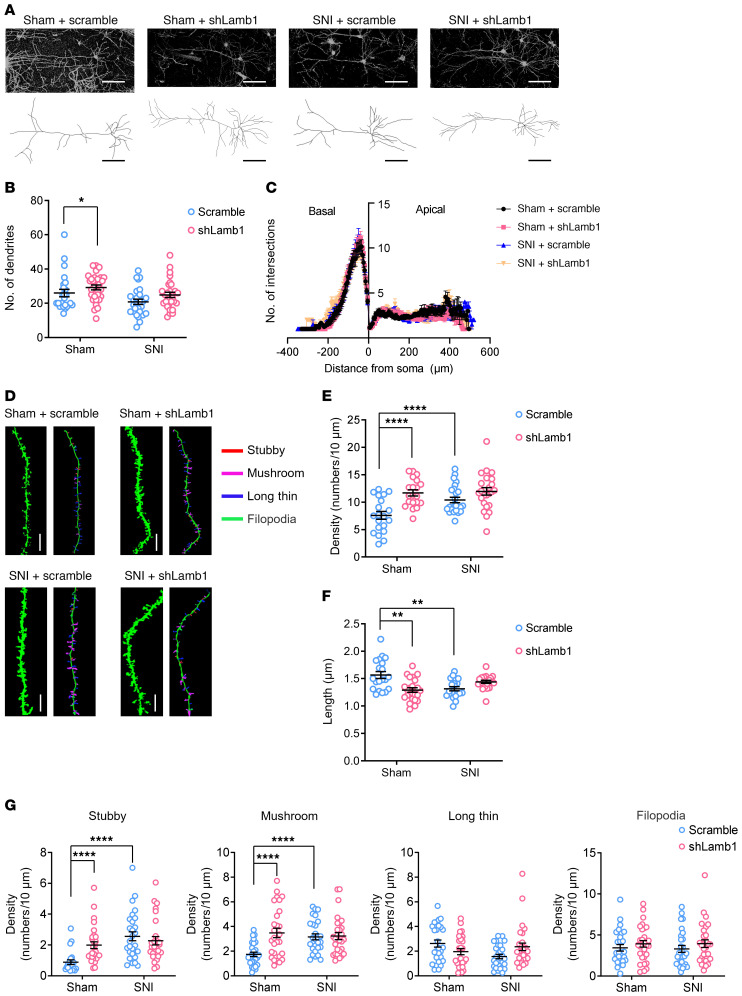
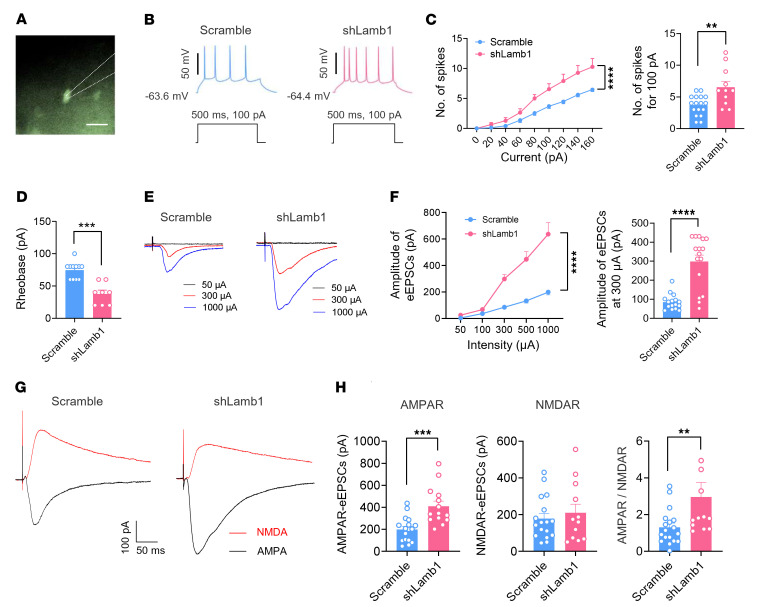
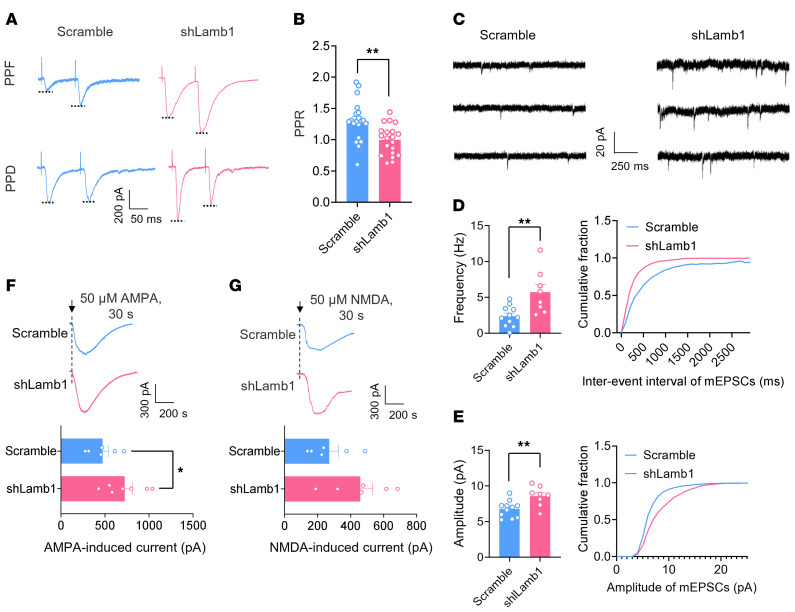
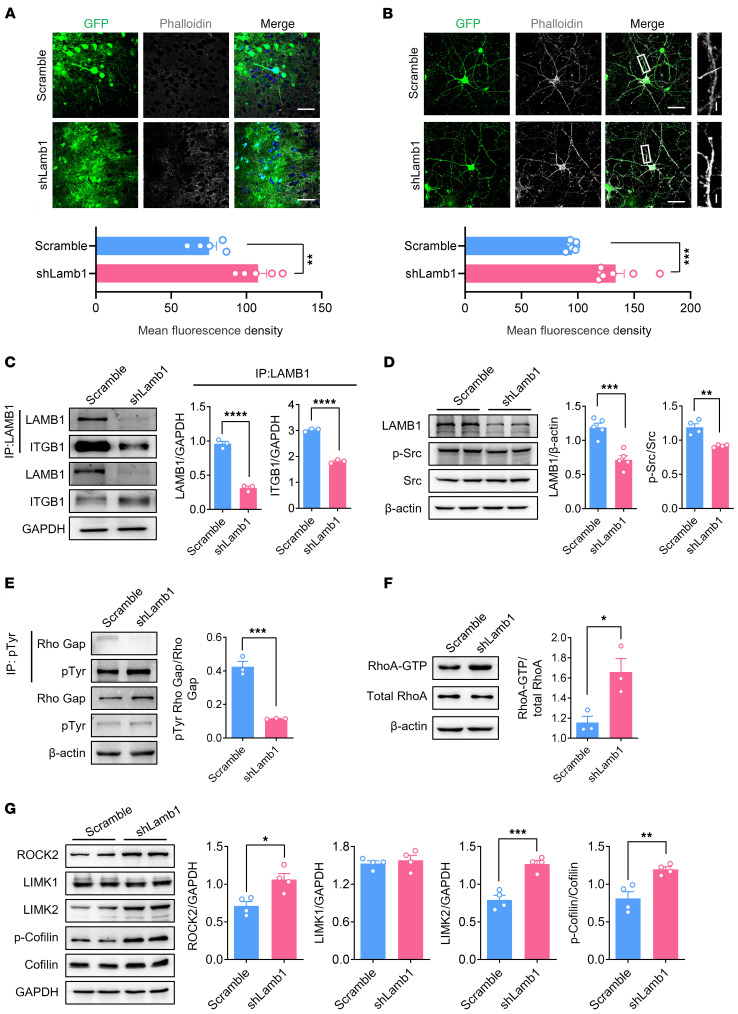
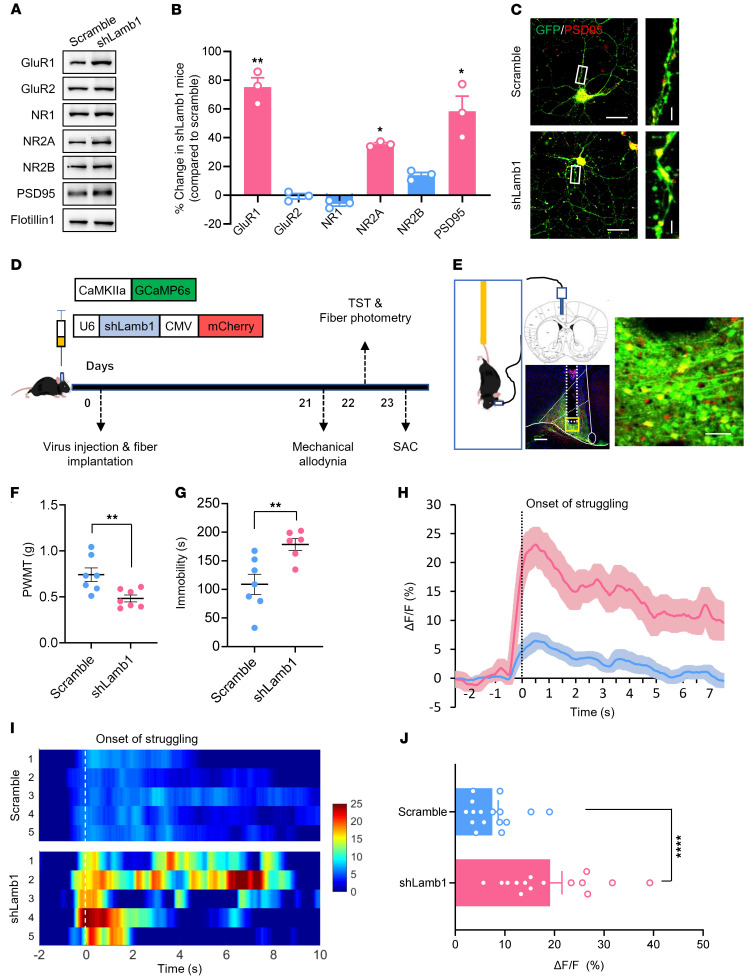
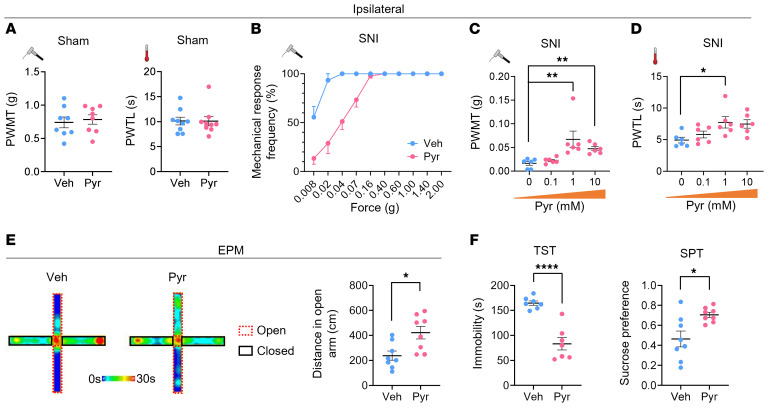
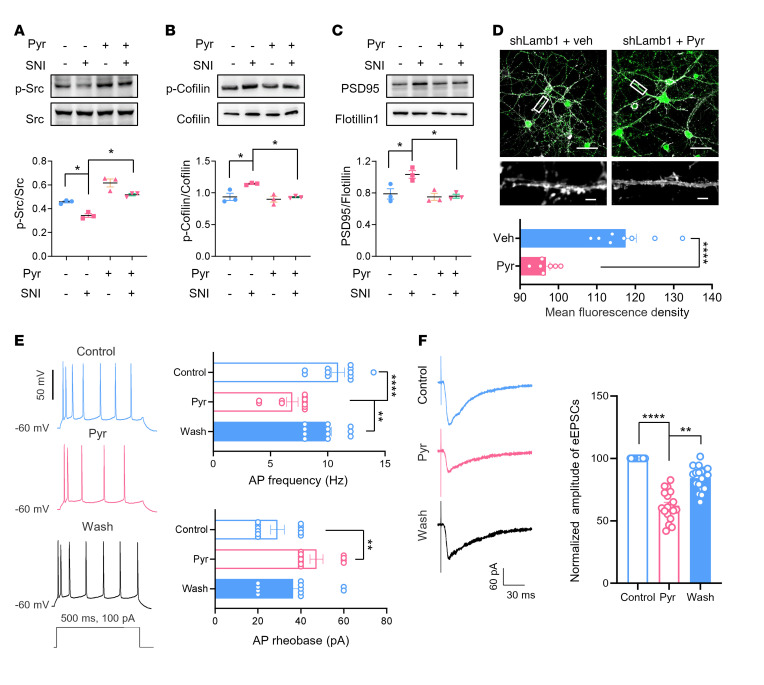
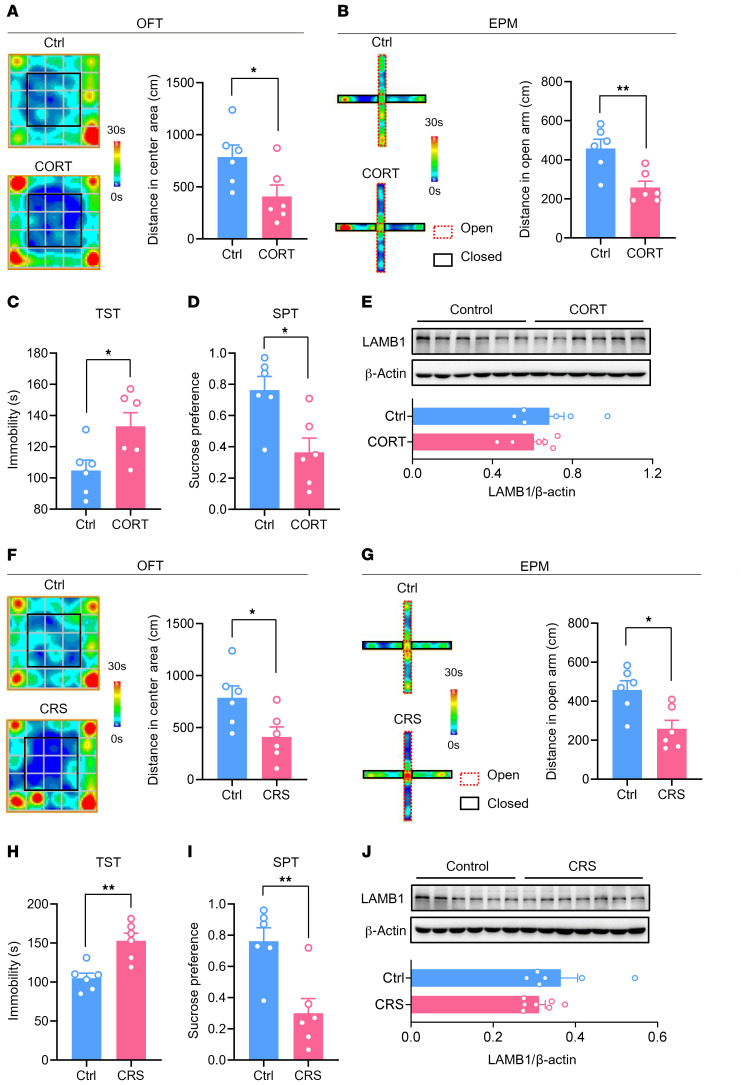
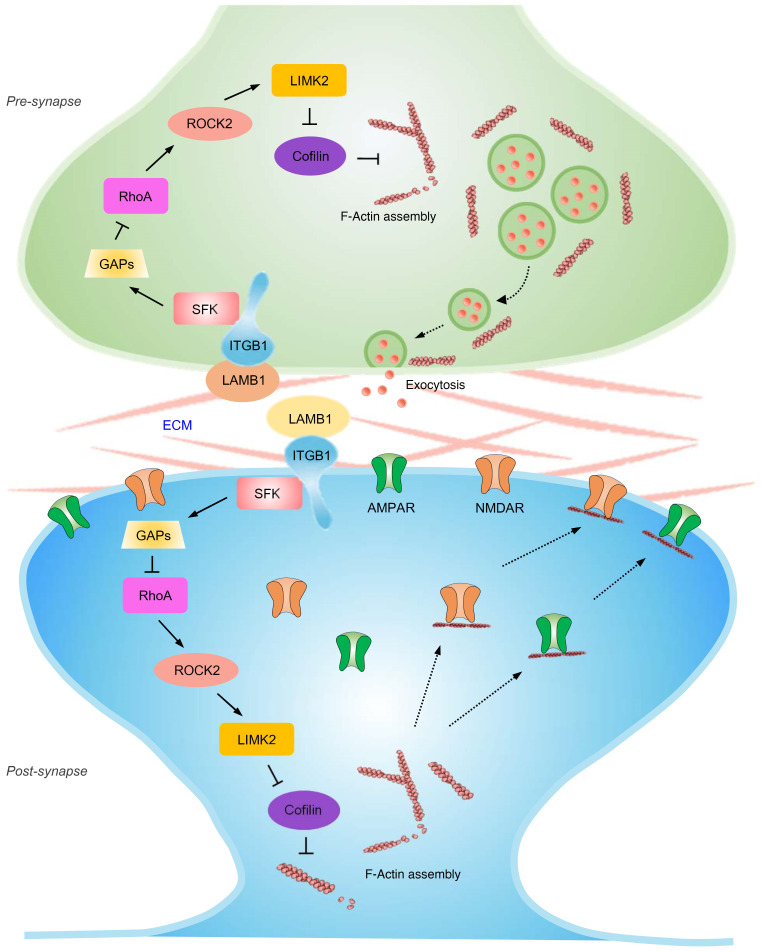
Patients with neuropathic pain often experience comorbid psychiatric disorders. Cellular plasticity in the anterior cingulate cortex (ACC) is assumed to be a critical interface for pain perception and emotion. However, substantial efforts have thus far been focused on the intracellular mechanisms of plasticity rather than the extracellular alterations that might trigger and facilitate intracellular changes. Laminin, a key element of the extracellular matrix (ECM), consists of one α-, one β-, and one γ-chain and is implicated in several pathophysiological processes. Here, we showed in mice that laminin β1 (LAMB1) in the ACC was significantly downregulated upon peripheral neuropathy. Knockdown of LAMB1 in the ACC exacerbated pain sensitivity and induced anxiety and depression. Mechanistic analysis revealed that loss of LAMB1 caused actin dysregulation via interaction with integrin β1 and the subsequent Src-dependent RhoA/LIMK/cofilin pathway, leading to increased presynaptic transmitter release probability and abnormal postsynaptic spine remodeling, which in turn orchestrated the structural and functional plasticity of pyramidal neurons and eventually resulted in pain hypersensitivity and anxiodepression. This study sheds new light on the functional capability of ECM LAMB1 in modulating pain plasticity and identifies a mechanism that conveys extracellular alterations to intracellular plasticity. Moreover, we identified cingulate LAMB1/integrin β1 signaling as a promising therapeutic target for the treatment of neuropathic pain and associated anxiodepression.

Keywords: Depression; Laminin; Neuroscience; Pain.


Conflict of interest statement

Conflict of interest: The authors have declared that no conflict of interest exists.

Figures

Figure 1
Figure 1. Peripheral neuropathy decreases LAMB1 expression in the ACC.
(A) Volcano plot showing RNA-Seq data for contralateral ACC from SNI- versus sham-treated mice. DEGs are designated in orange (upregulation [up]) and blue (downregulation [down]) and defined as having an FDR of less than 0.05. FC, fold change. (B) Bar plot showing significant enrichment of DEGs in various pathways. (C) Relative expression levels are shown for genes in the ECM-receptor interaction pathway upon SNI as compared with sham treatment (n = 3–4 mice per group). (D and E) LAMB1 was downregulated in the ACC at both the mRNA (D) (n = 6) and protein (E) (n = 5) levels 7 days (7d), 28 days (28d), and 56 days (56d) after SNI surgery. **P < 0.01, by Kruskal-Wallis H test with Nemenyi’s multiple-comparison test. Data are presented as the mean ± SEM. See Supplemental Table 2 for detailed statistical information.
Figure 2
Figure 2. Characterization of expression profile of LAMB1 in the ACC.
(A and B) Representative immunofluorescence images (A) and quantitative summary (B) showing that LAMB1 was highly coexpressed with NeuN and sparsely coexpressed with GFAP or Iba1 (n = 3). (C and D) Representativeimmunofluorescence images (C) and quantitative summary (D) showing that LAMB1 expression was found in CaMKII+ neurons and GAD67+ neurons (n = 3). Scale bars: 30 μm (A and C).
Figure 3
Figure 3. LAMB1 knockdown in the ACC induces pain hypersensitivity and anxiodepression.
(A) Schematic diagram of intra-ACC virus injection into C57BL/6 mice (n = 10). Scale bar: 500 μm. (B and C) Double-immunofluorescence images (B) and Western blots (C) showing efficient LAMB1 knockdown in the ACC (n = 6). ****P < 0.0001, by 2-tailed, unpaired separate variance estimation t test. Scale bars: 200 μm and 70 μm (enlarged insets). (D and E) Stimulus response curve and mechanical threshold showing that ACC LAMB1 knockdown exacerbated ipsilateral mechanical sensitivity in sham-treated (D) and SNI-treated (E) mice (n = 10). ****P < 0.0001, by Mann-Whitney U test. (F) Ipsilateral thermal sensitivity was unaltered by LAMB1 knockdown in the sham- or SNI-treated state (n = 10). ****P < 0.0001, by 1-way ANOVA with Tukey’s multiple-comparison test. (G) Traveling trajectory in the EPM and quantitative summary showed that sham-treated mice expressing shLamb1 traveled shorter distances in the open arm (n = 10). *P < 0.05 and ****P < 0.0001, by Kruskal-Wallis H test with Nemenyi’s multiple-comparison test. (H) The TST showed that expression of AAV-shLamb1 resulted in longer immobility for the sham-treated mice and further exacerbated immobility following SNI (n = 10). *P < 0.05 and **P < 0.01, by Kruskal-Wallis H test with Nemenyi’s multiple-comparison test. (I) The SPT showed a strong reduction in sucrose preference in shLamb1-expressing mice (n = 10). **P < 0.01 and ****P < 0.0001, by 1-way ANOVA with Tukey’s multiple-comparison test. Data are presented as the mean ± SEM. See Supplemental Table 2 for detailed statistical information. PWMT, paw withdrawal mechanical threshold; PWTL, paw withdrawal thermal latency.
Figure 4
Figure 4. LAMB1 deficiency in the ACC induces apical dendritic spine remodeling of ACC pyramidal neurons.
(A) Representative images of pyramidal neurons in the ACC derived from sham- and SNI-treated mice expressing scrambled shRNA or shLamb1 (n = 24–30). Scale bars: 100 μm. (B and C) Sholl analysis of dendritic branching complexity in the basal and apical dendrites of sham- or SNI-operated mice expressing scrambled shRNA or shLamb1 (n = 24–30). *P < 0.05, by Kruskal-Wallis H test with Nemenyi’s multiple-comparison test. (D) Representative confocal stack and 3D reconstruction images of apical dendrites of ACC pyramidal neurons obtained from mice expressing shLamb1 or scrambled shRNA in both sham and SNI conditions (n = 20–25). Scale bars: 5 μm. (E and F) Summary of spine density (E) and length (F) of apical dendrites of ACC pyramidal neurons obtained from mice expressing shLamb1 or scrambled shRNA in both sham and SNI conditions (n = 20–25). **P < 0.01 and ****P < 0.0001, by Kruskal-Wallis H test with Nemenyi’s multiple-comparison test. (G) Summary of the density of stubby-, mushroom-, long/thin-, and filopodia-shaped spines on apical dendrites of ACC pyramidal neurons from mice of the above 4 groups (n = 22–29). ****P < 0.0001, by Kruskal-Wallis H test with Nemenyi’s multiple-comparison test. Data are presented as the mean ± SEM. See Supplemental Table 2 for detailed statistical information.
Figure 5
Figure 5. LAMB1 deficiency evokes neuronal hyperexcitability and synaptic potentiation in ACC pyramidal neurons.
(A) Whole-cell patch-clamp recording from ACC layer II/III pyramidal neurons. Scale bar: 50 μm. (B) APs induced by current injection at 100 pA in neurons expressing shLamb1 or scrambled shRNA (n = 11–17). (C) Left: I-O curve in response to a depolarizing current step (20 pA step, 500 ms duration) showing a higher firing frequency in mice expressing shLamb1 (n = 11–17). ****P < 0.0001, by Friedman’s M test. Right: Typical result at an intensity of 100 pA. **P < 0.01, by 2-tailed, unpaired separate variance estimation t test. (D) A lowered rheobase was observed after LAMB1 knockdown (n = 8–11). ***P < 0.001, by Mann-Whitney U test. (E and F) Representative traces (E) and I-O curve (F) of AMPAR-mediated eEPSCs following stimulation of layer V/VI ACC pyramidal neurons in mice of both genotypes (n = 16). ****P < 0.0001, by Friedman’s M test (left panel) and Mann-Whitney U test (right panel). Right panel in F shows typical quantification of AMPARs-eEPSCs evoked by 300 μA stimulation. (G and H) Representative traces (G) and quantitative summary (H) of AMPAR/NMDAR EPSC ratios for mice of both genotypes (n = 12–18). ***P < 0.001, by 2-tailed, unpaired t test for AMPARs-eEPSCs; **P < 0.01, by Mann-Whitney U test for NMDAR-eEPSCs and AMPAR/NMDAR. Data are presented as the mean ± SEM. See Supplemental Table 2 for detailed statistical information.
Figure 6
Figure 6. Both presynaptic and postsynaptic mechanisms are involved in the synaptic potentiation induced by LAMB1 knockdown in the ACC.
Representative paired-pulse traces (A) and quantitative summary (B) of PPF or PPD showing that LAMB1 knockdown led to a reduced PPR (n = 20). **P < 0.01, by 2-tailed, unpaired t test. (CE) Representative traces (C) and quantification of mEPSC frequency (D) and amplitude (E) showing that LAMB1 knockdown significantly increased mEPSC frequency and amplitude (n = 8–11). **P < 0.01, by 2-tailed, unpaired separate variance estimation t test (D) and 2-tailed, unpaired t test (E). (F and G) Inward currents induced by bath-applied AMPA (50 μM) (F) or NMDA (50 μM) (G) in mice of both genotypes (n = 6–7). *P < 0.05, by 2-tailed, unpaired t test. Data are presented as the mean ± SEM. See Supplemental Table 2 for detailed statistical information.
Figure 7
Figure 7. LAMB1-knockdown mice exhibit altered Src/RhoA/LIMK/cofilin signaling and dysregulated F-actin in the ACC.
(A and B) Confocal images of F-actin staining with phalloidin in ACC slices from mice expressing scrambled shRNA or shLamb1 (A) (n = 5) and cultured cortical neurons transfected with shLamb1 or scrambled shRNA (B) (n = 7). **P < 0.01 and ***P < 0.001, by 2-tailed, unpaired t test (A) and Mann-Whitney U test (B). Scale bars: 30 μm (A); 50 μm and 5 μm (enlarged insets)(B). (C) Representative immunoblots and quantitative summary of immunoprecipitated LAMB1 and integrin β1 in ACC lysates derived from mice expressing scrambled shRNA or shLamb1 (n = 3). ****P < 0.0001, by 2-tailed, unpaired t test. (D) Representative immunoblots and quantitative summary of levels of LAMB1, p-Src, and total Src in ACC lysates from mice expressing scrambled shRNA or shLamb1 (n = 4–5). **P < 0.01 and ***P < 0.001, by 2-tailed, unpaired t test (LAMB1/β-actin) and 2-tailed, unpaired separate variance estimation t test (p-Src/Src). (E) Representative immunoblots of immunoprecipitated p-Tyr and quantitative summary of p-Tyr, p190RhoGAP, and β-actin (loading control) levels (n = 3). ***P < 0.001, by 2-tailed, unpaired separate variance estimation t test. (F) Representative immunoblots and quantitative summary of RhoA-GTP and total RhoA levels using a pulldown assay (n = 3). *P < 0.05, by 2-tailed, unpaired t test. (G) Representative immunoblots and quantitative summary of ROCK2, LIMK1, LIMK2, p-cofilin, and total cofilin levels in ACC lysates derived from mice expressing scrambled shRNA or shLamb1 (n = 4). *P < 0.05, **P < 0.01, and ***P < 0.001, by 2-tailed, unpaired t test. Data are presented as the mean ± SEM. See Supplemental Table 2 for detailed statistical information.
Figure 8
Figure 8. LAMB1 knockdown leads to increased AMPAR membrane trafficking and increased activity of ACC pyramidal neurons.
(A and B) Representative immunoblots (A) and quantitative summary (B) showing the expression of AMPARs and NMDAR subunits in the membrane fraction of ACC tissue from mice expressing scrambled shRNA or shLamb1 (n = 3). For the quantitative analysis in B, a 2-step normalization was performed. Step 1: each blot was normalized (i.e., GluR1, GluR2, NR1, NR2A, NR2B, PSD95) to the loading control Flotillin 1 in the scrambled and shLamb1 groups, respectively; step 2: each subunit in the shLamb1 group was normalized to the scrambled group to assess the changes in each subunit. *P < 0.05 and **P < 0.01, by 2-tailed, unpaired t test. (C) Immunofluorescence images showing upregulated PSD95 expression in cultured cortical neurons expressing shLamb1 compared with expression of scrambled shRNA (n = 6). Scale bars: 50 μm and 5 μm (enlarged insets). (D and E) Experimental schematic diagram showing virus injection, optical fiber placement in ACC and behavioral test as well as fiber photometry recording during tail suspension test in mice expressing scrambled shRNA and shLamb1 (n = 6–7). Scale bars: 200 μm and 30 μm (enlarged insets) (E). (F and G) Mechanical threshold (F) and immobility duration (G) in the tail suspension test in mice expressing scrambled shRNA or shLamb1 (n = 6–7). **P < 0.01, by 2-tailed, unpaired t test. (HJ) Representative photometric traces (H) as shown in heatmaps (I) and quantitative summary (J) from 5 independent experiments of peak GCaMP6s signals locked to the onset of struggling. In the heatmaps I, each row in the y axis represents GCaMP6s signals from 5 mice of each group. ****P < 0.0001, by Mann-Whitney U test. Data are presented as the mean ± SEM. See Supplemental Table 2 for detailed statistical information.
Figure 9
Figure 9. Intra-ACC injection of pyrintegrin, an integrin β1 activator, relieves established pain hypersensitivity and anxiodepression after SNI.
(A) Bilateral intra-ACC injection of pyrintegrin (Pyr) did not alter mechanical or thermal sensitivity in sham-treated WT mice (n = 8–9). Statistical significance was determined by 2-tailed, unpaired t test (PWMT) and Mann-Whitney U test (PWTL). (BD) Stimulus response curves (B), mechanical threshold (C), and thermal latency (D) showing intra-ACC injection of pyrintegrin (0.1, 1, 10 mM) dose-dependently relieved ipsilateral SNI-induced mechanical allodynia and thermal hyperalgesia (n = 6). *P < 0.05 and **P < 0.01, by Kruskal-Wallis H test with Nemenyi’s multiple-comparison test (PWMT) and 1-way ANOVA with Tukey’s multiple-comparison test (PWTL). (E) ACC delivery of pyrintegrin (1 mM) increased open-arm exploration by SNI-operated mice in the EPM test (n = 8). *P < 0.05, by 2-tailed, unpaired t test. (F and G) Intra-ACC injection of pyrintegrin (1 mM) decreased immobility in the TST (F) and elevated sucrose preference in the SPT (G) in SNI-operated mice (n = 7–8). *P < 0.05 and ****P < 0.0001, by 2-tailed unpaired separate variance estimation t test. Data are presented as the mean ± SEM. See Supplemental Table 2 for detailed statistical information. Veh, vehicle.
Figure 10
Figure 10. Pyrintegrin alleviates neuropathic pain and related aversion via the Src/cofilin signaling pathway.
(AC) Representative immunoblots and quantitative summary showing that SNI-induced decrease in p-Src (A), increase of p-cofilin (B), and PSD95 (C) was reversed by 1 mM intra-ACC pyrintegrin injection (n = 3). *P < 0.05, by Kruskal-Wallis H test with Nemenyi’s multiple-comparison test (p-Src/Src) and 1-way ANOVA with Tukey’s multiple-comparison test (p-cofilin/cofilin and PSD95/flotillin). (D) F-actin staining with phalloidin in cultured cortical neurons transfected with shLamb1 in the absence and presence of 1 μM pyrintegrin (n = 7–8). Scale bars: 50 μm (upper) and 5 μm (lower). ****P < 0.0001, by 2-tailed, unpaired separate variance estimation t test. (E and F) Bath-applied pyrintegrin (20 μM) relieved neuronal hyperexcitability (E) and AMPAR-mediated eEPSCs (F) in SNI-treated ACC pyramidal neurons (n = 11). **P < 0.01 and ****P < 0.0001, by Kruskal-Wallis H test with Nemenyi’s multiple-comparison test. Data are presented as the mean ± SEM. See Supplemental Table 2 for detailed statistical information.
Figure 11
Figure 11. LAMB1 in the ACC is not involved in depression with no pain.
(A and B) Representative trajectory and quantitative summary of distances traveled in the center area in the OFT (A) and in the open arm in the EPM (B) for control and CORT-treated mice (n = 6). *P < 0.05 and **P < 0.01, by 2-tailed, unpaired t test. (C and D) Duration of immobility in the TST (C) and sucrose preference in the SPT (D) paradigm for control and CORT-treated mice (n = 6). *P < 0.05, by 2-tailed, unpaired t test. (E) Immunoblots and quantitative summary showing that LAMB1 expression was not altered in the ACC of CORT-treated mice as compared with the control group (n = 6). Two-tailed, unpaired t test. (F and G) Representative trajectory and quantitative summary of distances traveled in the center area in the OFT (F) and the open arm in the EPM (G) for control and CRS-treated mice (n = 6). *P < 0.05, by 2-tailed, unpaired t test. (H and I) Duration of immobility in the TST (H) and sucrose preference in the SPT (I) paradigm for control and CRS-treated mice (n = 6). **P < 0.01, by 2-tailed, unpaired t test. (J) Immunoblots and quantitative summary showing that LAMB1 expression was unchanged in the ACC in CRS-treated mice as compared with the control group (n = 6–7). Two-tailed unpaired separate variance estimation t test. Data are presented as the mean ± SEM. See Supplemental Table 2 for detailed statistical information.
Figure 12
Figure 12. Pre- and post-synapse model.
Schematic model proposing how LAMB1, a key element of the ECM, conveys extracellular alterations to intracellular structural and functional plasticity and modulates neuropathic pain and pain-related anxiodepression. See the text for details.

Similar articles

Cited by

References

    1. Campbell JN, Meyer RA. Mechanisms of neuropathic pain. Neuron. 2006;52(1):77–92. doi: 10.1016/j.neuron.2006.09.021. - DOI - PMC - PubMed
    1. Bair MJ, et al. Depression and pain comorbidity: a literature review. Arch Intern Med. 2003;163(20):2433–2445. doi: 10.1001/archinte.163.20.2433. - DOI - PubMed
    1. McWilliams LA, et al. Depression and anxiety associated with three pain conditions: results from a nationally representative sample. Pain. 2004;111(1-2):77–83. - PubMed
    1. Simon GE, et al. An international study of the relation between somatic symptoms and depression. N Engl J Med. 1999;341(18):1329–1335. doi: 10.1056/NEJM199910283411801. - DOI - PubMed
    1. Arnow BA, et al. Comorbid depression, chronic pain, and disability in primary care. Psychosom Med. 2006;68(2):262–268. doi: 10.1097/01.psy.0000204851.15499.fc. - DOI - PubMed

Publication types