. 2021 Jun 22;17(6):e1009575.
doi: 10.1371/journal.pgen.1009575. eCollection 2021 Jun.

Causal inference for heritable phenotypic risk factors using heterogeneous genetic instruments

Affiliations

Causal inference for heritable phenotypic risk factors using heterogeneous genetic instruments

Jingshu Wang et al. PLoS Genet. .

Abstract

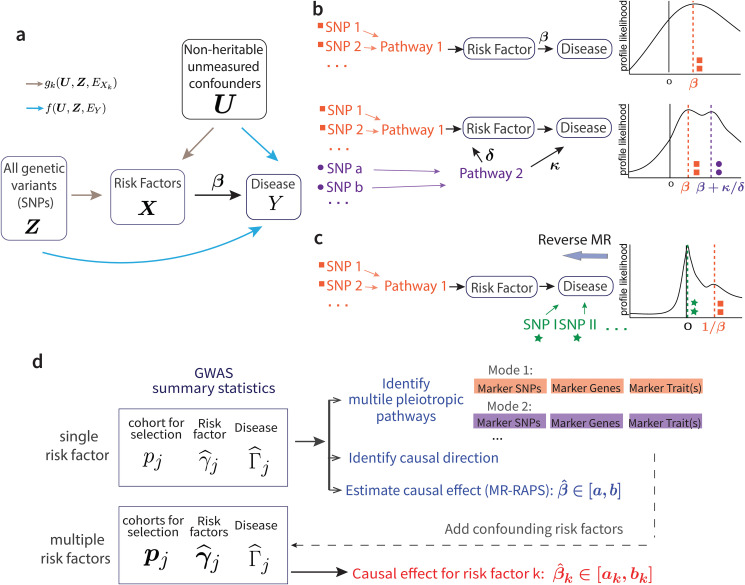
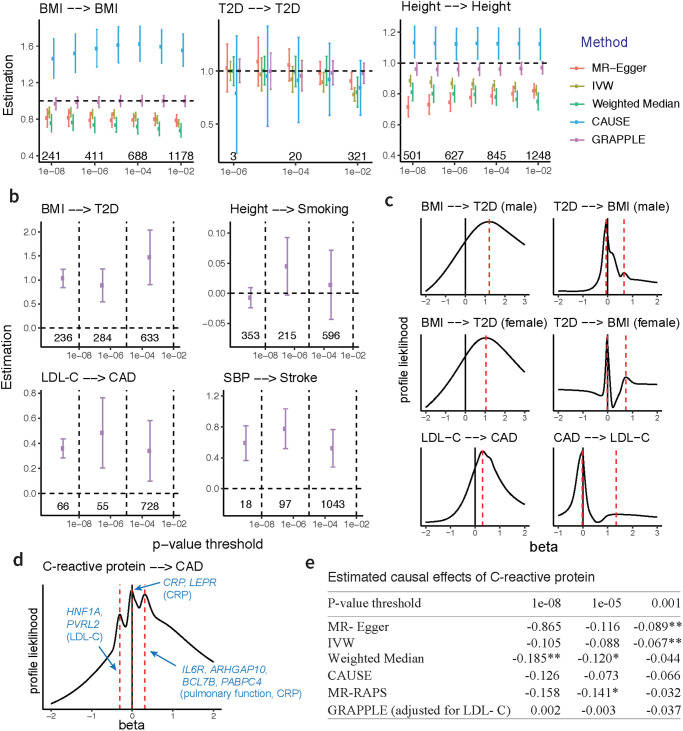
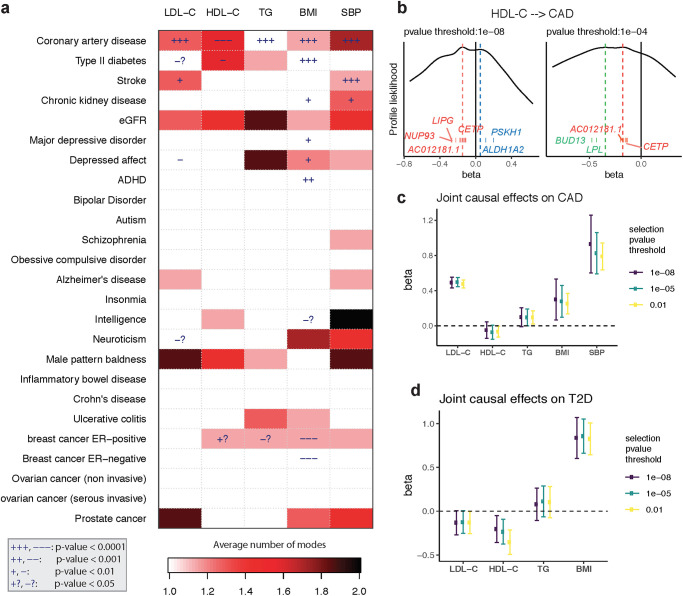
Over a decade of genome-wide association studies (GWAS) have led to the finding of extreme polygenicity of complex traits. The phenomenon that "all genes affect every complex trait" complicates Mendelian Randomization (MR) studies, where natural genetic variations are used as instruments to infer the causal effect of heritable risk factors. We reexamine the assumptions of existing MR methods and show how they need to be clarified to allow for pervasive horizontal pleiotropy and heterogeneous effect sizes. We propose a comprehensive framework GRAPPLE to analyze the causal effect of target risk factors with heterogeneous genetic instruments and identify possible pleiotropic patterns from data. By using GWAS summary statistics, GRAPPLE can efficiently use both strong and weak genetic instruments, detect the existence of multiple pleiotropic pathways, determine the causal direction and perform multivariable MR to adjust for confounding risk factors. With GRAPPLE, we analyze the effect of blood lipids, body mass index, and systolic blood pressure on 25 disease outcomes, gaining new information on their causal relationships and potential pleiotropic pathways involved.


Conflict of interest statement

The authors have declared that no competing interests exist.

Figures

Fig 1
Fig 1. Model overview.
a, The causal directed graph represented by structural equations (1). b, The existence of a pleiotropic pathway 2 (purple) can result in multiple modes of the profile likelihood. c, Multi-modality of the profile likelihood can reflect causal direction. d, The work-flow with GRAPPLE.
Fig 2
Fig 2. Performance evaluation.
a, Estimation of β across selection p-value thresholds under no pleiotropy. Error bars show 95% Confidence intervals and the numbers are the number of independent SNPs obtained at each threshold. b, Estimation of β across three non-overlapping categories of SNPs: “strong”, “moderate” and “weak”. The numbers are the number of SNPs in each category. c, Identifying causal directions by multi-modality with MR reversely performed. The selection p-value threshold is kept at 10−4. d, three modes detected in the profile likelihood with selection p-value threshold 10−4 for CRP on CAD. Marker genes and GWAS traits (in parenthesis) are shown for each mode. e, estimation of the CRP effect β at different p-value selection threshold with each method. The numbers are the estimated β^, with * indicating p-value below 0.05 and ** indicating p-value below 0.01.
Fig 3
Fig 3. Screening with GRAPPLE.
a, Landscape of pleiotropic pathways on 25 diseases. The colors show average number of modes across 7 different selection p-value thresholds. The “+” sign shows a positive estimated effect and “−” indicates a negative estimated effect, with the p-value for each cell a combined p-value (see Materials and methods) of replicability across 7 thresholds using the single risk factor. These p-values are not multiple-testing adjusted across pairs. b, Multi-modality of the profile likelihood for effect of HDL-C on CAD at 2 different selection p-value threshold. Vertical bars are positions of marker SNPs (Γ^j/γ^j), labeled by their mapped genes (only unique gene names are shown). c, Multivariable MR for the effect of 5 risk factors on CAD. d, Multivariable MR for the effect of 4 risk factors on CAD. The Error bars are 95% confidence intervals.

References

    1. Davey Smith G, Ebrahim S. ‘Mendelian randomization’: can genetic epidemiology contribute to understanding environmental determinants of disease? International journal of epidemiology. 2003;32(1):1–22. - PubMed
    1. Davey Smith G, Holmes MV, Davies NM, Ebrahim S. Mendel’s laws, Mendelian randomization and causal inference in observational data: substantive and nomenclatural issues. European Journal of Epidemiology. 2020; p. 1–13. - PMC - PubMed
    1. Davey Smith G, Hemani G. Mendelian randomization: genetic anchors for causal inference in epidemiological studies. Human molecular genetics. 2014;23(R1):R89–R98. doi: 10.1093/hmg/ddu328 - DOI - PMC - PubMed
    1. Ebrahim S, Davey Smith G. Mendelian randomization: can genetic epidemiology help redress the failures of observational epidemiology? Human genetics. 2008;123(1):15–33. doi: 10.1007/s00439-007-0448-6 - DOI - PubMed
    1. Burgess S, Butterworth A, Thompson SG. Mendelian randomization analysis with multiple genetic variants using summarized data. Genetic epidemiology. 2013;37(7):658–665. doi: 10.1002/gepi.21758 - DOI - PMC - PubMed

Publication types