

Sexual dimorphism of the mandibular conformational changes in aging human adults: A multislice computed tomographic study by geometric morphometrics
- PMID: 34157047
- PMCID: PMC8219137
- DOI: 10.1371/journal.pone.0253564
Sexual dimorphism of the mandibular conformational changes in aging human adults: A multislice computed tomographic study by geometric morphometrics
Abstract
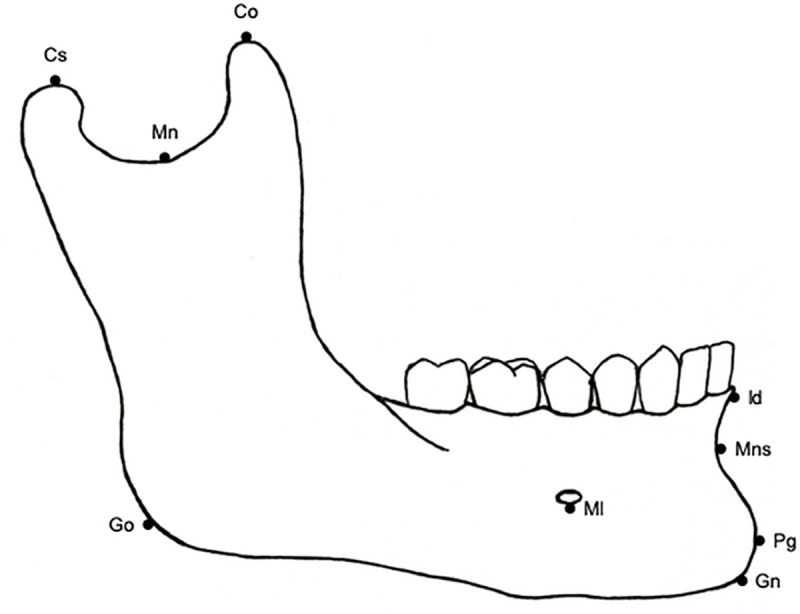
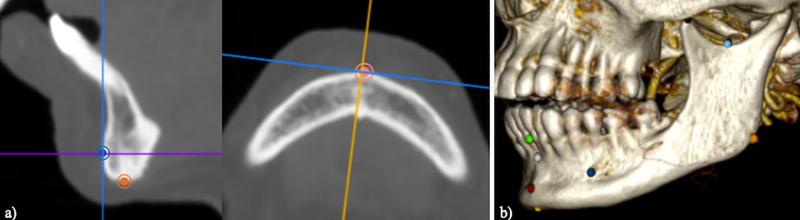
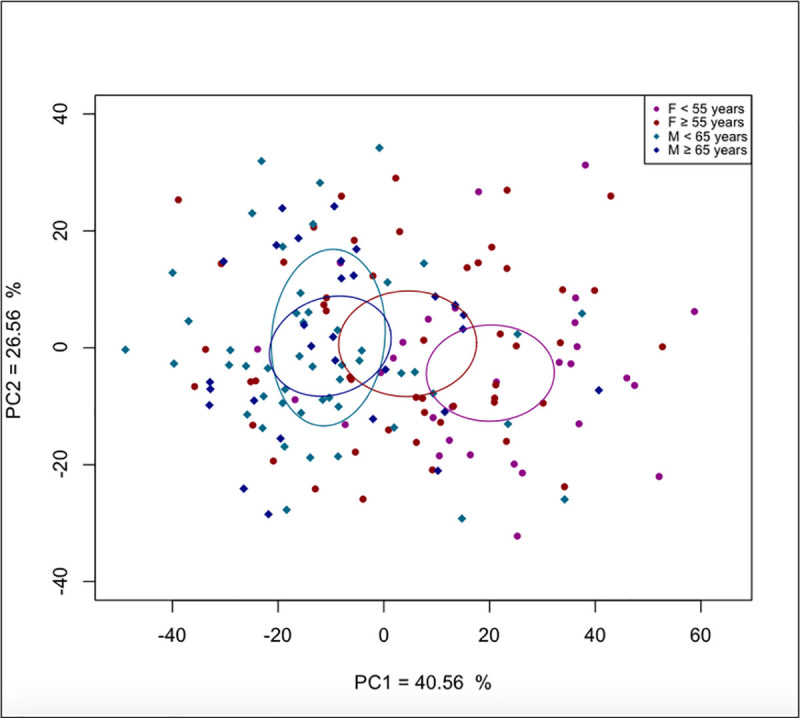
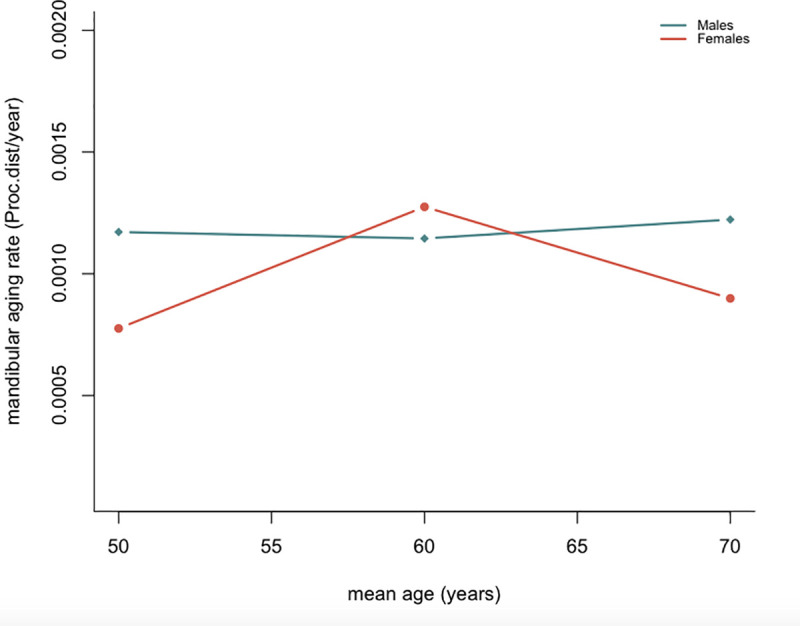
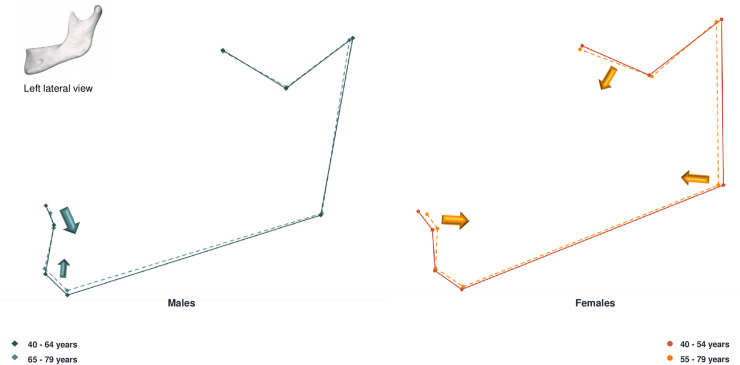
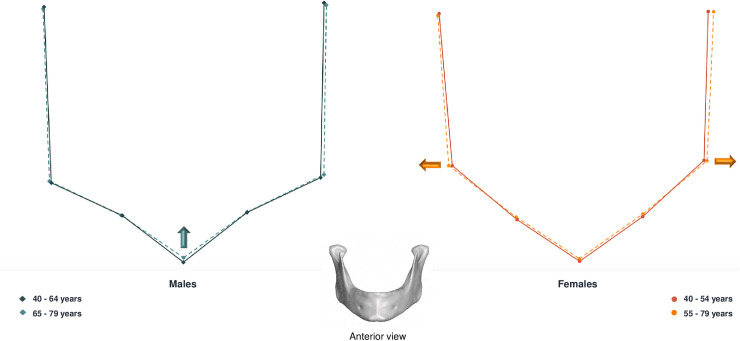
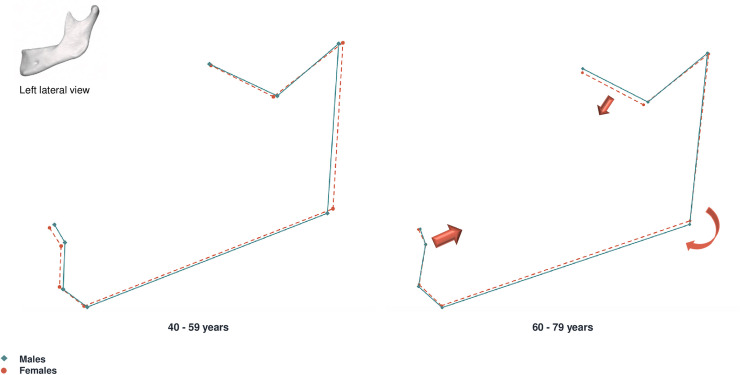
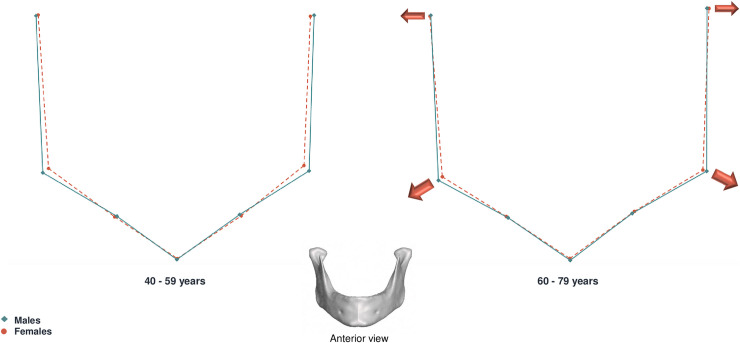
The aging process has an impact on mandibular bone morphology and can therefore affect shape sexual dimorphism. Understanding the effect of senescence on mandibular shape changes is particularly important to correctly estimate the sex of an individual and predict age-related conformational modifications. The purpose of this study was to assess age-related changes in mandibular shape and sexual dimorphism. The study sample comprised 160 Multi Slice Computed Tomography examinations of individuals aged 40 to 79 years. Geometric morphometric analysis of fourteen osteometric landmarks was used to examine sexual dimorphism and patterns of mandibular shape variation with age. Results showed that mandibular sexual dimorphism of shape remained significant with aging. Conformational changes occurred between 50 and 70 years and were different for male and female individuals. Females presented earlier and more marked age-related shape changes than males. These observations suggest that mandibular senescence is a sexually dimorphic process since its onset, rate, and the areas subjected to conformational changes differ from male to female individuals. Senescence-related changes present substantial variability, and further investigation is required to determine precisely the age that marks their onset.
Conflict of interest statement
The authors have declared that no competing interests exist.
Figures
Similar articles
-
Quantification of mandibular sexual dimorphism during adolescence.J Anat. 2019 May;234(5):709-717. doi: 10.1111/joa.12949. Epub 2019 Mar 4. J Anat. 2019. PMID: 30834524 Free PMC article.
-
Variation of mandibular sexual dimorphism across human facial patterns.Homo. 2016 Jun;67(3):188-202. doi: 10.1016/j.jchb.2015.11.004. Epub 2016 Jan 23. Homo. 2016. PMID: 26852041
-
Evaluation of sex dimorphism of the mandible with geometric morphometric analysis: conventional and reconstructed panoramic radiography study.Surg Radiol Anat. 2023 Nov;45(11):1497-1504. doi: 10.1007/s00276-023-03201-z. Epub 2023 Jul 17. Surg Radiol Anat. 2023. PMID: 37460704
-
Genetic and Epigenetic Sexual Dimorphism of Brain Cells during Aging.Brain Sci. 2023 Jan 24;13(2):195. doi: 10.3390/brainsci13020195. Brain Sci. 2023. PMID: 36831738 Free PMC article. Review.
-
Methods in Genetic Analysis for Evaluation Mandibular Shape and Size Variations in Human Mandible.J Craniofac Surg. 2022 Jan-Feb 01;33(1):e97-e101. doi: 10.1097/SCS.0000000000007686. J Craniofac Surg. 2022. PMID: 33867516 Review.
Cited by
-
Shape variation and sex differences of the adult human mandible evaluated by geometric morphometrics.Sci Rep. 2024 Apr 12;14(1):8546. doi: 10.1038/s41598-024-57617-7. Sci Rep. 2024. PMID: 38609399 Free PMC article.
-
Sexual Dimorphism in the Musculoskeletal System: Sex Hormones and Beyond.J Endocr Soc. 2024 Sep 1;8(10):bvae153. doi: 10.1210/jendso/bvae153. eCollection 2024 Aug 27. J Endocr Soc. 2024. PMID: 39309123 Free PMC article. Review.
-
Sex Determination Using Linear Anthropometric Measurements Relative to the Mandibular Reference Plane on CBCT 3D Images.J Imaging. 2025 Jul 5;11(7):224. doi: 10.3390/jimaging11070224. J Imaging. 2025. PMID: 40710611 Free PMC article.
-
How Does the Mandible Age? Comprehensive Artificial Intelligence-Assisted Shape Analysis in the White Population.Plast Reconstr Surg Glob Open. 2025 Apr 21;13(4):e6650. doi: 10.1097/GOX.0000000000006650. eCollection 2025 Apr. Plast Reconstr Surg Glob Open. 2025. PMID: 40264908 Free PMC article.
-
Insight into age-related changes of the human facial skeleton based on medieval European osteological collection.Sci Rep. 2023 Nov 23;13(1):20564. doi: 10.1038/s41598-023-47776-4. Sci Rep. 2023. PMID: 37996537 Free PMC article.
References
-
- Nikita E. Αge-associated Variation and Sexual Dimorphism in Adult Cranial Morphology: Implications in Anthropological Studies. Int J Osteoarchaeol. 2014;24: 557–569. doi: 10.1002/oa.2241 - DOI
MeSH terms
LinkOut - more resources
Full Text Sources
Medical
