. 2021 Jul 21;49(13):7665-7679.
doi: 10.1093/nar/gkab532.

Blasticidin S inhibits mammalian translation and enhances production of protein encoded by nonsense mRNA

Affiliations

Blasticidin S inhibits mammalian translation and enhances production of protein encoded by nonsense mRNA

Kyle T Powers et al. Nucleic Acids Res. .

Abstract

Deciphering translation is of paramount importance for the understanding of many diseases, and antibiotics played a pivotal role in this endeavour. Blasticidin S (BlaS) targets translation by binding to the peptidyl transferase center of the large ribosomal subunit. Using biochemical, structural and cellular approaches, we show here that BlaS inhibits both translation elongation and termination in Mammalia. Bound to mammalian terminating ribosomes, BlaS distorts the 3'CCA tail of the P-site tRNA to a larger extent than previously reported for bacterial ribosomes, thus delaying both, peptide bond formation and peptidyl-tRNA hydrolysis. While BlaS does not inhibit stop codon recognition by the eukaryotic release factor 1 (eRF1), it interferes with eRF1's accommodation into the peptidyl transferase center and subsequent peptide release. In human cells, BlaS inhibits nonsense-mediated mRNA decay and, at subinhibitory concentrations, modulates translation dynamics at premature termination codons leading to enhanced protein production.


Figures

Figure 1.
Figure 1.
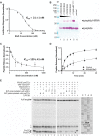
BlaS inhibitory effects on mammalian translation. (A) BlaS’ impact on in vitro translation determined via luciferase activity. Normalized response units are plotted against BlaS concentrations. (B) Immunoblot using anti-FLAG antibody to detect free peptide (lower band) and peptidyl-tRNA (upper band). Translation termination was inhibited by addition of 10μM eRF1AAQ and different BlaS concentrations as indicated. (C) Peptide release of [35S]-methionine labelled 3xFLAG-Sec61β-VHP(Tyr) peptide from the ribosome in the presence of increasing concentrations of BlaS. Addition of BlaS decreases the ratio of free peptide compared to peptidyl-tRNA. (D) Time-dependence of peptide release inhibition by BlaS. The ratio of released peptide versus peptidyl-tRNA is determined in the absence (squares) and presence (dots) of 800 nM BlaS. (E) Left autoradiogram: Toeprinting analysis of ribosomal complexes obtained by incubating preTCs assembled on MVHC-stop mRNA (MVHC-preTCs) with eRF1, eRF3a, GTP and combinations of 5 μg/ml BlaS and 1 mM puromycin at 1 mM free Mg2+. The positions of preTCs, postTCs and full-length cDNA are indicated. Asterisks mark initiation and elongation complexes. Right: Toeprinting analysis of ribosomal complexes obtained by incubating preTCs with UPF3B, eRF1, eRF3a, GTP, and combinations of 5 μg/ml BlaS and 1 mM puromycin. Disappearance of the postTC band indicates dissociation of ribosomal complexes and concomitant release of mRNA, as indicated by more full-length cDNA. The gel on the left was exposed 2× longer than gel on the right. The slightly lower intensity of the postTC toe-print band generated after incubation with puromycin (lanes 4, 6, 8) is likely due to puromycin-treated preTCs being relatively unstable at the low Mg2+ concentrations used (63). Error bars indicate the standard deviation of three replicates.
Figure 2.
Figure 2.
Cryo-EM structures of mammalian termination complexes (TCs) with BlaS. Three major classes were identified in our data. (A) TC-structure with empty A-site and with BlaS and peptidyl-tRNA bound to the P-site (Empty-A, 3.1 Å resolution) representing ∼35% of the particles. (B) Structure with BlaS, empty tRNA in the P/E hybrid state and peptidyl-tRNA in the A/P hybrid state (Hybrid, 3.8 Å resolution) representing ∼11% of the particles. (C) TC-structure with BlaS in the peptidyl transferase center and eRF1/eRF3a in a pre-accommodation state bound to the decoding center of 40S (eRF-Bound, 4.1 Å resolution) representing ∼6% of the particles. In panels A–C, the 60S subunit is depicted in cyan, the 40S in orange, mRNA in red, nascent chain in grey, peptidyl-tRNA in green, empty tRNA in light red, eRF1 in pink, eRF3a in magenta, and BlaS in purple. (D) Close-up view into the peptidyl transferase center in the Empty-A structure. EM density (purple mesh) corresponding to BlaS (purple) bound to 28S rRNA (cyan) and by the 3′ CCA tail of the P-site peptidyl-tRNA (green, nascent chain grey) is shown. Left: same view as in panel A; right: 100° rotated about the Y-axis.
Figure 3.
Figure 3.
BlaS binding to the P-site in the 60S peptidyl transferase center. Contacts formed by BlaS (purple) with 28S rRNA bases in the P-site (cyan) and with the 3′CCA tail of the bound peptidyl-tRNA (green and grey for nascent chain) in the Empty-A structure (A), the Hybrid structure (B) and the eRF-Bound structure (C). Hydrogen bonds are shown by black dashed lines, van der Waals contacts are shown by grey dotted lines. (D) The relative positions and orientations of bound BlaS in these three structures are overlaid with BlaS colored magenta in the Empty-A structure, pink in the Hybrid structure, and light pink in the eRF-Bound structure.
Figure 4.
Figure 4.
Mis-positioning of the peptidyl-tRNA 3′CCA tail in the presence of BlaS. (A) Overlay of BlaS-bound P-site tRNA in the Empty-A structure (light green, BlaS purple) and P-site tRNA in a normal (not BlaS-bound) mammalian ribosomal termination complex (dark green) (PDBID: 3JAH, (23)). Arrows indicate displacement of the 3′CCA bases. (B) Overlay of BlaS-bound P-site tRNA in the Empty-A structure (light green, BlaS purple) and of an elongating Thermus thermophilus 70S ribosomal complex with acylated A-site (pink) and P-site tRNAs (grey) (PDBID: 4V5D, (44)). Minor steric clashes are indicated by yellow stars. (C) Comparison of BlaS-bound P-site tRNA in the Empty-A structure (light green, BlaS purple) with the structure of the mammalian termination complex with eRF1 accommodated in the A-site (PDBID: 5LZU, (27)). The P-site tRNA in the termination complex was omitted for clarity. Severe steric clashes are indicated in orange. (D) Comparison of BlaS-bound bound P-site tRNA in the Empty-A structure (light green, BlaS magenta) with the crystal structure of Th. thermophilus 70S ribosome-tRNA complex (dark red) bound to Blas (pink) (PDBID: 4V9Q, (3)) showing differences in BlaS binding to bacterial and eukaryotic ribosomal complexes. These result in larger distortion of the tRNA 3′CCA tail in the mammalian complex. The structures were aligned for the 28S (23S in panel D) rRNA residues (not shown for clarity).
Figure 5.
Figure 5.
Quantification of Renilla-HBB reporter mRNA levels and associated luciferase activity in transfected HeLa cells after incubation with different concentrations of BlaS. (A) qRT-PCR analysis of the Renilla-HBB wildtype reporter mRNA (left) and of the Renilla HBB NS39 reporter mRNA (right), following treatment with indicated BlaS concentrations. The levels of reporter mRNA are shown as percentage of Renilla-HBB WT mRNA not treated with BlaS (0 μg/ml BlaS), with the SD of three or more independent experiments. Co-expressed Firefly luciferase mRNA levels were used to normalize the levels ofRenilla-HBB mRNA. (B) Reporter luciferase activity following treatment with indicated BlaS concentrations, normalized to wildtype Renilla luciferase-HBB activity not treated with BlaS (0 μg/ml BlaS), with the SD of three or more independent experiments. (C) Reporter luciferase activity following treatment of transfected cells with two indicated concentrations of BlaS and sucrose cushion centrifugation. Left: supernatant fraction, right: ribosomal pellet fraction. Luciferase activity of the Renilla-HBB WT reporter is shown in grey; luciferase activity of the Renilla-HBB NS39 reporter in black. The activity of Renilla-HBB reporter protein is normalized to Renilla-HBB WT protein sample not treated with BlaS (0 μg/ml BlaS), with the SD of three or more independent experiments. One-way ANOVA’s (Holm-Šidák) statistical significance tests (α = 0.05) are indicated with asterisks identifying those with a P value 0.01 < Pformula image 0.05 having one, 0.001 < Pformula image 0.01 having two, and three for Pformula image 0.001. Panel A denoting mRNA and panel B for associated luciferase measurements had 3 measurements per triplicate resulting in degrees of freedom (DF) of 47. Panel B denoting luciferase measurements from sucrose cushions had 7 measurements per triplicate yielding DF = 62. Normality of distributions was assessed via Shapiro Wilk tests for each panel with P = 0.058 and P = 0.180, P = 0.671 and P = 0.783, P = 0.073 and P = 0.077 for mRNA, luciferase, and sucrose-luciferase right and left panels, respectively.

Similar articles

Cited by

References

    1. Wilson D.N. Ribosome-targeting antibiotics and mechanisms of bacterial resistance. Nat. Rev. Microbiol. 2014; 12:35–48. - PubMed
    1. Lin J., Zhou D., Steitz T.A., Polikanov Y.S., Gagnon M.G.. Ribosome-targeting antibiotics: modes of action, mechanisms of resistance, and implications for drug design. Annu. Rev. Biochem. 2018; 87:451–478. - PMC - PubMed
    1. Svidritskiy E., Ling C., Ermolenko D.N., Korostelev A.A.. Blasticidin S inhibits translation by trapping deformed tRNA on the ribosome. Proc. Natl. Acad. Sci. U.S.A. 2013; 110:12283–12288. - PMC - PubMed
    1. Yamaguchi H., Tanaka N.. Inhibition of protein synthesis by blasticidin S. II. Studies on the site of action in E. coli polypeptide synthesizing systems. J. Biochem. 1966; 60:632–642. - PubMed
    1. Yamaguchi H., Yamamoto C., Tanaka N.. Inhibition of protein synthesis by blasticidin S. I. Studies with cell-free systems from bacterial and mammalian cells. J. Biochem. 1965; 57:667–677. - PubMed

Publication types

MeSH terms