. 2021 Nov;74(5):2652-2669.
doi: 10.1002/hep.32023. Epub 2021 Sep 27.

Immunomodulatory Effects of Lenvatinib Plus Anti-Programmed Cell Death Protein 1 in Mice and Rationale for Patient Enrichment in Hepatocellular Carcinoma

Affiliations

Immunomodulatory Effects of Lenvatinib Plus Anti-Programmed Cell Death Protein 1 in Mice and Rationale for Patient Enrichment in Hepatocellular Carcinoma

Laura Torrens et al. Hepatology. 2021 Nov.

Abstract

Background and aims: Lenvatinib is an effective drug in advanced HCC. Its combination with the anti-PD1 (programmed cell death protein 1) immune checkpoint inhibitor, pembrolizumab, has generated encouraging results in phase Ib and is currently being tested in phase III trials. Here, we aimed to explore the molecular and immunomodulatory effects of lenvatinib alone or in combination with anti-PD1.

Approach and results: We generated three syngeneic models of HCC in C57BL/6J mice (subcutaneous and orthotopic) and randomized animals to receive placebo, lenvatinib, anti-PD1, or combination treatment. Flow cytometry, transcriptomic, and immunohistochemistry analyses were performed in tumor and blood samples. A gene signature, capturing molecular features associated with the combination therapy, was used to identify a subset of candidates in a cohort of 228 HCC patients who might respond beyond what is expected for monotherapies. In mice, the combination treatment resulted in tumor regression and shorter time to response compared to monotherapies (P < 0.001). Single-agent anti-PD1 induced dendritic and T-cell infiltrates, and lenvatinib reduced the regulatory T cell (Treg) proportion. However, only the combination treatment significantly inhibited immune suppressive signaling, which was associated with the TGFß pathway and induced an immune-active microenvironment (P < 0.05 vs. other therapies). Based on immune-related genomic profiles in human HCC, 22% of patients were identified as potential responders beyond single-agent therapies, with tumors characterized by Treg cell infiltrates, low inflammatory signaling, and VEGFR pathway activation.

Conclusions: Lenvatinib plus anti-PD1 exerted unique immunomodulatory effects through activation of immune pathways, reduction of Treg cell infiltrate, and inhibition of TGFß signaling. A gene signature enabled the identification of ~20% of human HCCs that, although nonresponding to single agents, could benefit from the proposed combination.


Conflict of interest statement

Dr. Leslie owns stock in Fibrofind. Dr. Llovet consults for and received grants from Bayer, Eisai, Boehringer Ingelheim, Bristol-Myers Squibb, and Ipsen. He consults for Celsion, Eli Lilly, Merck, Roche, Genentech, Glycotest, Nucleix, Can-Fite, Sirtex, AstraZeneca, and Mina Alpha. Dr. Friedman consults for, received grants from, and owns stock in Morphic Therapeutics and Galmed. He consults for and owns stock in Blade, Escient, Glympse, North Sea, Scholar Rock, and Surrozen. He consults for 89 Bio, Amgen, Axcella, Bristol-Myers Squibb, Can-Fite, ChemomAb, Forbion, Gordion, Glycotest, In sitro, Novartis, Ono, and Pfizer. He received grants from Novo Nordisk and Abalone. He owns stock in Galectin, Genfit, Lifemax, Metacrine, Nimbus, Intercept, Madrigal, and Group K. Dr. Mann is employed by and owns stock in Fibrofind. He received grants from GlaxoSmithKline.

Figures
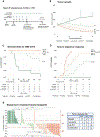
FIG. 1.
FIG. 1.
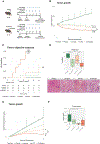
Antitumoral effect of lenvatinib plus anti-PD1 in the Hepa1-6 model. (A) Timeline of the study. (B) Tumor growth, (C) survival, and (D) time to objective response of treated mice. (E) Response to treatment at early time point (n = 59). Upper part indicates differences in progressive disease rate, and lower part the differences in objective response rate. Right table shows the number of mice per group and response. *P < 0.05; **P < 0.01; ***P < 0.001 versus placebo (unless indicated); #P < 0.05; ##P < 0.01; ###P < 0.001 versus lenvatinib. Abbreviations: Cum, cumulative; OR, objective response; PD, progressive disease; SD, stable disease.
FIG. 2.
FIG. 2.
Antitumoral effect of lenvatinib plus anti-PD1 in the subcutaneous and orthotopic Hep53.4 models. (A) Timeline of the subcutaneous and orthotopic studies. (B) Tumor growth and (C) time to objective response of treated mice from the subcutaneous model. (D) Tumor viability assessed in H&E slides from the subcutaneous model. Representative images captured at 20×. (E) Tumor growth in the orthotopic model, measured as changes in bioluminescence compared to the start of the treatment. (F) Tumor volume measured ex vivo in liver samples. Box plots indicate median and quartiles. *P < 0.05; **P < 0.01; ***P < 0.001 versus placebo (unless indicated); #P < 0.05; ##P < 0.01; ###P < 0.001 versus lenvatinib; +++P < 0.001 versus anti-PD1. Abbreviations: FC, fold change; OR, objective response; SC, subcutaneous.
FIG. 3.
FIG. 3.
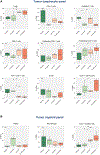
Immune cell populations in tumor samples detected by flow cytometry analysis. (A) Lymphoid and (B) myeloid immune cell populations from tumor samples collected at the early time point. Results for each treatment arm are shown (n = 5 samples per arm). Box plots indicate median and quartiles. *P < 0.05; **P < 0.01. Abbreviations: MDSC, myeloid-derived suppressor cells; Treg, regulatory T cell.
FIG. 4.
FIG. 4.
Histological analysis of Treg tumor infiltrate in the Hep53.4 subcutaneous model. (A) Percentage of positive cells for FOXP3 staining in tumor samples from treated animals. (B) Percentage of samples with intratumoral or peripheral FOXP3 staining. (C) Representative images of FOXP3 staining captured with 40× magnification. Box plots indicate median and quartiles. *P < 0.05; **P < 0.01; ***P < 0.001.
FIG. 5.
FIG. 5.
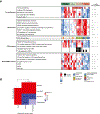
Gene expression profile of treated tumors. (A) Transcriptomic and immunological profile of tumors from each treatment arm. (B) Subclass mapping analysis showing the transcriptomic similarity between tumors from each treatment arm and human HCC classified according to the HCC immune class. *P < 0.05; **P < 0.01; ***P < 0.001. Abbreviations: C, combination; GO, Gene Ontology; KEGG, Kyoto Encyclopedia of Genes and Genomes; L, lenvatinib; NA, not available; P, placebo; PD1, anti-PD1.
FIG. 6.
FIG. 6.
Characterization of tumor composition based on gene expression data. (A) Tumor composition assessed by ESTIMATE analysis or ssGSEA capturing distinct cell populations. (B) Immune score and estimated tumor purity in tumors from each treatment arm measured by ESTIMATE analysis. Box plots indicate median and quartiles. (C) Summary of the molecular and immunological effects of lenvatinib, anti-PD1, and combination treatment on the tumor. *P < 0.05; **P < 0.01; ***P < 0.001. Abbreviations: C, combination; ESTIMATE, estimation of stromal and immune cells in malignant tumor tissues using expression data; iDC, immature dendritic cell; L, lenvatinib; NK, natural killer; P, placebo; PD1; anti-PD1; ssGSEA, single-sample gene set enrichment analysis; Th, T helper, Treg, regulatory T cell.
FIG. 7.
FIG. 7.
Identification of HCC human tumors expressing the combination rescue signature. (A) Transcriptomic profile of HCC samples classified as HCC immune class (potential responders to ICIs)(15) or combination-only responder class. P values reflect the comparison of the combination-only responder class (green) and nonimmune tumors (white). (B) Estimated proportion of immune cells (CIBERSORT) in human tumors classified according to its potential response to therapies. Box plots indicate median and quartiles. *P < 0.05; **P < 0.01; ***P < 0.001. Abbreviations: GO, Gene Ontolog; ICI, immune checkpoint inhibitors; KEGG, Kyoto Encyclopedia of Genes and Genomes; NA, not available.
FIG. 8.
FIG. 8.
HCC classification according to its immunological features and potential response to the combination therapy. Diagram summarizing the HCC immune classification and potential response to ICIs or combination treatment beyond single agents according to the combination rescue signature. Percentage of HCCs belonging to each class is shown in brackets. Abbreviations: ICI, Immune checkpoint inhibitors; Treg, regulatory T cell.

References

    1. Sung H, Ferlay J, Siegel RL, Laversanne M, Soerjomataram I, Jemal A, et al. Global cancer statistics 2020: GLOBOCAN estimates of incidence and mortality worldwide for 36 cancers in 185 countries. CA Cancer J Clin 2021;71:209–249. - PubMed
    1. Llovet JM, Kelley RK, Villanueva A, Singal AG, Pikarsky E, Roayaie S, et al. Hepatocellular carcinoma. Nat Rev Dis Primers 2021;7:6. - PubMed
    1. Llovet JM, Ricci S, Mazzaferro V, Hilgard P, Gane E, Blanc JF, et al. Sorafenib in advanced hepatocellular carcinoma. N Engl J Med 2008;359:378–390. - PubMed
    1. Cheng AL, Finn RS, Qin S, Han KH, Ikeda K, Piscaglia F, et al. Phase III trial of lenvatinib (LEN) vs sorafenib (SOR) in first-line treatment of patients (pts) with unresectable hepatocellular carcinoma (uHCC). J Clin Oncol 2017;35(Suppl.):Abstract 4001.
    1. Finn RS, Qin S, Ikeda M, Galle PR, Ducreux M, Kim TY, et al. Atezolizumab plus bevacizumab in unresectable hepatocellular carcinoma. N Engl J Med 2020;382:1894–1905. - PubMed

Publication types

MeSH terms