. 2021 Oct;69(10):2429-2446.
doi: 10.1002/glia.24049. Epub 2021 Jun 22.

Mek/ERK1/2-MAPK and PI3K/Akt/mTOR signaling plays both independent and cooperative roles in Schwann cell differentiation, myelination and dysmyelination

Affiliations

Mek/ERK1/2-MAPK and PI3K/Akt/mTOR signaling plays both independent and cooperative roles in Schwann cell differentiation, myelination and dysmyelination

Akihiro Ishii et al. Glia. 2021 Oct.

Abstract

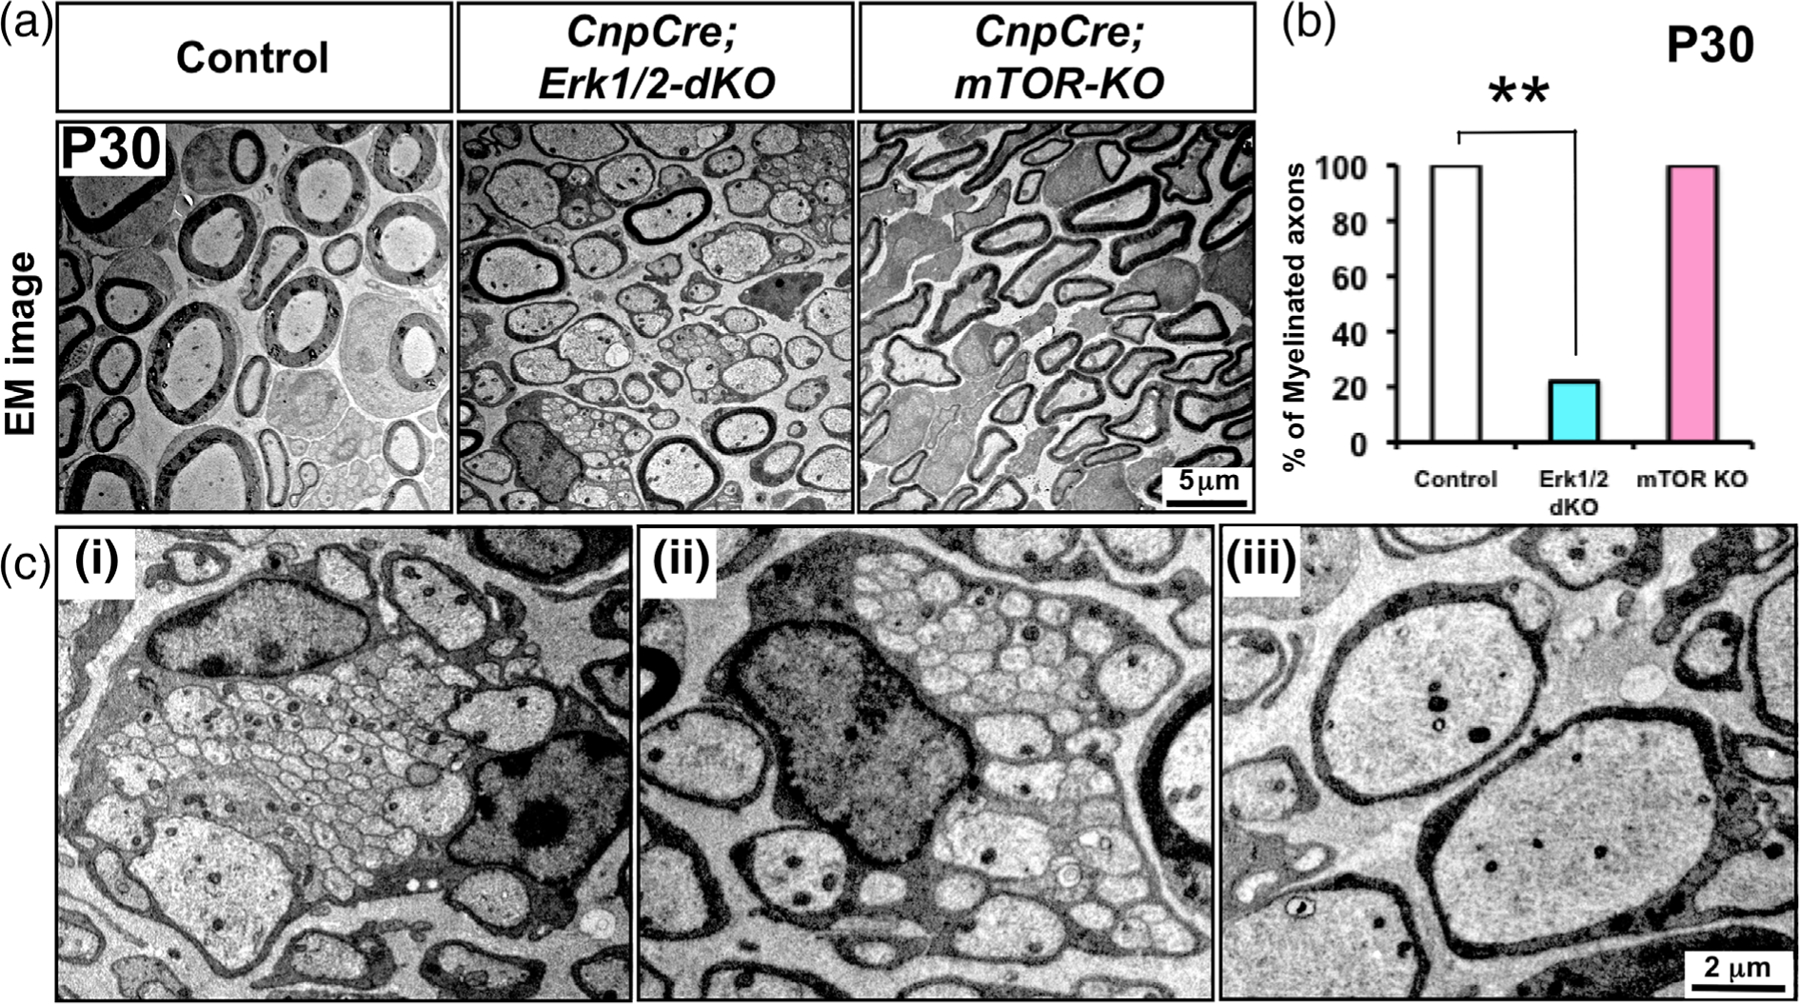
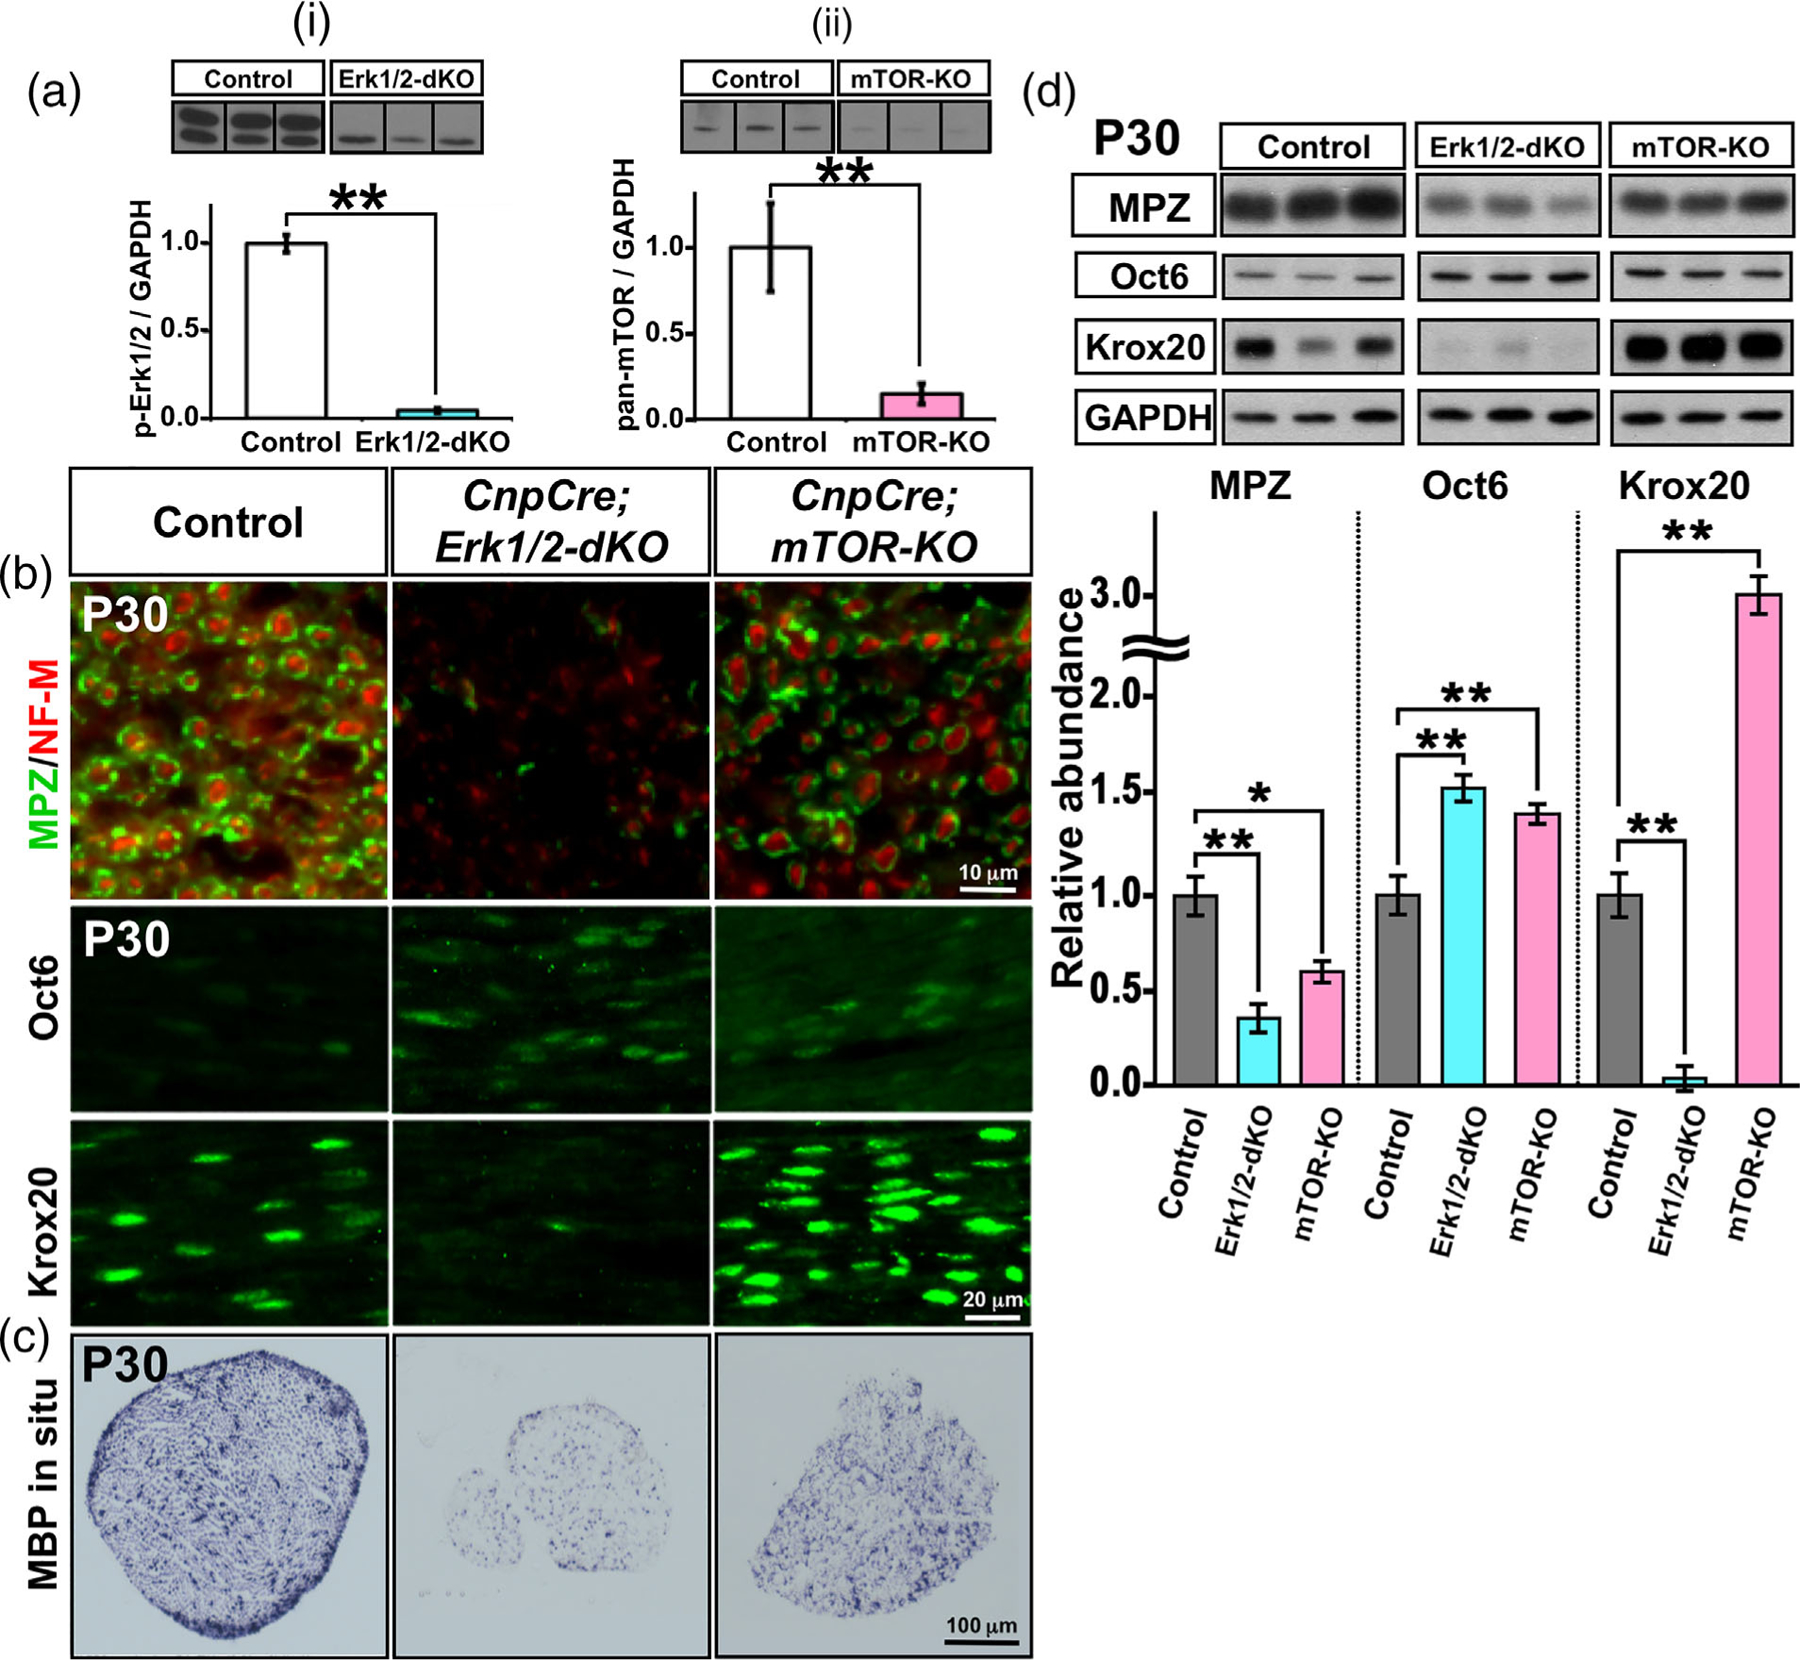
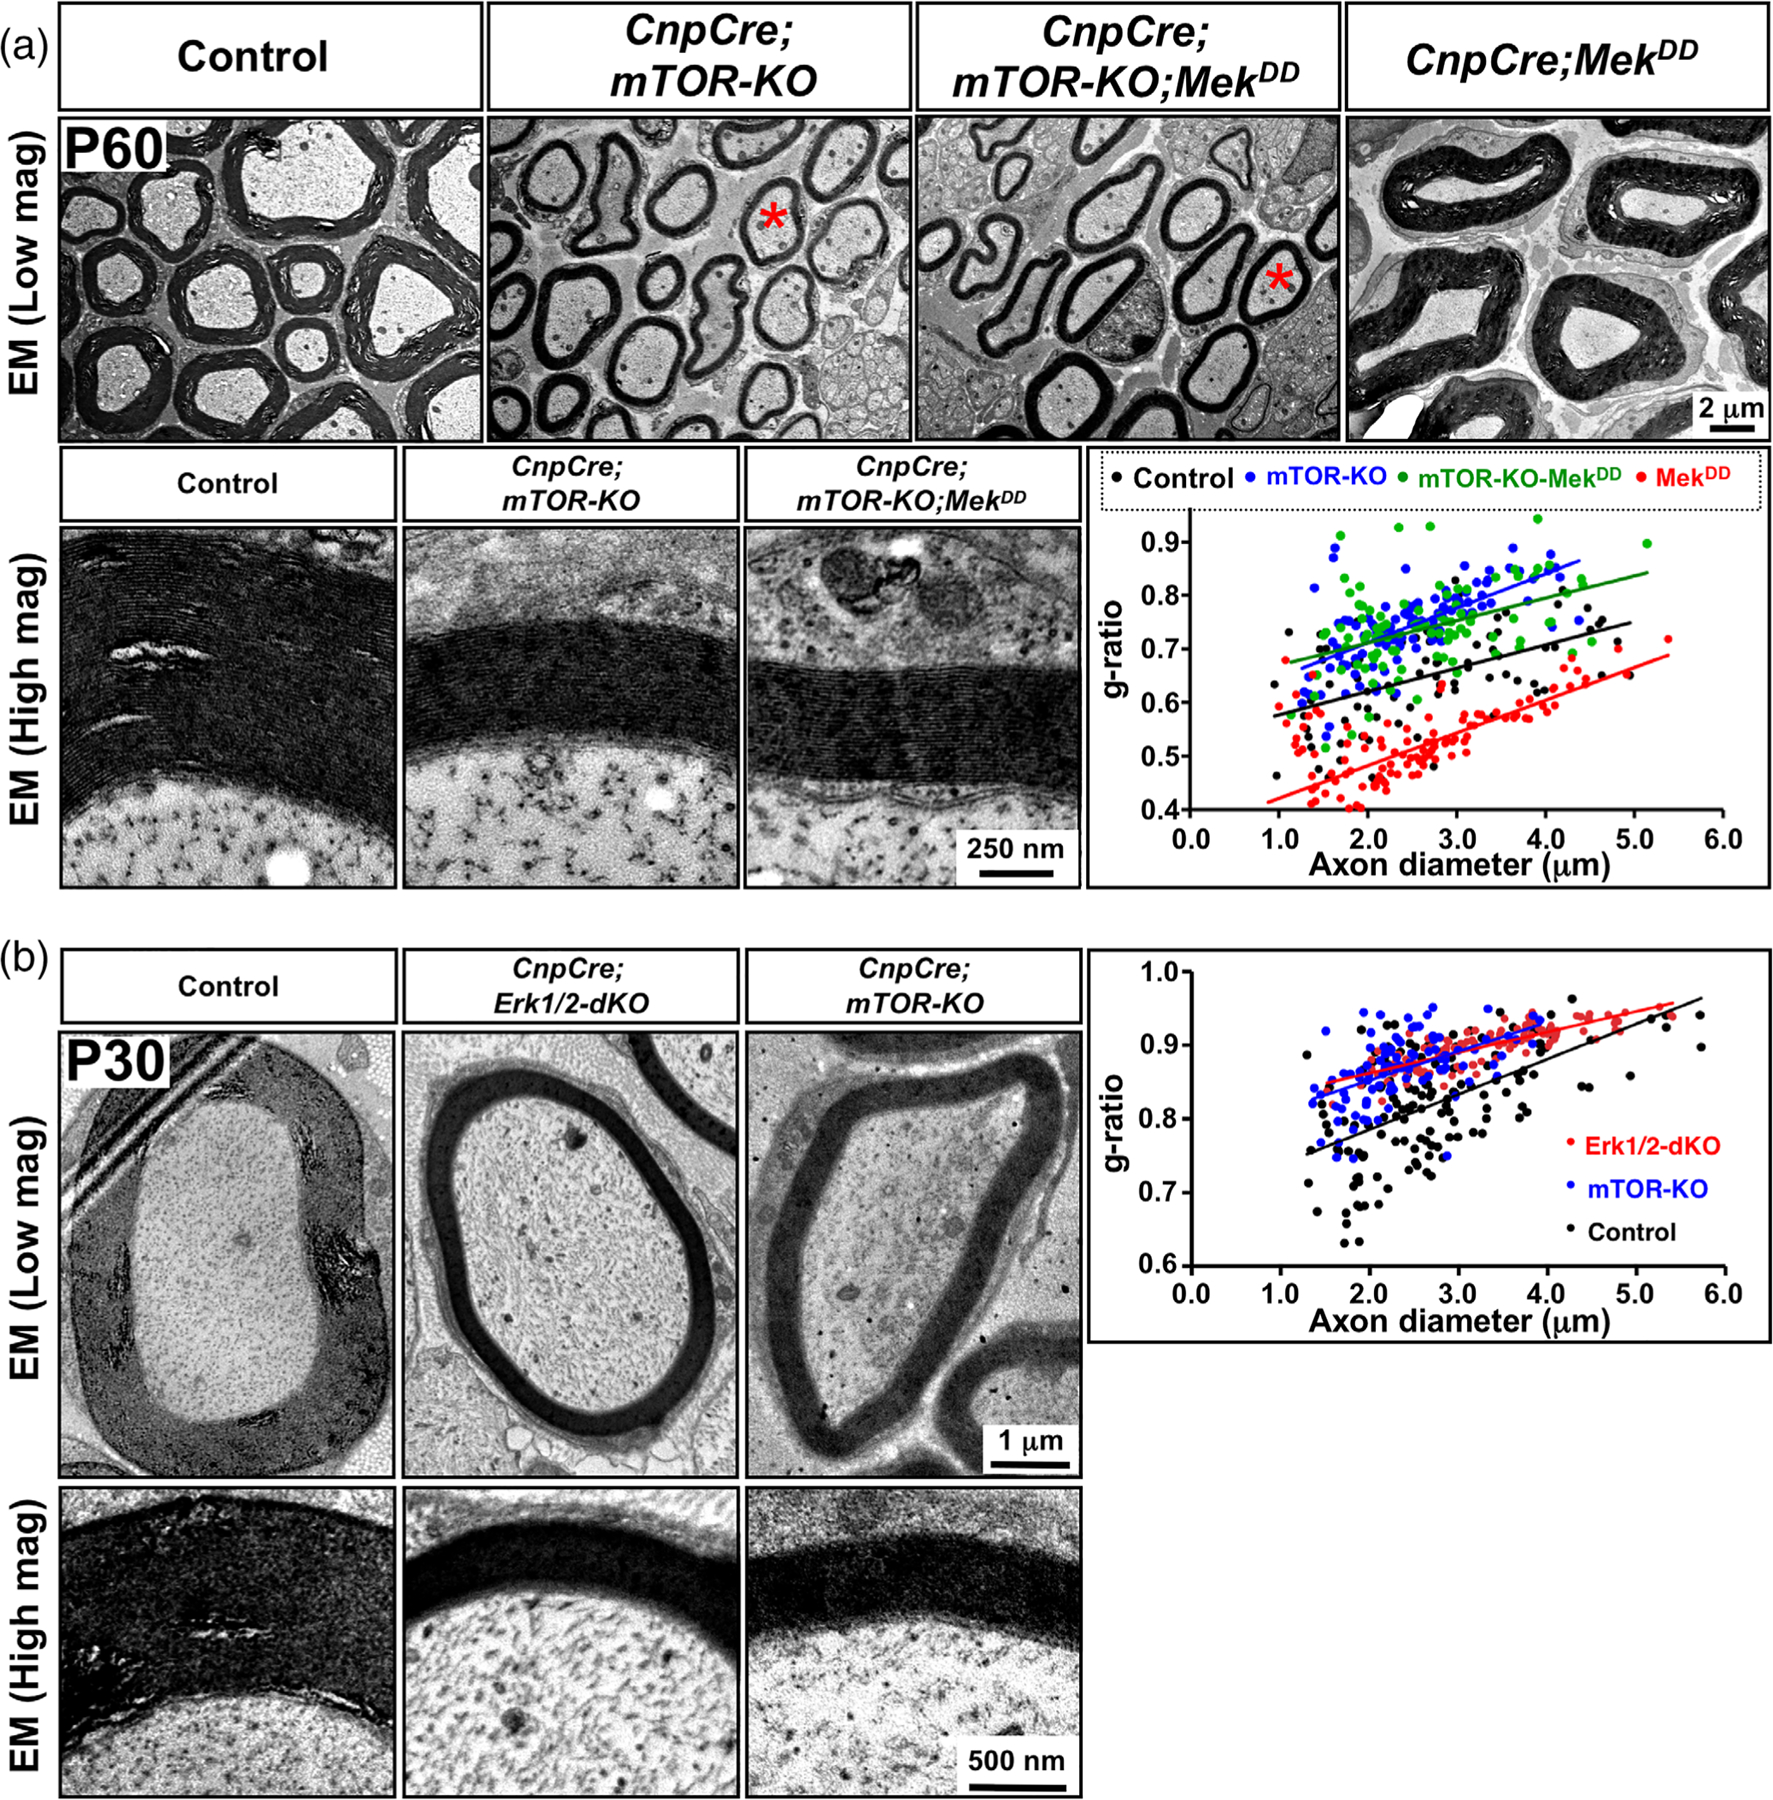
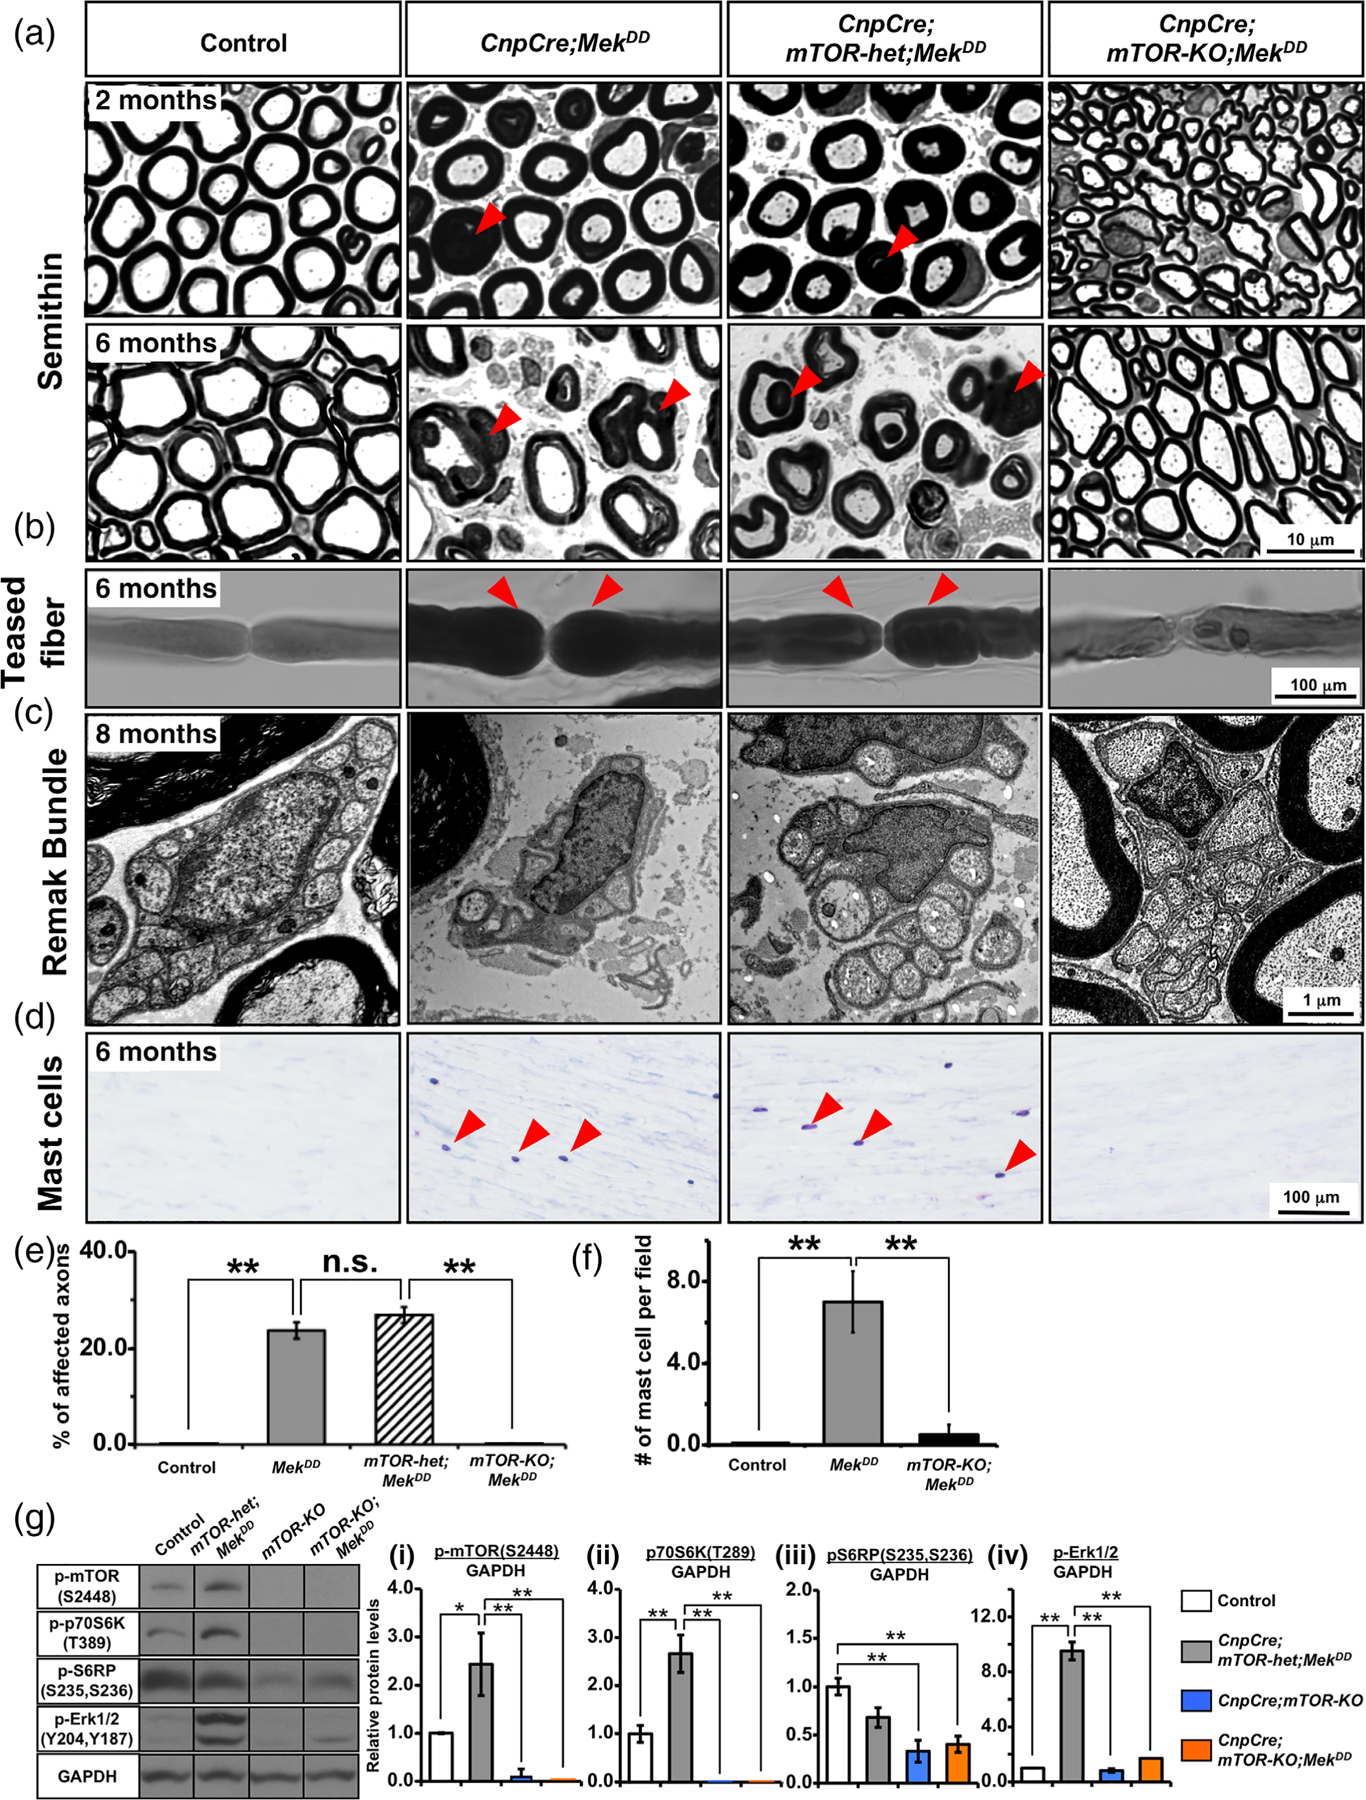
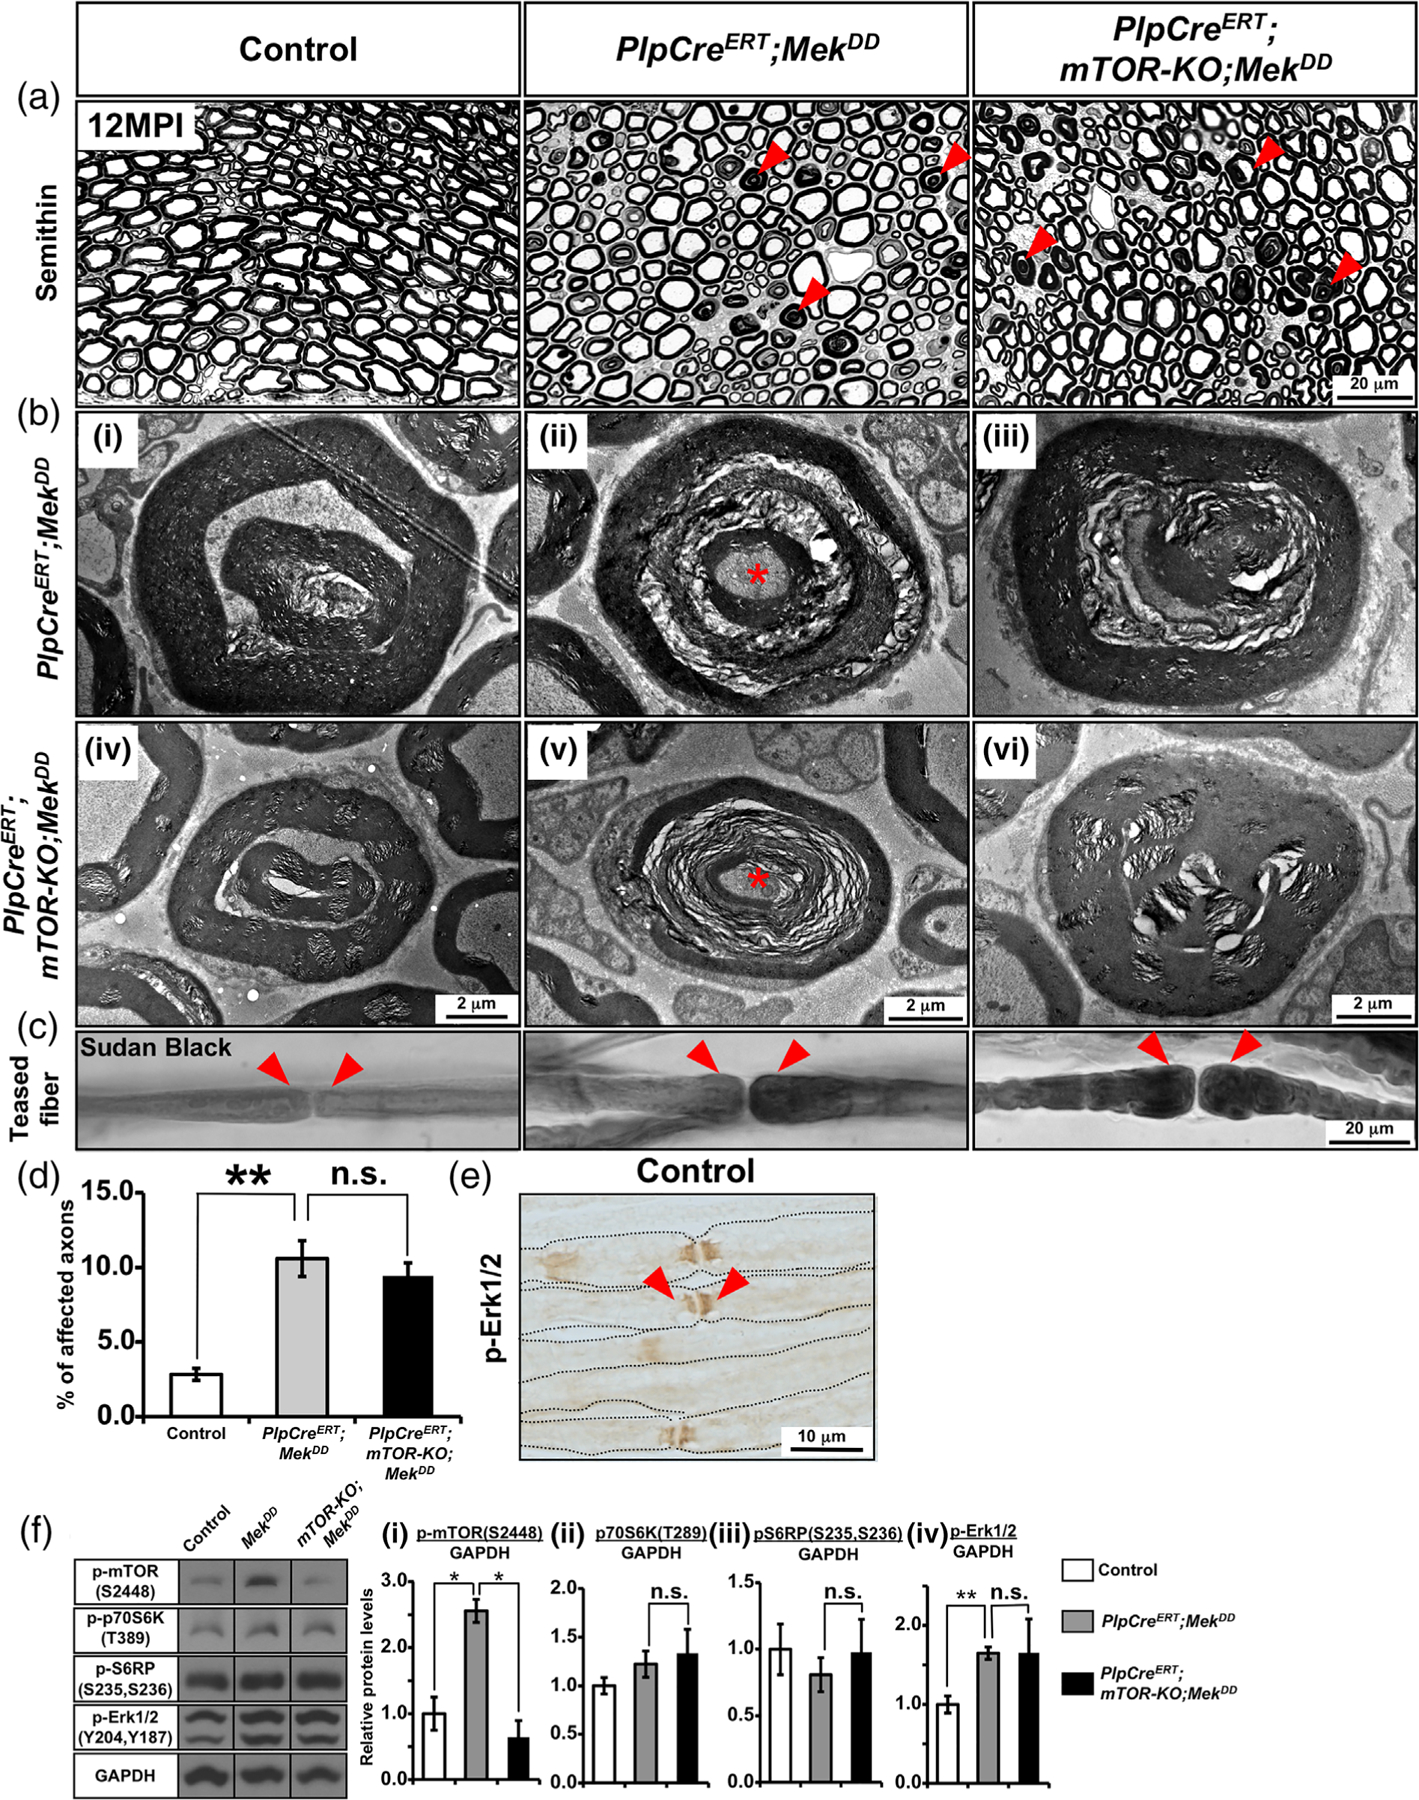
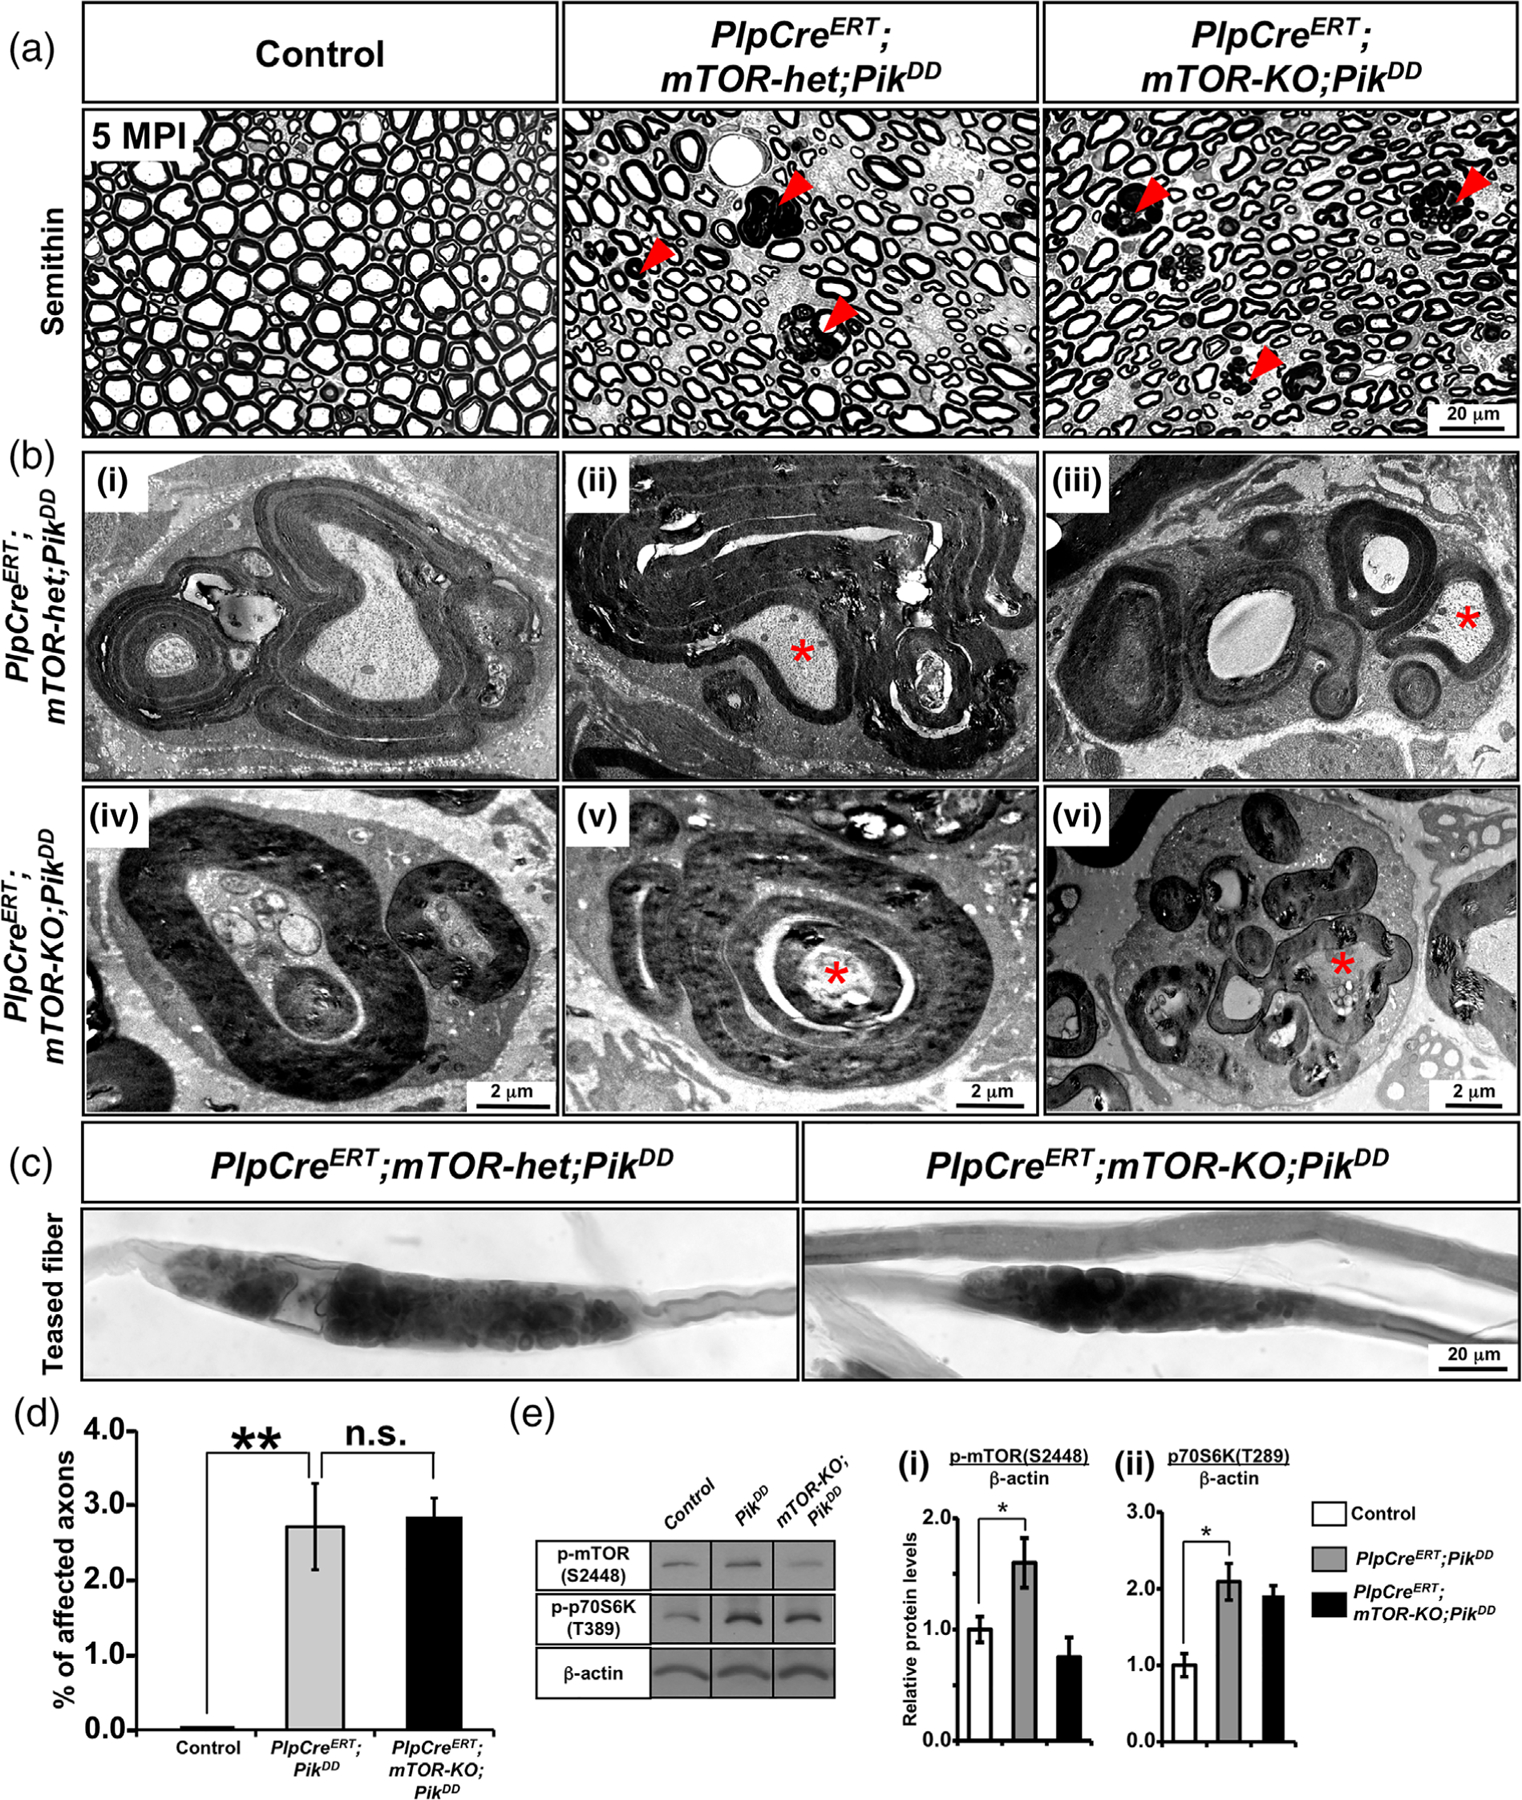
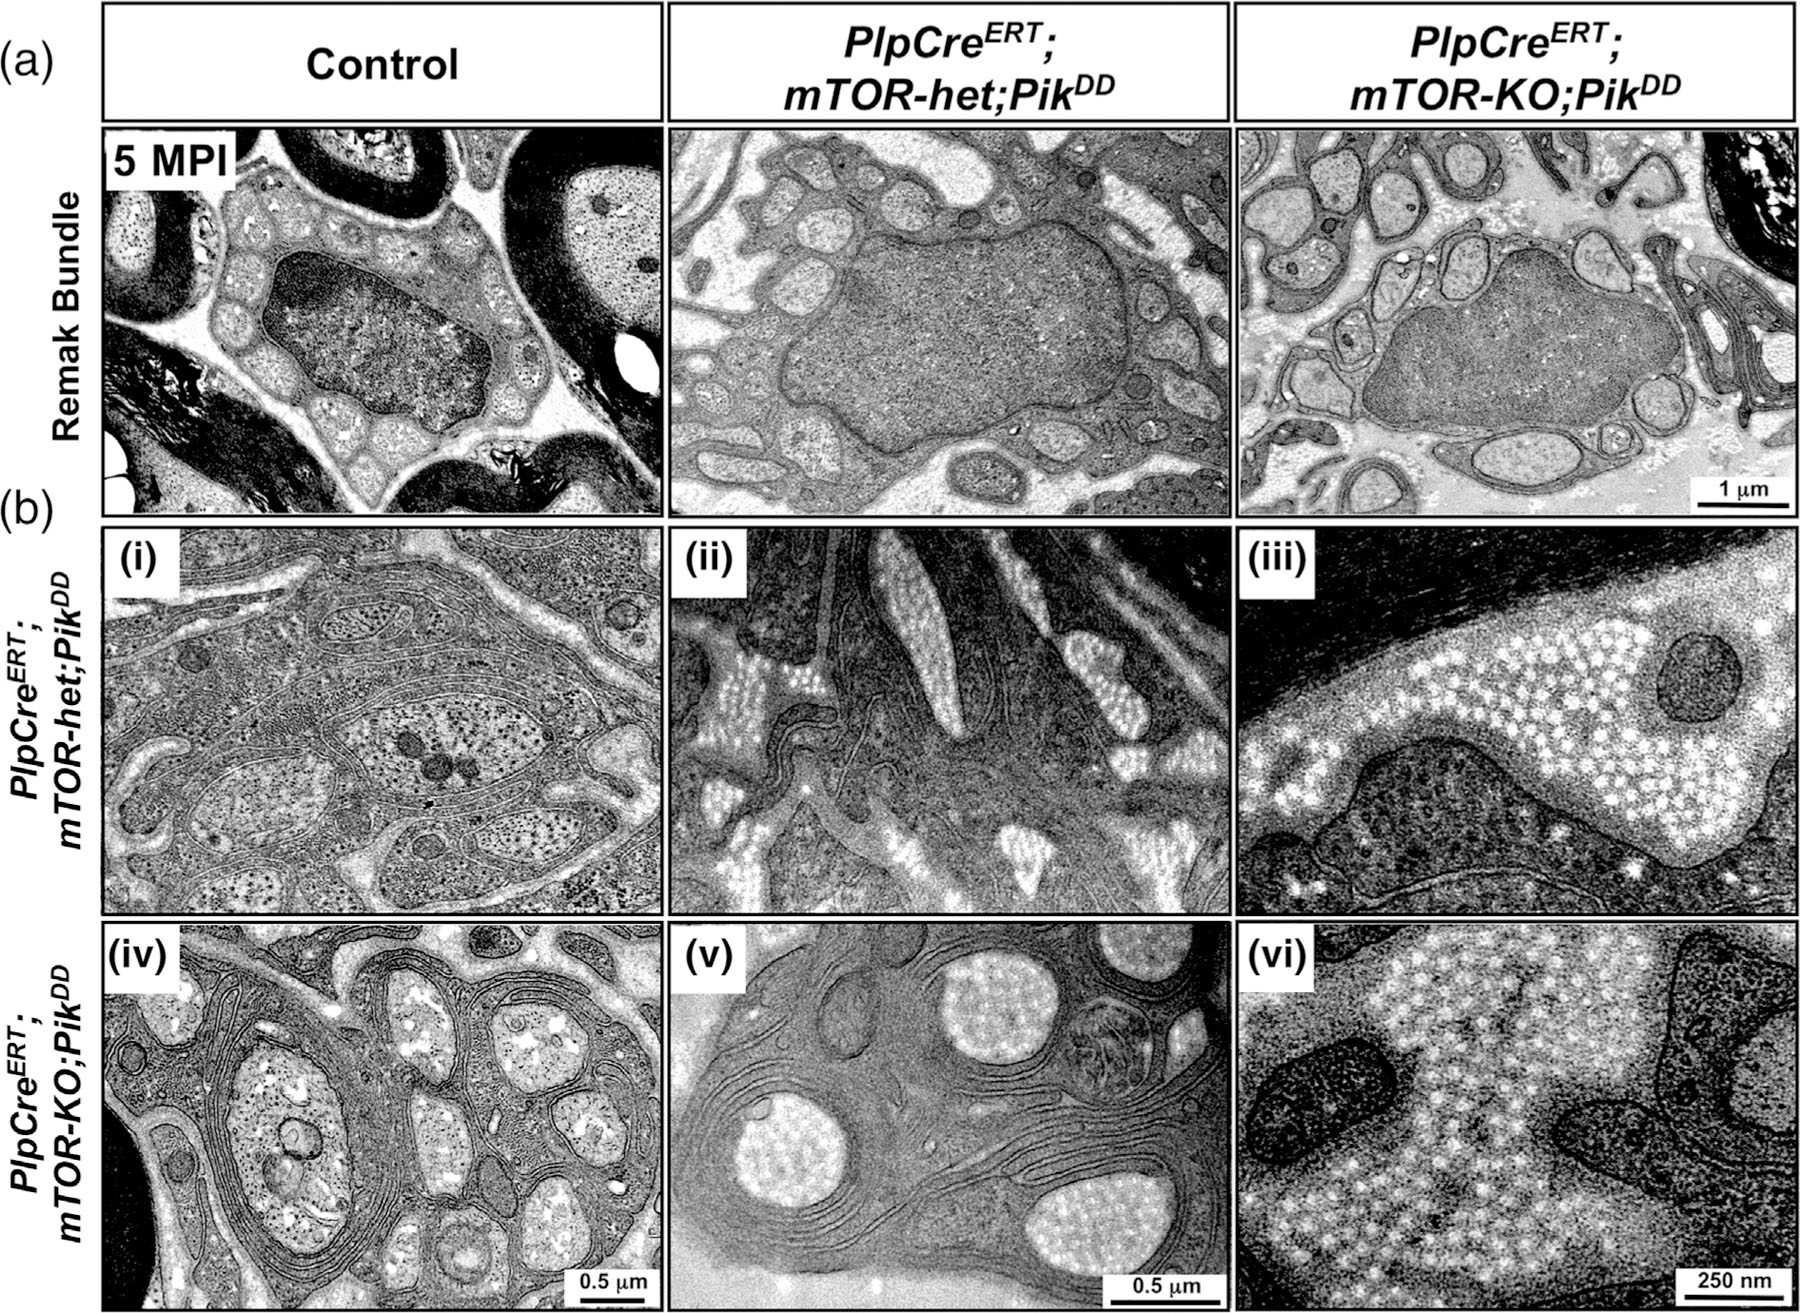
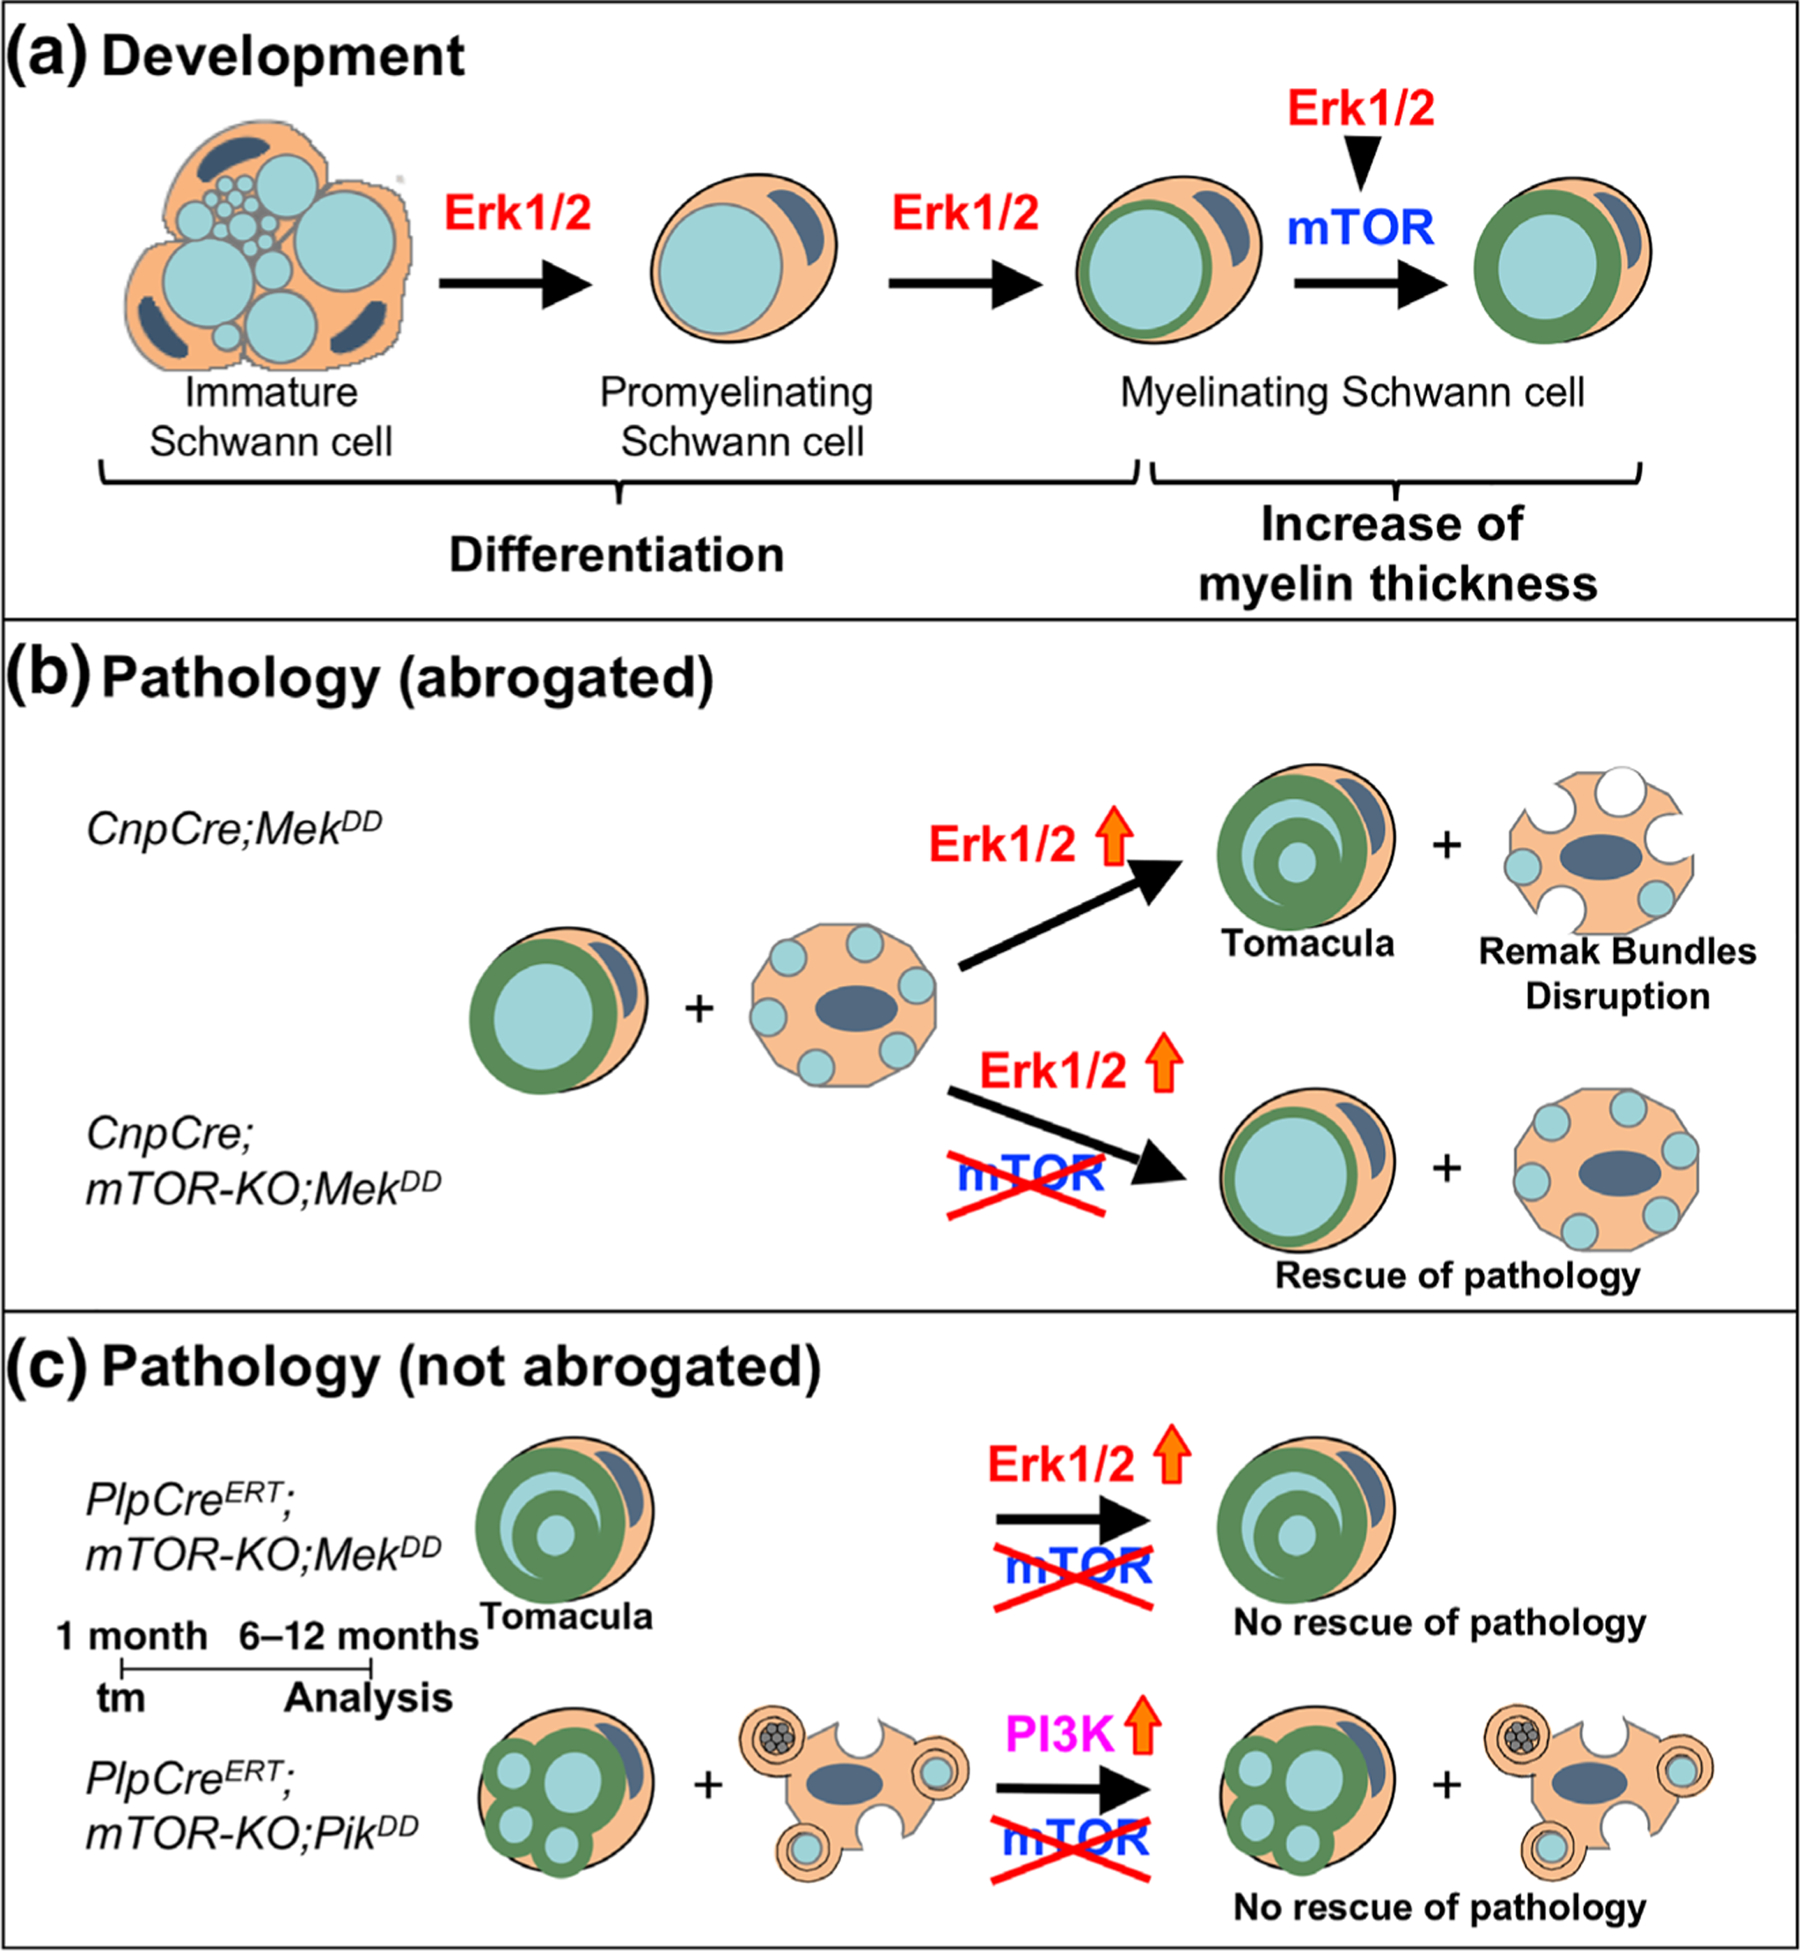
Multiple signals are involved in the regulation of developmental myelination by Schwann cells and in the maintenance of a normal myelin homeostasis throughout adult life, preserving the integrity of the axons in the PNS. Recent studies suggest that Mek/ERK1/2-MAPK and PI3K/Akt/mTOR intracellular signaling pathways play important, often overlapping roles in the regulation of myelination in the PNS. In addition, hyperactivation of these signaling pathways in Schwann cells leads to a late onset of various pathological changes in the sciatic nerves. However, it remains poorly understood whether these pathways function independently or sequentially or converge using a common mechanism to facilitate Schwann cell differentiation and myelin growth during development and in causing pathological changes in the adult animals. To address these questions, we analyzed multiple genetically modified mice using simultaneous loss- and constitutive gain-of-function approaches. We found that during development, the Mek/ERK1/2-MAPK pathway plays a primary role in Schwann cell differentiation, distinct from mTOR. However, during active myelination, ERK1/2 is dependent on mTOR signaling to drive the growth of the myelin sheath and regulate its thickness. Finally, our data suggest that peripheral nerve pathology during adulthood caused by hyperactivation of Mek/ERK1/2-MAPK or PI3K is likely to be independent or dependent on mTOR-signaling in different contexts. Thus, this study highlights the complexities in the roles played by two major intracellular signaling pathways in Schwann cells that affect their differentiation, myelination, and later PNS pathology and predicts that potential therapeutic modulation of these pathways in PNS neuropathies could be a complex process.

Keywords: Schwann cells; differentiation; myelin; myelination.


Conflict of interest statement

CONFLICT OF INTEREST

The authors declare no competing financial interests.

Figures

FIGURE 1
FIGURE 1
Ultrastructure of sciatic nerves show that the majority of axons remains unmyelinated in the conditional ERK1/2 dKO mice in contrast to mTOR KO mice and that chwann cell differentiation is arrested at different stages of maturation. (a) EM images of sciatic nerve cross-sections at postnatal day (P) 30 from control, CnpCre;ERK1/2-dKO, and CnpCre;mTOR-KO mice show that the majority of axons are unmyelinated in CnpCre;ERK1/2-dKO, whereas in the CnpCre;mTOR-KO mice, all axons are ensheathed by myelin sheaths, although they are thinner than controls, as expected. (b) Quantification confirms that the percentage of myelinated axons is significantly lower in CnpCre;ERK1/2-dKO but is comparable to control in the CnpCre;mTOR-KO mice. (c) Higher-magnification EM images of CnpCre;ERK1/2-dKO sciatic nerves show examples of Schwann cells arrested at different stages of maturation, (i,ii) as immature Schwann cells engulfing numerous small size unsorted axons, and (iii) promyelinating Schwann cells that have sorted and have established a one-to-one ratio with axons but have failed to make compact myelin sheath. Scale bars as indicated. Error bars indicate SEM, **p < .01, N = 3 [Color figure can be viewed at wileyonlinelibrary.com]
FIGURE 2
FIGURE 2
Expression of major myelin proteins and transcription factors is affected differently in ERK1/2 dKO compared to mTOR KO mice. (a) Immunoblot analysis and quantification for p-Erk1/2 and pan-mTOR levels in total proteins homogenates from sciatic nerves at postnatal day 30 (P30) shows a significant reduction of p-Erk1/2 expression in the CnpCre;ERK1/2-dKO (i) and of pan-mTOR expression in the CnpCre;mTOR-KO (ii) mice compared to their respective controls. GAPDH was used as a loading control. N = 3 for each condition. Error bars indicate SEM. **p < .01, Student’s t-test. Immunolabeling (b) and in situ hybridization (c) of sciatic nerve sections at P30 from control, CnpCre;ERK1/2-dKO, and CnpCre;mTOR-KO mice show a dramatic reduction in the signals of myelin protein zero (MPZ), Krox-20 proteins, and MBP mRNA and an increase in Oct-6 protein in Schwann cells of CnpCre;ERK1/2-dKO compared to control mice. In contrast, CnpCre;mTOR-KO mice showed only a partial reduction in MPZ protein, MBP mRNA, and increase in Oct-6 signals but a strong increase in the intensity of Krox-20 signal compared to controls. (d) Immunoblot analysis of total proteins homogenates and quantification of the band intensity from sciatic nerve of CnpCre; ERK1/2-dKO, CnpCre;mTOR-KO, and littermate control mice at P30 shows a highly significant reduction in MPZ and Krox-20 and increase in Oct-6 protein levels in the CnpCre;ERK1/2-dKO compared to control mice. In the CnpCre;mTOR-KO mice, there is a reduction in MPZ and a highly significant increase in Krox-20 and Oct-6 compared to controls. GAPDH was used as a loading control. Nf-m, neurofilament-m. scale bars, as indicated. Error bars indicate SEM. *p < .05, **p < .01, one-way ANOVA. N = 3 for each condition [Color figure can be viewed at wileyonlinelibrary.com]
FIGURE 3
FIGURE 3
Sustained elevation of ERK1/2 activity in Schwann cells failed to rescue the deficits in myelin thickness in the mTOR KO mice. (a) EM images of sciatic nerve cross-sections at low and high magnification show reduced myelin thickness in the CnpCre;mTOR-KO compared to control, which was not rescued by ERK1/2 elevation in the CnpCre;mTOR-KO;MekDD mice, even though its elevation increases myelin thickness in CnpCre;MekDD compared to control mice. Quantification of myelin thickness by g-ratio analysis, presented as scatter plots relative to axon diameters, indicates that compared to control (black dots), both CnpCre;mTOR-KO (blue dots) and CnpCre;mTOR-KO;MekDD (green dots) show reduced myelin thickness (higher g-ratios), while CnpCre;MekDD mice (red dots) show thicker myelin sheaths compared to controls (lower g-ratios). (b) EM images of sciatic nerve cross-sections at low and high magnification at P30 also show that the thickness of myelin in the CnpCre; ERK1/2-dKO mice is thinner than in the control, but is similar to the CnpCre;mTOR-KO mice. Approximately 100 axons from two mice of each genotype were analyzed. Scale bar as indicated. Red asterisks in (a), shows axons of similar diameter [Color figure can be viewed at wileyonlinelibrary.com]
FIGURE 4
FIGURE 4
Ablation of mTOR in Schwann cell precursors early during development abrogates pathological changes in myelinating and non-myelinating caused by the simultaneous hyperactivation of Mek/ERK1/2. (a) Semithin sections of sciatic nerves from control, CnpCre;MekDD, CnpCre;mTOR-het;MekDD, and CnpCre;mTOR-KO;MekDD mice at 2 and 6 months show abnormal myelin figures (examples, red arrowheads) and enlarged extracellular space already at 2 months in the CnpCre;MekDD and CnpCre;mTOR-het;MekDD mice but not in the CnpCre;mTOR-KO;MekDD mice. By 6 months of age, abnormal myelin figures and the enlargement of extracellular space are more pronounced in both the CnpCre;MekDD and CnpCre;mTOR-het;MekDD mice but are not seen in the CnpCre;mTOR-KO;MekDD or control mice. (b) Sudan black staining of teased fiber preparation of sciatic nerve shows thickening of myelin at the paranodes (tomacula, red arrowheads) in the CnpCre;MekDD and CnpCre;mTOR-het; MekDD mice but not in the control or CnpCre;mTOR-KO;MekDD mice. (c) High-magnification EM images of sciatic nerve cross-sections show normal Remak bundles in control, but its structure appears disrupted in the CnpCre;MekDD and CnpCre;mTOR-het;MekDD mice. In contrast, CnpCre; mTOR-KO;MekDD mice show normal Remak bundles. (d) Longitudinal sections of sciatic nerves, stained at 6 months with Giemsa stain (blue) to identify mast cells (arrowheads), show increased infiltration in the CnpCre;MekDD and CnpCre;mTOR-het;MekDD but not in the CnpCre;mTOR-KO; MekDD mice. (e) Quantification of abnormal myelin/axon structures in seminthin sections of sciatic nerves at 6 months show a statistically significant increase in the percentage of affected axons in the CnpCre;MekDD and CnpCre;mTOR-het;MekDD mice compared with control mice. This increase was completely abrogated in the CnpCre;mTOR-KO;MekDD mice. 10 fields at 100x per genotype were analyzed from 2 mice per group. (f) Quantification of mast cell infiltration in the longitudinal section of sciatic nerves show a statistically significant increased at 6 months in the CnpCre;MekDD compared with the control mice which was abrogated in the CnpCre;mTOR-KO;MekDD mice. 2–3 fields at 20x per genotype were analyzed from at least 2–3 mice per group. (g) Immunoblot analysis and quantification for p-mTORS2448, p-p70S6K T389, p-S6RPS235,S236 and p-Erk1/2 levels in total proteins homogenates from sciatic nerve at 2 months shows a significant increase in p-mTORS2448, p-p70S6KT389 and p-Erk1/2 expression in the CnpCre;mTOR-het;MekDD compared to control. These increases were abrogated when mTOR was ablated in CnpCre; mTOR-KO and CnpCre;mTOR-KO;MekDD mice and these mice showed dramatically reduced levels of p-mTORS2448, p-p70S6KT389 p-S6RPS235,S236 and p-Erk1/2 compared to controls. GAPDH was used as a loading control. N = 3 for each condition. Error bars indicate SEM. *p < .05, **p < .01, one-way ANOVA. Scale bar as indicated. Representative images of sciatic nerves are shown [Color figure can be viewed at wileyonlinelibrary.com]
FIGURE 5
FIGURE 5
Mek/ERK1/2-mediated myelin pathology was not abrogated when mTOR was simultaneously ablated during adulthood from myelinating Schwann cells. (a) Semithin sections of sciatic nerves from control, PlpCreERT;MekDD, and PlpCreERT;mTOR-KO;MekDD mice injected with Tm at 1 month of age and analyzed at 12 months post-injection (MPI) show numerous abnormal myelin figures (red arrowheads) in both the PlpCreERT;MekDD and PlpCreERT;mTOR-KO;MekDD mice but not in the controls. (b) EM images at higher magnification show examples of abnormal myelin structures, including out-foldings with invaginating recurrent loops that appear as concentric rings of myelin (i,iv), Wallerian-type degeneration with axons in different stages of degeneration (ii,v), and aberrant hyper-myelination with axon compression (iii,vi) in the PlpCreERT; mTOR-KO;MekDD mice (iv–vi), which is similar to that in PlpCreERT;MekDD mice (i–iii). (c) Teased fiber preparation from sciatic nerves stained with Sudan black shows focal myelin thickening at the paranodes forming tomacula-like structures (red arrowheads) in both the PlpCreERT;MekDD mice and PlpCreERT;mTOR-KO;MekDD mice but not in the control. (d) Quantification of abnormal myelin/axon figures in seminthin sections of sciatic nerves from control and mutant mice at 12 MPI show a statistically significant increase in the percentage of affected axons in the PlpCreERT; MekDD mice compared with controls which was not abrogated in the PlpCreERT;mTOR-KO;MekDD mice. Ten fields at 100x per genotype were analyzed from 2 mice per group. (e) Immunolabeling of teased fibers from sciatic nerves of 2-month-old control mice show intense staining for phospho-ERK1/2 at the paranodal region of the myelinated fibers (arrowheads). Scale bar as indicated. Asterisks, degenerating axons. Representative images of sciatic nerves from 2–3 mice per genotype are shown. (f) Immunoblot analysis and quantification for (i) p-mTORS2448, (ii) p-p70S6KT389, (iii) p-S6RPS235,S236, and (iv) p-Erk1/2 levels in total protein homogenates from sciatic nerve at approximately 11 MPI shows a statistically significant increase in p-mTORS2448 and p-Erk1/2 expression levels in the PlpCreERT;MekDD compared to control mice. While ablation of mTOR led to significant decrease of p-mTORS2448 in the PlpCreERT;mTOR-KO;MekDD mice compared to PlpCreERT;MekDD, the levels of p-p70S6KT389, p-S6RPS235,S236 and p-ERK did not show such decrease. GAPDH was used as a loading control. N = 3 for each condition. Error bars indicate SEM. *p < .05, **p < .01, one-way ANOVA [Color figure can be viewed at wileyonlinelibrary.com]
FIGURE 6
FIGURE 6
PI3K-mediated pathology was also not abrogated when mTOR was simultaneously ablated during adulthood from myelinating Schwann cells. (a) Semithin sections of sciatic nerves from control, PlpCreERT;mTOR-het;PikDD, and PlpCreERT;mTOR-KO;PikDD mice injected with Tm at 1 month of age and analyzed at 5 months postinjection (MPI) show numerous abnormal myelin figures (red arrowheads) in both the PlpCreERT;mTOR-het;PikDD and PlpCreERT;mTOR-KO;PikDD mice but not in the controls. (b) EM images at higher magnification show presence of abnormalities in both the PlpCreERT;mTOR-het;PikDD (i–iii) and PlpCreERT;mTOR-KO;PikDD (iv–vi), which includes (i,iv) myelin out-foldings with evaginating recurrent loops, (ii,v) redundant myelin, constricting and displacing the axon, and (iii,vi) multiple evaginating recurrent loops that appear as Schwann cell ensheathing multiple small-diameter axons. (c) Teased fiber preparation from sciatic nerve shows focal myelin thickening with abnormal structures in both the PlpCreERT;mTOR-het;PikDD and PlpCreERT;mTOR-KO;PikDD mice. Scale bar as indicated. Asterisks, axonal abnormalities. Representative images of sciatic nerves from 2–3 mice per genotype are shown. (d) Quantification of abnormal myelin figures in seminthin sections of sciatic nerves from mice at 5 MPI show a statistically significant increase in the percentage of affected axons in the PlpCreERT;mTOR-het;PikDD mice compared to control mice which failed to be rescue in the PlpCreERT;mTOR-KO;PikDD mice. Ten fields at 100x per genotype were analyzed from at least 2–3 mice per group. Error bars indicate SEM. **p < .01, one-way ANOVA. (e) Immunoblot analysis and quantification for p-mTORS2448 and p-p70S6KT389 levels in total protein homogenates from sciatic nerve at 2MPI shows a significant increase in p-mTORS2448 and p-p70S6KT389 levels in the PlpCreERT;PikDD mice compared to controls. While ablation of mTOR showed reduction trend of p-mTORS2448 levels in the PlpCreERT;mTOR-KO;PikDD compared to PlpCreERT;PikDD mice, the levels of p-p70S6KT389 did not show such a trend. β-Actin was used as a loading control. N = 3 for control and PlpCreERT;PikDD and N = 2 for PlpCreERT;mTOR-KO;PikDD. Error bars indicate SEM. *p < .05, Student’s t-test [Color figure can be viewed at wileyonlinelibrary.com]
FIGURE 7
FIGURE 7
PI3K-mediated pathology was not abrogated when mTOR was simultaneously ablated during adulthood from non-myelinating Schwann cells. (a) High-magnification EM images of sciatic nerves from control, PlpCreERT;mTOR-het;PikDD, and PlpCreERT;mTOR-KO;PikDD mice injected with Tm at 1 month of age and analyzed at 5 months postinjection (MPI) show normal Remak bundle in control but a disruption of its structure in both the PlpCreERT;mTOR-het;PikDD and PlpCreERT;mTOR-KO;PikDD mice. (b) EM images at high magnification show other abnormalities that are present in both PlpCreERT;mTOR-het;PikDD (i–iii) and PlpCreERT;mTOR-KO;PikDD (iv–vi) mice, including (i,iv) multiple redundant membranous structures nonrandomly hyper-wrapping small-diameter axons, (ii,v) abnormal membranous hyper-wrapping of collagen fibrils, and (iii,vi) increased accumulation of extracellular collagen fibers. Scale bar as indicated. Representative images of sciatic nerves from 2–3 mice per genotype are shown
FIGURE 8
FIGURE 8
Working model for the role of Mek/ERK1/2-MAPK and PI3K/Akt/mTOR signaling pathways in the regulation of Schwann cell differentiation/myelination and in the manifestation of pathological changes in sciatic nerves during adulthood. (a) Loss-of-function studies show that during development, Schwann cell differentiation is primary regulated by the Mek/ERK1/2-MAPK pathway, independent of mTOR. However, during active myelination, ERK1/2 is dependent on mTOR signaling to drive the growth of the myelin sheath and regulate its thickness. (b) Sustained hyperactivation of Mek/ERK1/2 in immature Schwann cell precursors (CnpCre;MekDD) leads to a late onset of tomacula-like myelin pathology and disruption of Remak bundles. This was abrogated when mTOR was simultaneously ablated early during development (CnpCre; mTOR-KO;MekDD). (c) However, this Mek/ERK1/2-mediated pathology could not be abrogated when mTOR ablation was simultaneously induced later during adulthood (PlpCreERT;mTOR-KO;MekDD). Similarly, pathological changes induced by hyperactivation of PI3K (PlpCreERT;mTOR-KO;PikDD) could not be abrogated when mTOR ablation was simultaneously induced later during adulthood (PlpCreERT;mTOR-KO;PikDD) [Color figure can be viewed at wileyonlinelibrary.com]

Similar articles

Cited by

References

    1. Anjum R, & Blenis J. (2008). The RSK family of kinases: Emerging roles in cellular signalling. Nature Reviews. Molecular Cell Biology, 29, 747–758. 10.1038/nrm2509 - DOI - PubMed
    1. Ballestero RP, Dybowski JA, Levy G, Agranoff BW, & Uhler MD (1999). Cloning and characterization of zRICH, a 20,30-cyclic-nucleotide 30-phosphodiesterase induced during zebrafish optic nerve regeneration. Journal of Neurochemistry, 72, 1362–1371. 10.1046/j.1471-4159.1999.721362.x - DOI - PubMed
    1. Beirowski B, Wong KM, Babetto E, & Milbrandt J. (2017). mTORC1 promotes proliferation of immature Schwann cells and myelin growth of differentiated Schwann cells. Proceedings of the National Academy of Sciences of the United States of America, 114, E4261–E4270. 10.1073/pnas.1620761114 - DOI - PMC - PubMed
    1. Bercury KK, Dai J, Sachs HH, Ahrendsen JT, Wood TL, & Macklin WB (2014). Conditional ablation of raptor or rictor has differential impact on oligodendrocyte differentiation and CNS myelination. The Journal of Neuroscience, 34, 4466–4480. - PMC - PubMed
    1. Cotter L, Ozçelik M, Jacob C, Pereira JA, Locher V, Baumann R, Relvas JB, Suter U, & Tricaud N. (2010). Dlg1-PTEN interaction regulates myelin thickness to prevent damaging peripheral nerve over-myelination. Science, 328, 1415–1418. - PubMed

Publication types

MeSH terms

Substances