. 2021 Jul 1;108(7):1270-1282.
doi: 10.1016/j.ajhg.2021.05.016. Epub 2021 Jun 21.

Summix: A method for detecting and adjusting for population structure in genetic summary data

Affiliations

Summix: A method for detecting and adjusting for population structure in genetic summary data

Ian S Arriaga-MacKenzie et al. Am J Hum Genet. .

Abstract

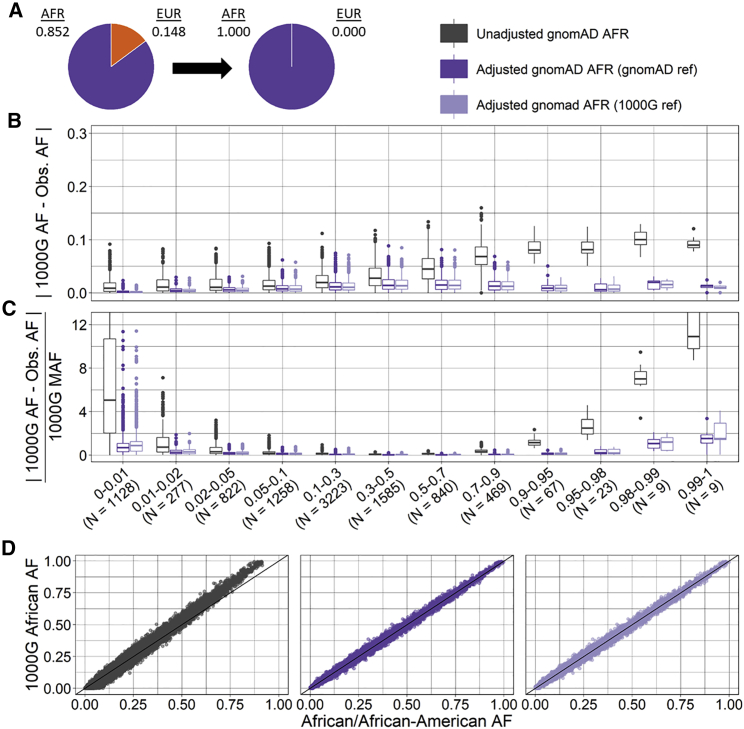
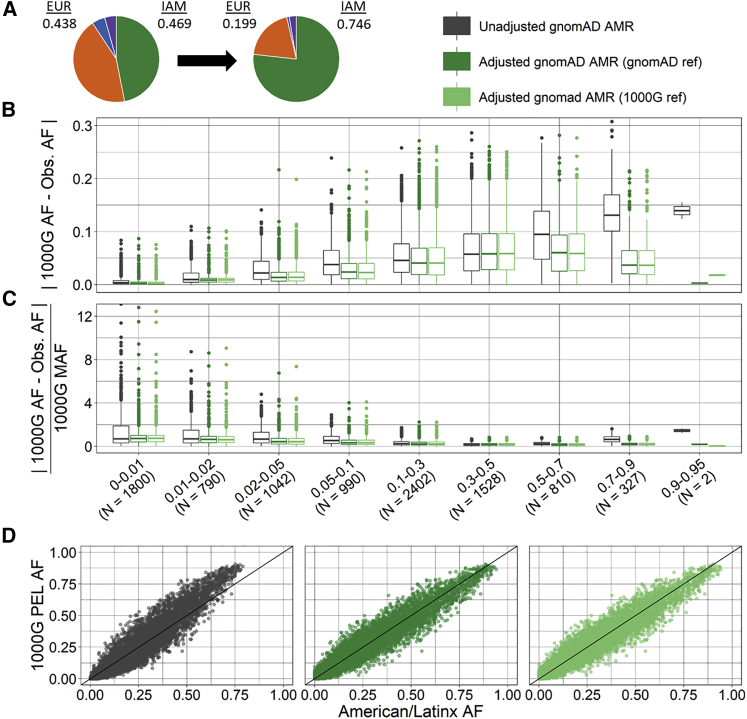
Publicly available genetic summary data have high utility in research and the clinic, including prioritizing putative causal variants, polygenic scoring, and leveraging common controls. However, summarizing individual-level data can mask population structure, resulting in confounding, reduced power, and incorrect prioritization of putative causal variants. This limits the utility of publicly available data, especially for understudied or admixed populations where additional research and resources are most needed. Although several methods exist to estimate ancestry in individual-level data, methods to estimate ancestry proportions in summary data are lacking. Here, we present Summix, a method to efficiently deconvolute ancestry and provide ancestry-adjusted allele frequencies (AFs) from summary data. Using continental reference ancestry, African (AFR), non-Finnish European (EUR), East Asian (EAS), Indigenous American (IAM), South Asian (SAS), we obtain accurate and precise estimates (within 0.1%) for all simulation scenarios. We apply Summix to gnomAD v.2.1 exome and genome groups and subgroups, finding heterogeneous continental ancestry for several groups, including African/African American (∼84% AFR, ∼14% EUR) and American/Latinx (∼4% AFR, ∼5% EAS, ∼43% EUR, ∼46% IAM). Compared to the unadjusted gnomAD AFs, Summix's ancestry-adjusted AFs more closely match respective African and Latinx reference samples. Even on modern, dense panels of summary statistics, Summix yields results in seconds, allowing for estimation of confidence intervals via block bootstrap. Given an accompanying R package, Summix increases the utility and equity of public genetic resources, empowering novel research opportunities.

Keywords: allele frequency; ancestry; common controls; external controls; gnomAD; population stratification; population structure; summary.


Conflict of interest statement

C.R.G. owns stock in 23and Me, Inc.

Figures

Figure 1
Figure 1
Simulation results for five ancestries Accuracy is defined as the difference between the estimated ancestry proportions and given ancestry proportions within simulations. We used five reference ancestries to simulate genotypes of an admixed population. (A) Accuracy separated by ancestry. (B) Accuracy separated by ancestry proportion. (C) Accuracy separated by both ancestry and ancestry proportion.
Figure 2
Figure 2
Precision in ancestry estimates for African/African American and American/Latinx gnomAD groups by number of SNPs Number of SNPs (x axis) and estimated ancestry proportion (y axis) for 1,000 replicates. (A) African/African American exome. (B) American/Latinx exome.
Figure 3
Figure 3
Ancestry-adjusted versus unadjusted allele frequency for gnomAD African/African American exomes for a target sample with African ancestry Ancestry-adjusted AF was estimated for a target sample with 100% African ancestry via gnomAD (dark purple) or 1000 Genomes (light purple) non-Finnish European as reference and compared to unadjusted AF (grey) for 9,710 SNPs. (A) Ancestry proportions for gnomAD African/African American exomes (AFR = 0.852, EUR = 0.148) and target sample (AFR = 1). (B) Absolute difference between target sample AF (1000 Genomes African ancestry) and unadjusted or ancestry-adjusted gnomAD AF by 1000 Genomes AF category. (C) Relative difference between target 1000 Genomes African ancestry AF and unadjusted or ancestry-adjusted gnomAD AF by 1000 Genomes AF category; unzoomed versions of (B) and (C) are available in the supplemental information (Figure S10). (D) Scatter plot of target sample 1000 Genomes AF (y axis) and unadjusted (left), ancestry-adjusted with gnomAD reference (center), and ancestry-adjusted with 1000 Genomes reference (right) gnomAD AF (x axis).
Figure 4
Figure 4
Ancestry-adjusted versus unadjusted AF for gnomAD American/Latinx exomes for a target sample of Peruvian ancestry Ancestry-adjusted AF was estimated for a target Peruvian sample via gnomAD (dark green) or 1000 Genomes (light green) East Asian, European, and African as reference ancestral populations and compared to unadjusted AF (grey) for 8,633 SNPs. (A) Normalized ancestry proportions estimated for gnomAD American/Latinx exomes (purple, AFR = 0.044; blue, EAS = 0.049; orange, EUR = 0.438; green, IAM = 0.469) and target Peruvian ancestry proportions (purple, AFR = 0.028; blue, EAS = 0.027; orange, EUR = 0.199; green, IAM = 0.746). (B) Absolute difference between target 1000 Genomes Peruvian ancestry AF and unadjusted or ancestry-adjusted gnomAD AF by 1000 Genomes AF category. (C) Relative difference between target 1000 Genomes Peruvian ancestry AF and unadjusted or ancestry-adjusted gnomAD AF by 1000 Genomes AF category; unzoomed versions of (B) and (C) are available in the supplemental information (Figure S11). (D) Scatter plot of target 1000 Genomes AF (y axis) and unadjusted (left), ancestry-adjusted with gnomAD reference (center), and ancestry-adjusted with 1000 Genomes reference (right) gnomAD AF (x axis).

References

    1. Karczewski K.J., Francioli L.C., Tiao G., Cummings B.B., Alföldi J., Wang Q., Collins R.L., Laricchia K.M., Ganna A., Birnbaum D.P., Genome Aggregation Database Consortium The mutational constraint spectrum quantified from variation in 141,456 humans. Nature. 2020;581:434–443. - PMC - PubMed
    1. Phan L., Jin Y., Zhang H., Qiang W., Shekhtman E., Shao D., Revoe D., Villamarin R., Ivanchenko E., Kimura M. US National Library of Medicine; 2020. ALFA: Allele Frequency Aggregator. National Center for Biotechnology Information.https://www.ncbi.nlm.nih.gov/snp/docs/gsr/alfa/
    1. Guo M.H., Plummer L., Chan Y.-M., Hirschhorn J.N., Lippincott M.F. Burden Testing of Rare Variants Identified through Exome Sequencing via Publicly Available Control Data. Am. J. Hum. Genet. 2018;103:522–534. - PMC - PubMed
    1. Hendricks A.E., Billups S.C., Pike H.N.C., Farooqi I.S., Zeggini E., Santorico S.A., Barroso I., Dupuis J. ProxECAT: Proxy External Controls Association Test. A new case-control gene region association test using allele frequencies from public controls. PLoS Genet. 2018;14:e1007591. - PMC - PubMed
    1. Lee S., Kim S., Fuchsberger C. Improving power for rare-variant tests by integrating external controls. Genet. Epidemiol. 2017;41:610–619. - PMC - PubMed

Publication types

LinkOut - more resources