. 2021 Aug 4;109(15):2413-2426.e7.
doi: 10.1016/j.neuron.2021.05.034. Epub 2021 Jun 21.

Overexpressing low-density lipoprotein receptor reduces tau-associated neurodegeneration in relation to apoE-linked mechanisms

Affiliations

Overexpressing low-density lipoprotein receptor reduces tau-associated neurodegeneration in relation to apoE-linked mechanisms

Yang Shi et al. Neuron. .

Abstract

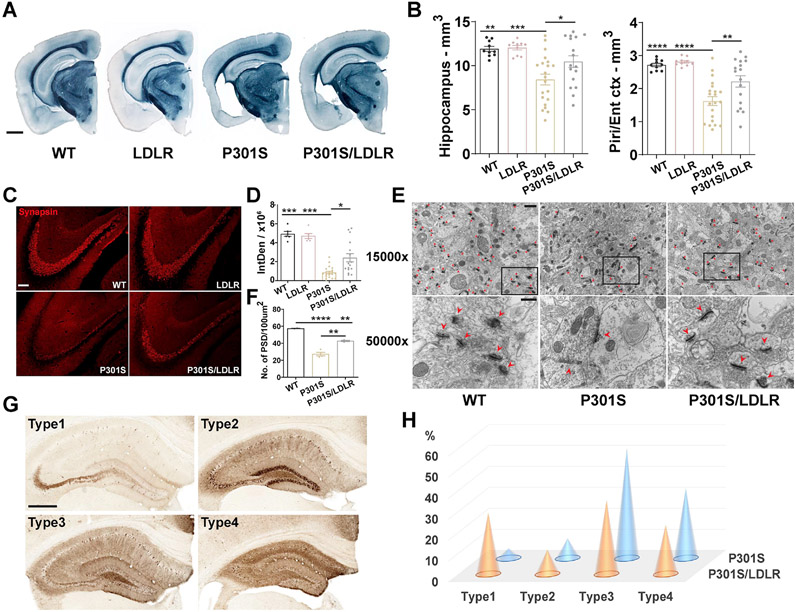
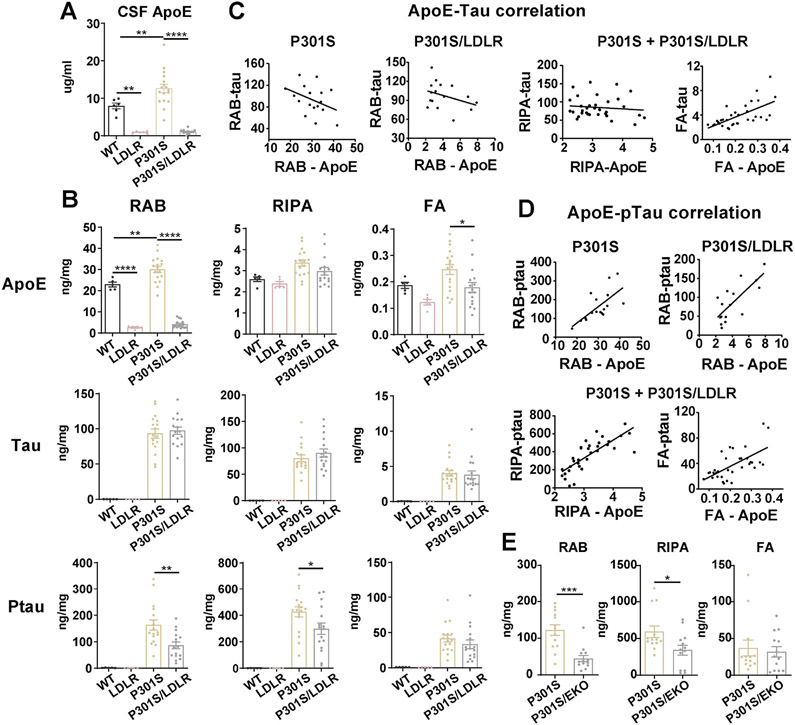
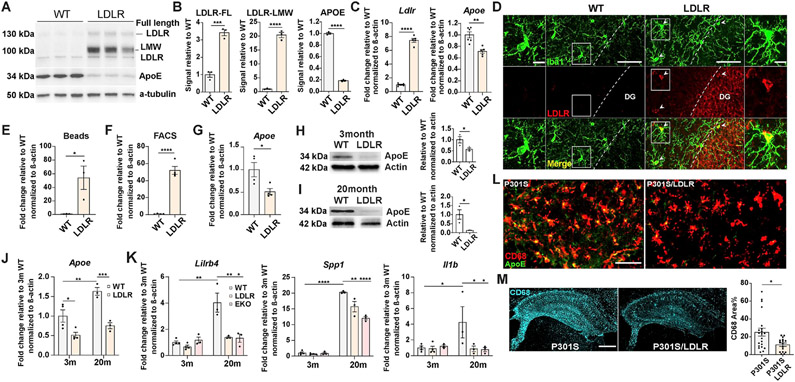
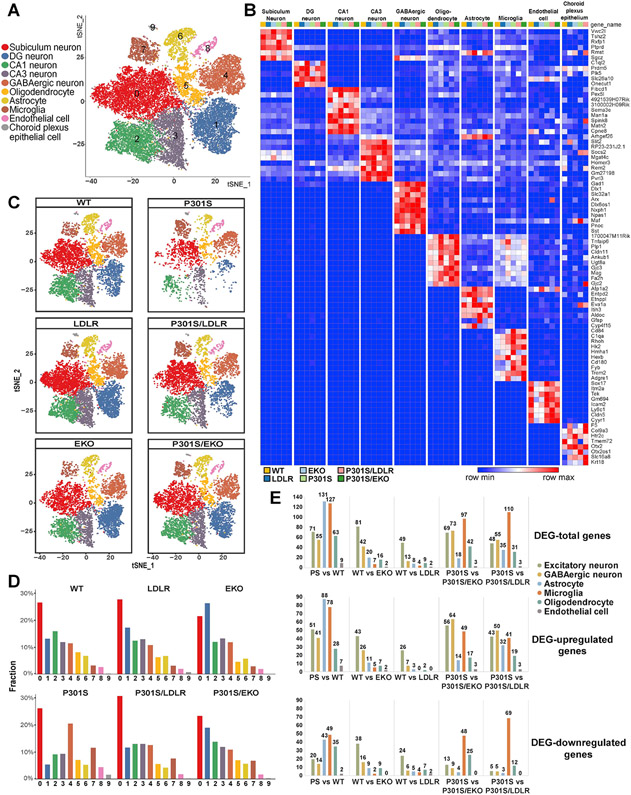
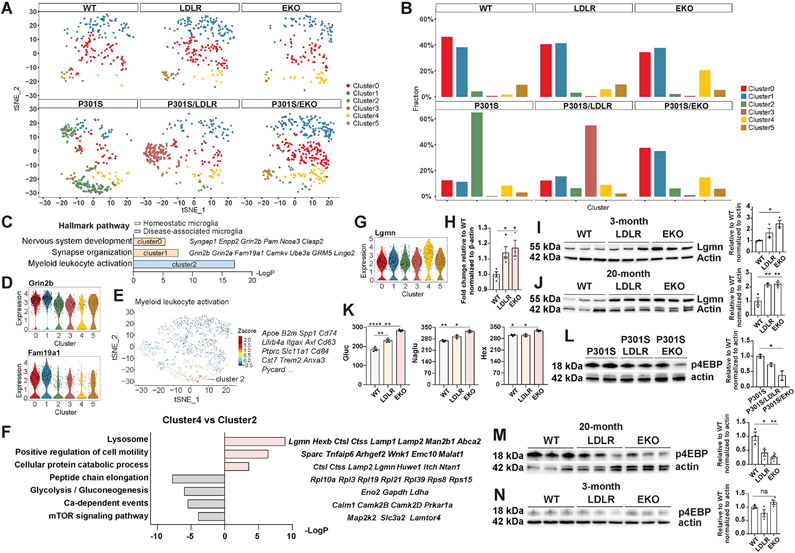
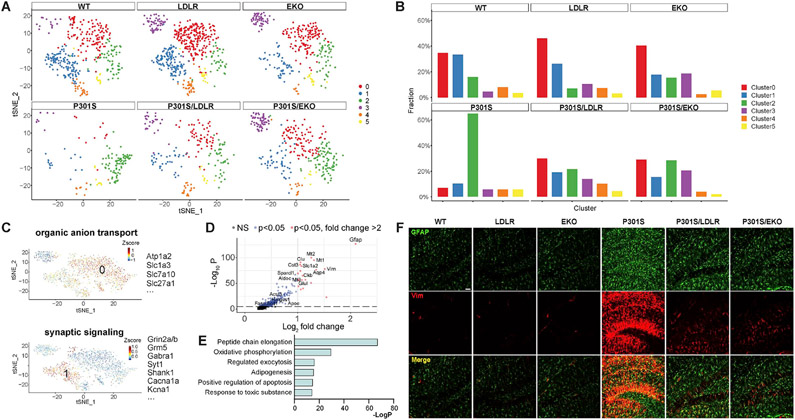
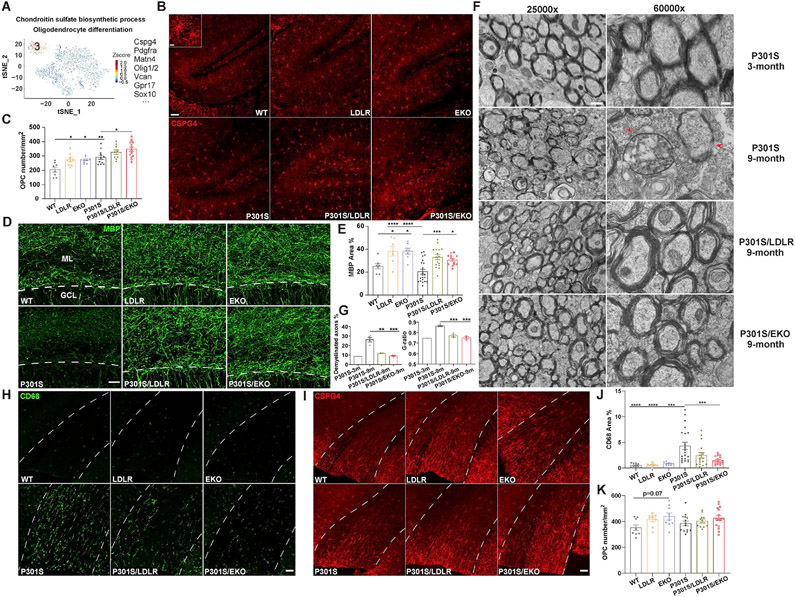
APOE is the strongest genetic risk factor for late-onset Alzheimer's disease. ApoE exacerbates tau-associated neurodegeneration by driving microglial activation. However, how apoE regulates microglial activation and whether targeting apoE is therapeutically beneficial in tauopathy is unclear. Here, we show that overexpressing an apoE metabolic receptor, LDLR (low-density lipoprotein receptor), in P301S tauopathy mice markedly reduces brain apoE and ameliorates tau pathology and neurodegeneration. LDLR overexpression (OX) in microglia cell-autonomously downregulates microglial Apoe expression and is associated with suppressed microglial activation as in apoE-deficient microglia. ApoE deficiency and LDLR OX strongly drive microglial immunometabolism toward enhanced catabolism over anabolism, whereas LDLR-overexpressing microglia also uniquely upregulate specific ion channels and neurotransmitter receptors upon activation. ApoE-deficient and LDLR-overexpressing mice harbor enlarged pools of oligodendrocyte progenitor cells (OPCs) and show greater preservation of myelin integrity under neurodegenerative conditions. They also show less reactive astrocyte activation in the setting of tauopathy.

Keywords: ApoE; LDLR; OPC; metabolism; microglia; myelin; tau.


Conflict of interest statement

Declaration of interests D.M.H. and C.I. are listed as inventors on a patent licensed by Washington University to C2N Diagnostics on the therapeutic use of anti-tau antibodies. D.M.H. co-founded and is on the scientific advisory board of C2N Diagnostics. C2N Diagnostics has licensed certain anti-tau antibodies to AbbVie for therapeutic development. D.M.H. is on the scientific advisory board of Denali and consults for Genentech, Merck, and Cajal Neurosciences.

Figures

Figure 1.
Figure 1.. LDLR OX in P301S mice attenuates neurodegeneration, synaptic loss and tau histopathology
(A, B) Sudan Black staining and brain volume quantification of 9-month WT, LDLR, P301S and P301S/LDLR mice (n=10-21). Scale bar: 1mm. (C, D) Synapsin staining and quantification of the integrated density (IntDen, area × mean gray value) in the stratum lucidum of hippocampal CA3 region in 9-month mice (n=6-21). Scale bar: 100μm. Kruskal-Wallis test with Dunn’s multiple comparisons test. (E, F) EM images of PSDs and quantification of PSD density in the stratum radiatum of hippocampal CA1 region in 9-month mice (n=2-4). Top (E): 15000x magnification, scale bar: 1μm; Bottom (E): 50000x magnification, scale bar: 400nm. Red asterisks or arrow heads point to PSDs. (G) Four distinct p-tau patterns stained by AT8 in 9-month P301S and P301S/LDLR mice. Scale bar: 500μm. (H) Distribution of p-tau staining patterns in 9-month P301S and P301S/LDLR mice (P301S: n=21, P301S/LDLR: n=17), p= 3.624e-05 (fisher’s exact test, two-sided). No p-tau immunoreactivity in WT and LDLR mice. Data expressed as mean ± SEM, One-way ANOVA with Tukey’s post hoc test, two-sided in (B) and (F), *p<0.05, **p<0.01, ***p<0.001, ****p<0.0001. Piri: piriform cortex, Ent: entorhinal cortex. See also Figure S2.
Figure 2.
Figure 2.. LDLR OX in P301S mice markedly reduces apoE and p-tau levels that highly correlate with each other
(A) ApoE level in the CSF of 9-month WT, LDLR, P301S and P301S/LDLR mice measured by ELISA (n=6-17). (B) ELISA measurement of apoE, human tau, and p-tau levels in RAB, RIPA and 70% FA fractions respectively for 9-month mouse posterior cortical lysates. Student’s t-test (two-sided) for human tau and ptau, no signal in WT and LDLR mice. (C) Correlation between apoE and human tau level in RAB (non-significant), RIPA (no correlation) and FA (r2=0.4114, p<0.0001) fractions respectively in P301S and P301S/LDLR mice. (D) Correlation between apoE level and p-tau level in RAB (P301S: r2=0.4649, p=0.0026; P301S/LDLR: r2=0.5690, p=0.0007), RIPA (r2=0.6124, p<0.0001), and FA (r2=0.3948, p<0.0001) fractions respectively in P301S and P301S/LDLR mice. (E) ELISA measurement of p-tau levels in RAB, RIPA and 70% FA fractions of mouse brain lysates for a separate cohort of 9-month P301S and P301S/EKO mice. (n=13). Mann-Whitney test (two-sided). Data expressed as mean ± SEM, One-way ANOVA with Tukey’s post hoc test, two-sided in (A) and (B), Pearson correlation analysis (two-sided) in (C) and (D). *p<0.05, **p<0.01, ***p<0.001, ****p<0.0001.
Figure 3.
Figure 3.. Microglial overexpression of the LDLR transgene reduces its Apoe expression and intracellular apoE level, and is associated with suppressed microglial activation
(A, B) Western blot and quantification of apoE and LDLR in primarily cultured microglia isolated from P2 pups of WT and LDLR Tg mice (n=3, mixed sex). (C) qPCR for Ldlr and Apoe in cultured microglia (n=5-6, mixed sex). (D) Immunofluorescent staining of LDLR and Iba1 in 9-month WT and LDLR Tg mice. Column 1 and 4 (scale bar: 10μm): zoom-in images of square areas in column 2 and 3 (scale bar: 50μm) respectively. Arrow heads point to microglia overexpressing LDLR. (E, F) qPCR for Ldlr in microglia acutely isolated from 3-month WT and LDLR Tg mice by magnetic beads (E) or by FACS (F) (n=3-4). (G) qPCR for Apoe in FACS-sorted microglia from 3-month WT and LDLR Tg mice (n=4). (H, I) Western blot and quantification of apoE level in acutely isolated microglia from 3-month (H) and 20-month (I) WT and LDLR Tg mice (n=3). (J, K) qPCR for Apoe (J) and DAM/proinflammatory genes (K) in FACS-sorted microglia from 3-month and 20-month WT and LDLR Tg mice (n=3-4), two-way ANOVA with Tukey’s post hoc test, two-sided. (L) Co-staining of apoE and CD68 in 9-month P301S mice and P301S/LDLR mice (scale bar: 50μm). (M) Staining and quantification of CD68 in the hippocampus of 9-month P301S and P301S/LDLR mice (n=16-21), scale bar: 500μm. Mann-Whitney test (two-sided). Data expressed as mean ± SEM. Student’s t-test (two-sided) in (B), (C), (E-I), *p<0.05, **p<0.01 ***p<0.001, ****p<0.0001. See also Figure S1.
Figure 4.
Figure 4.. Single-nucleus RNAseq identifies changes in major brain cell types and cell type-specific DEGs under neurodegenerative, apoE-deficient and LDLR-overexpressing conditions
(A) t-SNE plot showing 10 clusters (0–9) identified in all nuclei from 9-month P301S, P301S/LDLR, P301S/EKO, WT, LDLR, and EKO mouse hippocampus. (B) Heatmap showing distinct cell types identified by cell type-specific markers. (C) Overview of all cell populations in six groups of mice by t-SNE plots. (D) Relative frequency of all cell clusters in each genotype. (E) The number of DEGs compared between different genotypes in major brain cell types. Top: total number of DEGs; middle: number of upregulated DEGs; bottom: number of downregulated DEGs (former versus latter genotype). See also Figure S3, S4.
Figure 5.
Figure 5.. Microglia sub-clustering identifies distinct microglial subpopulations and uncovers a subset of microglia associated with apoE deficiency that show enhanced catabolism and suppressed mTOR activation
(A) Microglia subclusters in each genotype. (B) Relative frequency of microglia subclusters in different genotypes. (C-E) Hallmark genes and pathways in homeostatic microglia (cluster 0, 1) (C, D) and disease-associated microglia (cluster 2) (C, E). (F) Top upregulated and downregulated pathways with featured genes in apoE deficiency-associated microglia (cluster 4) compared to DAM microglia (cluster 2). (G) Violin plot showing upregulation of the lysosomal gene Lgmn in apoE deficiency-associated microglia (cluster 4). (H) qPCR for Lgmn in FACS-sorted microglia from 3-month WT, LDLR and EKO mice (n=3-4). (I, J) Western blot and quantification of LGMN in microglia acutely isolated from 3-month (I) and 20-month (J) WT, LDLR and EKO mice (n=3). (K) Enzyme activities of β-hexosaminidase (Hex), β-glucuronidase (Gluc) and N-Acetyl-Alpha-Glucosaminidase (Naglu) in cortices of 9-month WT, LDLR, EKO mice (n=3). (L) Western blot and quantification of phospho-4EBP in microglia acutely isolated from 11-month female P301S, P301S/LDLR, and P301S/EKO mice (n=2). (M, N) Western blot and quantification of phospho-4EBP in microglia acutely isolated from 20-month (M) and 3-month (N) WT, LDLR, and EKO mice (n=3). Data expressed as mean ± SEM, One-way ANOVA with Tukey’s post hoc test, two-sided for all quantifications. *p<0.05, **p<0.01, ****p<0.0001. Expression level on the Y-axis of violin plots is normalized, natural log-transformed gene count. See also Figure S5.
Figure 6.
Figure 6.. Astrocyte sub-clustering identifies homeostatic and reactive astrocytes and a subpopulation enriched in apoE-deficient and LDLR-overexpressing mice
(A) Astrocyte subclusters in each genotype. (B) Relative frequency of astrocyte subclusters in different genotypes. (C) Hallmark pathways and top enriched genes in homeostatic astrocytes (cluster 0, 1). (D) Volcano plot showing genes enriched in reactive astrocytes (cluster 2). (E) Top upregulated pathways in reactive astrocytes (cluster 2). (F) Staining of reactive astrocytes with GFAP and Vimentin in 9-month old WT, LDLR, EKO, P301S, P301S/LDLR, and P301S/EKO mice. Scale bar: 50μm.
Figure 7.
Figure 7.. ApoE-deficient and LDLR-overexpressing mice harbor an enlarged pool of oligodendrocyte progenitor cells, and show preserved myelin integrity in tauopathy
(A) Astrocyte subcluster 3 in Figure 6A, B shows hallmark genes and pathways of OPCs. (B) Staining of CSPG4 in all six groups of mice at 9-month of age (scale bar: 50μm). Inset shows enlarged image of OPCs (scale bar: 10μm). (C) Quantification of OPC density in the molecular layer of DG in the hippocampus (n=8-14) (D, E) MBP staining and quantification of MBP covered area in the molecular layer of DG (n=7-21). Above dash line: ML (molecular layer); below dash line: GCL (granule cell layer), scale bar: 25μm. (F) EM images of corpus callosum in posterior brain regions of 3-month P301S, 9-month P301S, 9-month P301S/LDLR, and 9-month P301S/EKO mice. Left: 25000X magnification, scale bar: 600nm; Right: 60000X magnification, scale bar: 200nm. Arrowheads point to axons with myelin damage. (G) Quantification of axonal G-ratio and the percentage of demyelinated axons (myelin layers ≤ 2) in EM images (n=1-4) (H, J) Staining and quantification of CD68 in the corpus callosum (n=9-21). Corpus callosum located between the two dashed lines. Scale bar: 50μm. (I, K) Staining and quantification of CSPG4 in the corpus callosum (n=9-16). Scale bar: 50μm. Data expressed as mean ± SEM, One-way ANOVA with Turkey’s post hoc test, two-sided for all quantifications. *p<0.05, **p<0.01, ***p<0.001, ****p<0.0001. See also Figure S6.

Comment in

References

    1. Bales KR, Verina T, Dodel RC, Du Y, Altstiel L, Bender M, Hyslop P, Johnstone EM, Little SP, Cummins DJ, et al. (1997). Lack of apolipoprotein E dramatically reduces amyloid beta-peptide deposition. Nat Genet 17, 263–264. 10.1038/ng1197-263. - DOI - PubMed
    1. Ben Haim L, Carrillo-de Sauvage MA, Ceyzeriat K, and Escartin C (2015). Elusive roles for reactive astrocytes in neurodegenerative diseases. Front Cell Neurosci 9, 278. 10.3389/fncel.2015.00278. - DOI - PMC - PubMed
    1. Benitez BA, and Sands MS (2017). Primary fibroblasts from CSPα mutation carriers recapitulate hallmarks of the adult onset neuronal ceroid lipofuscinosis. Sci Rep 7, 6332. 10.1038/s41598-017-06710-1. - DOI - PMC - PubMed
    1. Borchelt DR, Davis J, Fischer M, Lee MK, Slunt HH, Ratovitsky T, Regard J, Copeland NG, Jenkins NA, Sisodia SS, and Price DL (1996). A vector for expressing foreign genes in the brains and hearts of transgenic mice. Genetic Analysis: Biomolecular Engineering 13, 159–163. - PubMed
    1. Bories GFP, and Leitinger N (2017). Macrophage metabolism in atherosclerosis. FEBS Lett 591, 3042–3060. 10.1002/1873-3468.12786. - DOI - PubMed

Publication types

LinkOut - more resources