. 2021 Jun 22;18(1):141.
doi: 10.1186/s12974-021-02190-3.

Aging and high-fat diet feeding lead to peripheral insulin resistance and sex-dependent changes in brain of mouse model of tau pathology THY-Tau22

Affiliations

Aging and high-fat diet feeding lead to peripheral insulin resistance and sex-dependent changes in brain of mouse model of tau pathology THY-Tau22

Miroslava Kacířová et al. J Neuroinflammation. .

Abstract

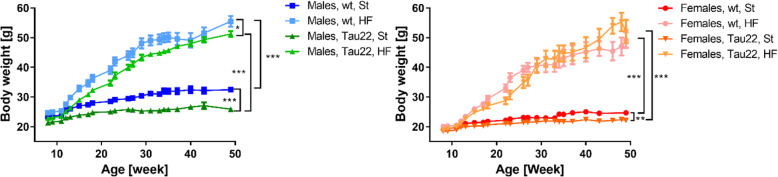
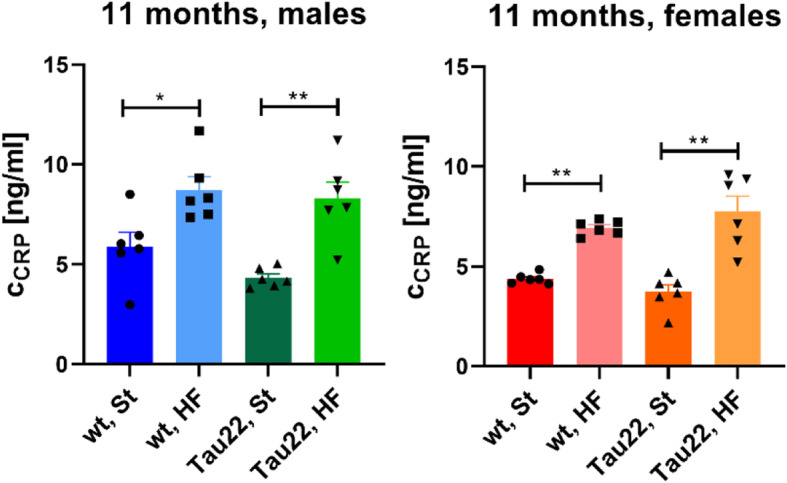
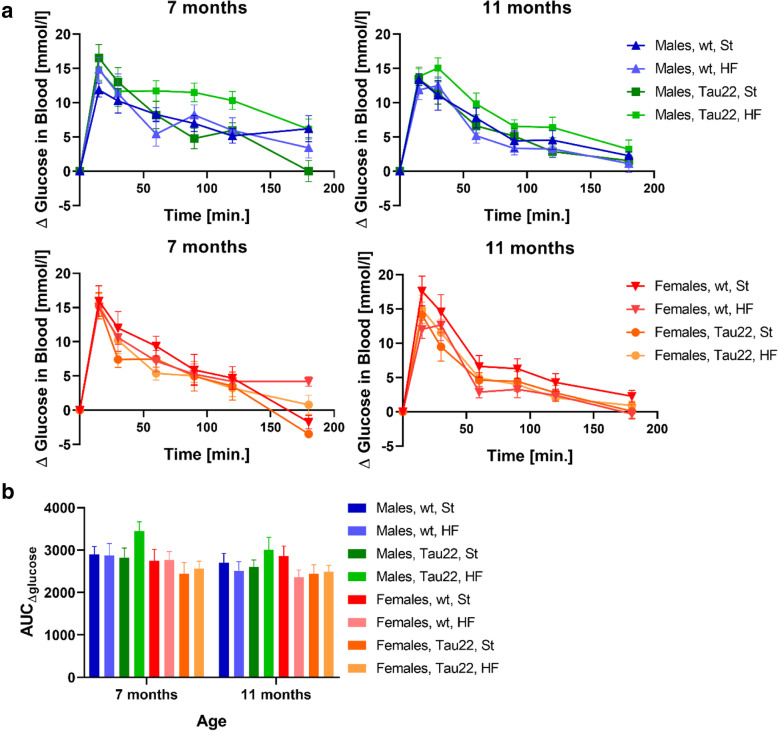
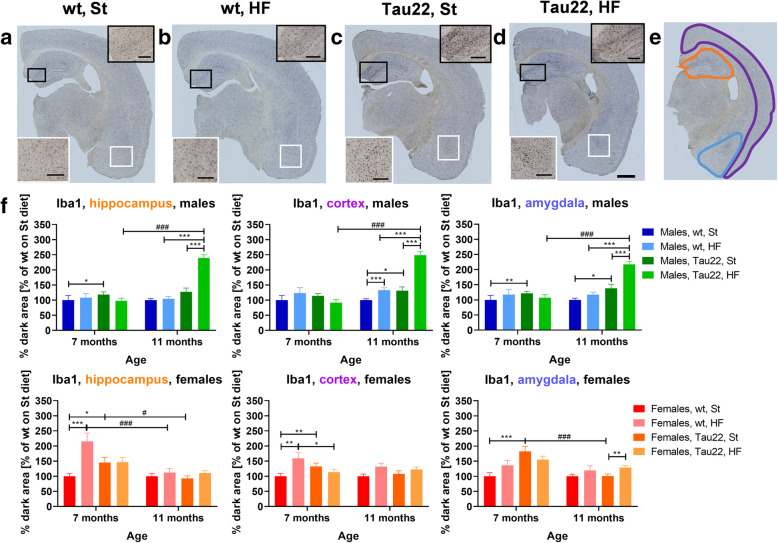
Background: Obesity leads to low-grade inflammation in the adipose tissue and liver and neuroinflammation in the brain. Obesity-induced insulin resistance (IR) and neuroinflammation seem to intensify neurodegeneration including Alzheimer's disease. In this study, the impact of high-fat (HF) diet-induced obesity on potential neuroinflammation and peripheral IR was tested separately in males and females of THY-Tau22 mice, a model of tau pathology expressing mutated human tau protein.

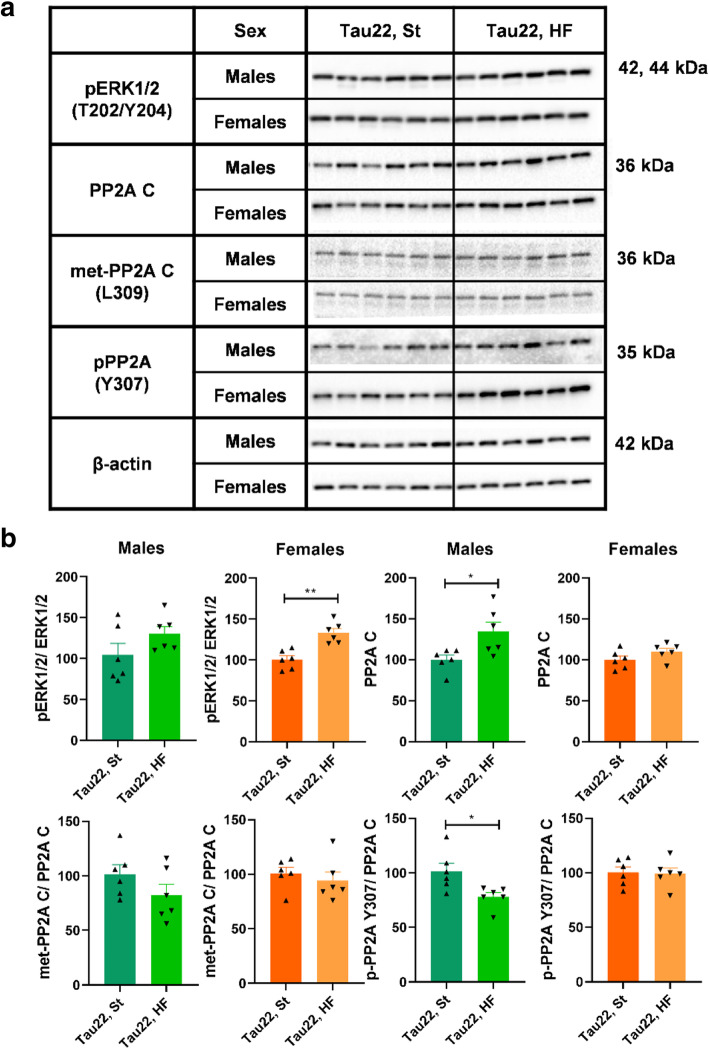
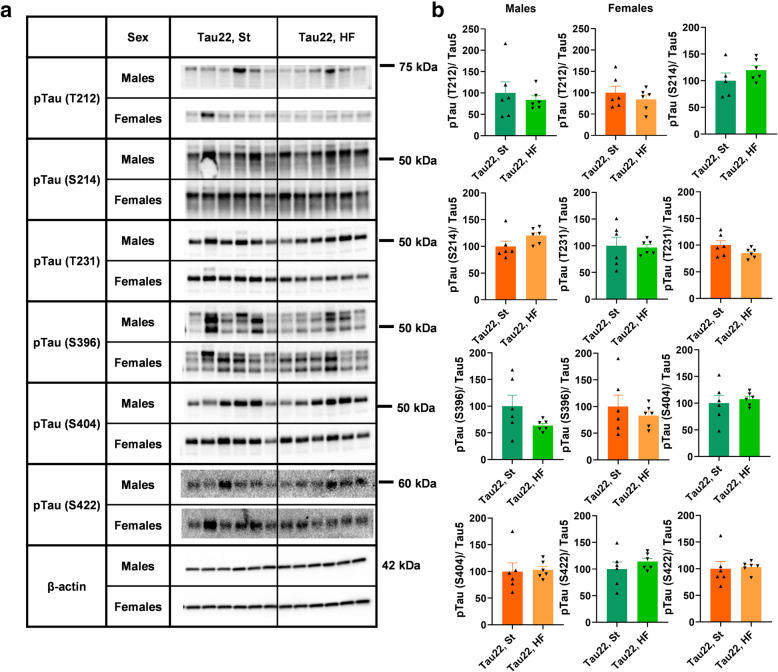
Methods: Three-, 7-, and 11-month-old THY-Tau22 and wild-type males and females were tested for mobility, anxiety-like behavior, and short-term spatial memory in open-field and Y-maze tests. Plasma insulin, free fatty acid, cholesterol, and leptin were evaluated with commercial assays. Liver was stained with hematoxylin and eosin for histology. Brain sections were 3',3'-diaminobenzidine (DAB) and/or fluorescently detected for ionized calcium-binding adapter molecule 1 (Iba1), glial fibrillary acidic protein (GFAP), and tau phosphorylated at T231 (pTau (T231)), and analyzed. Insulin signaling cascade, pTau, extracellular signal-regulated kinase 1/2 (ERK1/2), and protein phosphatase 2A (PP2A) were quantified by western blotting of hippocampi of 11-month-old mice. Data are mean ± SEM and were subjected to Mann-Whitney t test within age and sex and mixed-effects analysis and Bonferroni's post hoc test for age comparison.

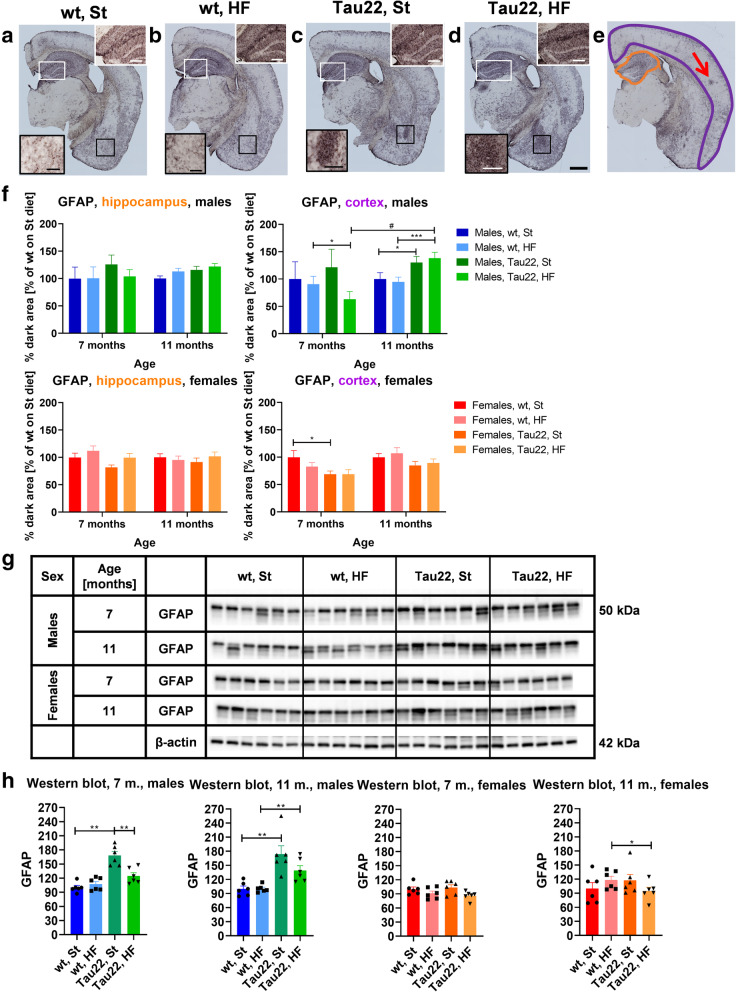
Results: Increased age most potently decreased mobility and increased anxiety in all mice. THY-Tau22 males showed impaired short-term spatial memory. HF diet increased body, fat, and liver weights and peripheral IR. HF diet-fed THY-Tau22 males showed massive Iba1+ microgliosis and GFAP+ astrocytosis in the hippocampus and amygdala. Activated astrocytes colocalized with pTau (T231) in THY-Tau22, although no significant difference in hippocampal tau phosphorylation was observed between 11-month-old HF and standard diet-fed THY-Tau22 mice. Eleven-month-old THY-Tau22 females, but not males, on both diets showed decreased synaptic and postsynaptic plasticity.

Conclusions: Significant sex differences in neurodegenerative signs were found in THY-Tau22. Impaired short-term spatial memory was observed in 11-month-old THY-tau22 males but not females, which corresponded to increased neuroinflammation colocalized with pTau(T231) in the hippocampi and amygdalae of THY-Tau22 males. A robust decrease in synaptic and postsynaptic plasticity was observed in 11-month-old females but not males. HF diet caused peripheral but not central IR in mice of both sexes.

Keywords: Alzheimer’s disease; Neuroinflammation; Obesity; Peripheral insulin resistance; Sex differences; THY-Tau22 mouse.


Conflict of interest statement

The authors declare that there are no competing interests associated with the manuscript.

Figures

Fig. 1
Fig. 1
Behavioral tests. a Open field (n = 7–14). b Y-maze (n = 6–14). Data are presented as mean ± SEM and were statistically analyzed by Mann-Whitney t test (*) within each age and sex group (*p < 0.05; **p < 0.01). The age comparison was performed by mixed-effects analysis and Bonferroni’s post hoc test (#). A value significance between 11 and 3, and 11 and 7 months in a particular group at an average velocity of open field test was ###p < 0.001 in all cases (not shown for clarity). NZ, new zone
Fig. 2
Fig. 2
Body weight of THY-Tau22 and wt mice. Males: n = 8–23, females: 7–21. Data are presented as mean ± SEM. The comparison of final weights (males: n = 8–14, females: 7–8) was statistically analyzed by Mann-Whitney t test (*p < 0.05; **p < 0.01; ***p < 0.001)
Fig. 3
Fig. 3
Adipose tissues weight of THY-Tau22 and wt mice. Subcutaneous (SCAT) and intraperitoneal (IPAT) adipose tissue weight of 3- (n = 4–5), 7- (n = 7–8), and 11-month-old (n = 7–14) mice. Data are presented as mean ± SEM and were statistically analyzed by Mann-Whitney t test within each age and sex group (*p < 0.05; **p < 0.01; ***p < 0.001)
Fig. 4
Fig. 4
Inflammation marker in the blood plasma. The concentration of C-reactive protein (CRP) in non-anesthetized fasting plasma of 11-month-old male and female mice (n = 6). Data are presented as mean ± SEM and were statistically analyzed by Mann-Whitney t test within each age and sex group (*p < 0.05; **p < 0.01)
Fig. 5
Fig. 5
Liver weight and liver steatosis of THY-Tau22 and wt mice. a Liver weight at 3, 7, and 11 months of age (males: n = 4–14, females: n = 4–8). Data are presented as mean ± SEM and were statistically analyzed by Mann-Whitney t test within each age and sex group (*p < 0.05; **p < 0.01; ***p < 0.001). b A representative figure of liver hematoxylin-eosin (HE) stained 11-month-old THY-Tau22 males on St (left) and HF (right) diet. C A representative figure of HE stained 11-month-old THY-Tau22 females on St (left) and HF (right) diet. Black-framed inserts in left down corners show a magnified area in black frames. Scale bar 200 μm, ×20 magnification
Fig. 6
Fig. 6
Oral glucose tolerance test (OGTT) in THY-Tau22 and wt mice. a OGTT results are shown as ΔGlucose profile in 7- and 11-months-old mice (n = 7–8 and 7–14, respectively). b Graph corresponds to the calculated areas under the curves (AUCΔglucose) from the a graphs. The data in b graph are presented as mean ± SEM and were statistically analyzed using non-parametric unpaired Kruskal-Wallis one-way ANOVA and Bonferroni’s post hoc test within each age and sex group. The age comparison was performed by mixed-effects analysis and Bonferroni’s post hoc test. No statistically significant difference was observed (p ≥ 0.05)
Fig. 7
Fig. 7
Microgliosis marker. Iba1 DAB-stained representative right hemisphere brain sections of 11-month-old males a wt on St diet, b wt on HF diet, c THY-Tau22 on St diet, d THY-Tau22 on HF diet. Black- and white-framed inserts in left down and up right corners show magnified areas in particular color frames. Scale bar for the whole section 500 μm, for inserts 200 μm. e A representative figure of analyzed areas: hippocampus (orange), cortex (purple), and amygdala (blue). f Relative quantification at particular analyzed area (e) at right hemisphere brain sections of 7- and 11-month-old THY-Tau22 and wt mice (n = 20–25 sections per 4 mice). Wt group on St diet was set as 100 %. Data are presented as mean ± SEM and were statistically analyzed using Mann-Whitney t test within each age and sex group (*). The age comparison of brain sections (f) was performed by mixed-effects analysis and Bonferroni’s post hoc test (#). Statistical significance for all measurements: *p < 0.05; **p < 0.01; ***p < 0.001. DAB 3′,3′-diaminobenzidine, Iba1 ionized calcium-binding adapter molecule 1
Fig. 8
Fig. 8
Astrocytosis marker. GFAP DAB-stained representative right hemisphere brain sections of 11-month-old males a wt on St diet, b wt on HF diet, c THY-Tau22 on St diet, d THY-Tau22 on HF diet. Black- and white-framed inserts in left down and up right corners show magnified area in particular color frames. Scale bar for the whole section 500 μm, for inserts 200 μm. e A representative figure of analyzed areas: hippocampus (orange), cortex (purple). The red arrow point to cluster of reactive astrocytes. f Relative quantification at particular analyzed area (e) at right hemisphere brain sections of 7- and 11-month-old THY-Tau22 and wt mice (n = 24 sections per 4 mice). Mouse wt group on St diet was set as 100 %. g Western blots of hippocampal GFAP. h Quantification of g western blots of hippocampal GFAP in 7- and 11-month-old mice (n = 6). Mouse wt group on St diet was set as 100 %. The intensity of GFAP was related to particular β-actin intensity. All data are presented as mean ± SEM and were statistically analyzed using Mann-Whitney t test within each age and sex group (*). The age comparison of brain sections (F) was performed by mixed-effects analysis and Bonferroni’s post hoc test (#). Statistical significance for all measurements: *p < 0.05; **p < 0.01; ***p < 0.001. DAB 3′,3′-diaminobenzidine, GFAP glial fibrillary acidic protein
Fig. 9
Fig. 9
Fluorescence-labeled THY-Tau22 and wt mouse brains. Colocalization of cell nuclei (blue DAPI), pTau (T231) (green AT180), and activated astrocytes (red GFAP). The representative figures of right hemisphere brain sections of a 7-month-old wt male mouse (upper pictures series) and THY-Tau22 mouse (lower pictures series), both on St diet, and b 11-month-old wt male mouse (upper pictures series) and THY-Tau22 male mouse (lower pictures series), both on HF diet, stained with particular fluorescence antibodies. White- and orange-framed inserts in left down and up right corners show magnified areas in particular color frames. Scale bar for whole brain section 500 μm, for inserts 200 μm. GFAP glial fibrillary acidic protein, DAPI 4′,6-diamidin-2-fenylindol
Fig. 10
Fig. 10
Western blots of hippocampal synaptic plasticity markers of 11-month-old THY-Tau22 and wt mice. a Western blots for specific proteins. B Quantification of (a) western blots. Data are presented as mean ± SEM and were statistically analyzed by Mann-Whitney t test within each age and sex group (*p < 0.05; **p < 0.01; n = 6). Mouse wt group on St diet was set as 100%. The intensity of all proteins was related to particular β-actin intensity. PSD95: postsynaptic density protein 95
Fig. 11
Fig. 11
Western blots of hippocampal insulin signaling pathway markers of 11-month-old THY-Tau22 and wt mice. a Western blots for specific proteins. b Quantification of (a) western blots. Data are presented as mean ± SEM and were statistically analyzed by Mann-Whitney t test within each age and sex group (*p < 0.05; **p < 0.01; n = 6). Mouse wt group on St diet was set as 100 %. The intensity of all proteins was related to particular β-actin intensity. The intensity of phosphorylated protein was related to the total protein. pAkt, phosphorylated protein kinase B; pPDK-1 (S241), phosphoinositide-dependent kinase-1 phosphorylated at S241 residue; pGSK-3β, glycogen synthase kinase 3β phosphorylated at S9 residue; PI3Kp85, p85 regulatory subunit of phosphoinositide 3-kinase
Fig. 12
Fig. 12
Western blots of hippocampal tau protein de/phosphorylation enzymes of 11-month-old THY-Tau22 mice. a Western blots for specific proteins. b Quantification of (a) western blots. Data are presented as mean ± SEM and were statistically analyzed by Mann-Whitney t test within each age and sex group (*p < 0.05; **p < 0.01; n = 6). Mouse THY-Tau22 group on St diet was set as 100 %. The intensity of all proteins was related to particular β-actin intensity. The intensity of modified protein was related to the total protein. pERK1/2, extracellular signal-regulated kinase phosphorylated at T202/Y204 residues; PP2A C, C subunit of protein phosphatase 2A; met-PP2A C (L309), methylated C subunit of PP2A at L309 residue; pPP2A C (Y307), PP2A C phosphorylated at Y307 residue
Fig. 13
Fig. 13
Western blots of hippocampal phosphorylated tau proteins of 11-month-old THY-Tau22 mice. a Western blots for specific proteins. b Quantification of (a) western blots. Data are presented as mean ± SEM and were statistically analyzed using Mann-Whitney t test within each age and sex group. No statistically significant difference was observed. (p ≥ 0.05; n = 5–6). Mouse THY-Tau22 group on St diet was set as 100%. The intensity of phosphorylated tau proteins was related to the Tau5 total protein

References

    1. Bray GA. Medical consequences of obesity. J Clin Endocrinol Metab. 2004;89(6):2583–2589. doi: 10.1210/jc.2004-0535. - DOI - PubMed
    1. Kacirova M, Zmeskalova A, Korinkova L, Zelezna B, Kunes J, Maletinska L. Inflammation: major denominator of obesity, Type 2 diabetes and Alzheimer’s disease-like pathology? Clin Sci (Lond). 2020;134(5):547–570. doi: 10.1042/CS20191313. - DOI - PubMed
    1. Guillemot-Legris O, Muccioli GG. Obesity-Induced Neuroinflammation: Beyond the Hypothalamus. Trends Neurosci. 2017;40(4):237–253. doi: 10.1016/j.tins.2017.02.005. - DOI - PubMed
    1. Korinkova L, Holubova M, Neprasova B, Hruba L, Prazienkova V, Bencze M, et al. Synergistic effect of leptin and lipidized PrRP on metabolic pathways in ob/ob mice. J Mol Endocrinol. 2020;64(2):77–90. doi: 10.1530/JME-19-0188. - DOI - PubMed
    1. Alford S, Patel D, Perakakis N, Mantzoros CS. Obesity as a risk factor for Alzheimer’s disease: weighing the evidence. Obes Rev. 2018;19(2):269–280. doi: 10.1111/obr.12629. - DOI - PubMed

MeSH terms