

Characterizing the Clinical Features and Atrophy Patterns of MAPT-Related Frontotemporal Dementia With Disease Progression Modeling
- PMID: 34158384
- PMCID: PMC8408507
- DOI: 10.1212/WNL.0000000000012410
Characterizing the Clinical Features and Atrophy Patterns of MAPT-Related Frontotemporal Dementia With Disease Progression Modeling
Abstract
Background and objective: Mutations in the MAPT gene cause frontotemporal dementia (FTD). Most previous studies investigating the neuroanatomical signature of MAPT mutations have grouped all different mutations together and shown an association with focal atrophy of the temporal lobe. The variability in atrophy patterns between each particular MAPT mutation is less well-characterized. We aimed to investigate whether there were distinct groups of MAPT mutation carriers based on their neuroanatomical signature.
Methods: We applied Subtype and Stage Inference (SuStaIn), an unsupervised machine learning technique that identifies groups of individuals with distinct progression patterns, to characterize patterns of regional atrophy in MAPT-associated FTD within the Genetic FTD Initiative (GENFI) cohort study.
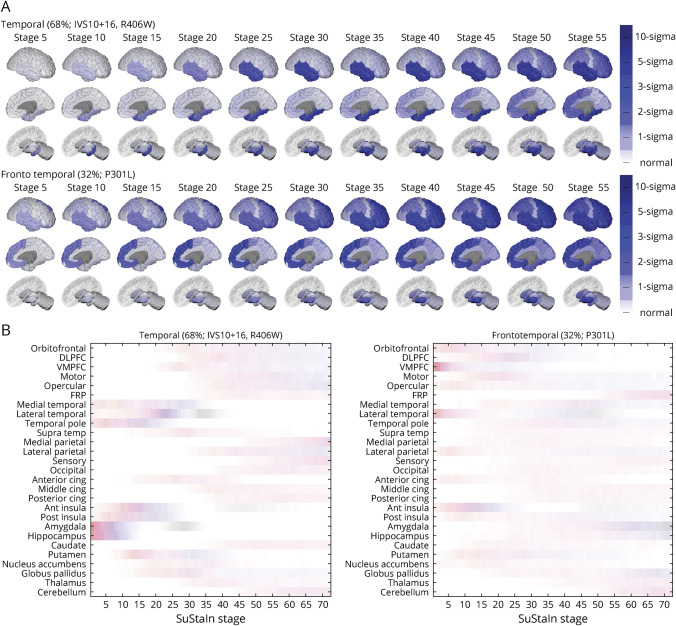
Results: Eighty-two MAPT mutation carriers were analyzed, the majority of whom had P301L, IVS10+16, or R406W mutations, along with 48 healthy noncarriers. SuStaIn identified 2 groups of MAPT mutation carriers with distinct atrophy patterns: a temporal subtype, in which atrophy was most prominent in the hippocampus, amygdala, temporal cortex, and insula; and a frontotemporal subtype, in which atrophy was more localized to the lateral temporal lobe and anterior insula, as well as the orbitofrontal and ventromedial prefrontal cortex and anterior cingulate. There was one-to-one mapping between IVS10+16 and R406W mutations and the temporal subtype and near one-to-one mapping between P301L mutations and the frontotemporal subtype. There were differences in clinical symptoms and neuropsychological test scores between subtypes: the temporal subtype was associated with amnestic symptoms, whereas the frontotemporal subtype was associated with executive dysfunction.
Conclusion: Our results demonstrate that different MAPT mutations give rise to distinct atrophy patterns and clinical phenotype, providing insights into the underlying disease biology and potential utility for patient stratification in therapeutic trials.
Copyright © 2021 The Author(s). Published by Wolters Kluwer Health, Inc. on behalf of the American Academy of Neurology.
Figures
Similar articles
-
Distinct patterns of brain atrophy in Genetic Frontotemporal Dementia Initiative (GENFI) cohort revealed by visual rating scales.Alzheimers Res Ther. 2018 May 24;10(1):46. doi: 10.1186/s13195-018-0376-9. Alzheimers Res Ther. 2018. PMID: 29793546 Free PMC article.
-
Patterns of gray matter atrophy in genetic frontotemporal dementia: results from the GENFI study.Neurobiol Aging. 2018 Feb;62:191-196. doi: 10.1016/j.neurobiolaging.2017.10.008. Epub 2017 Oct 19. Neurobiol Aging. 2018. PMID: 29172163 Free PMC article.
-
Brain atrophy over time in genetic and sporadic frontotemporal dementia: a study of 198 serial magnetic resonance images.Eur J Neurol. 2015 May;22(5):745-52. doi: 10.1111/ene.12675. Epub 2015 Feb 12. Eur J Neurol. 2015. PMID: 25683866 Free PMC article.
-
Intrafamilial phenotypic heterogeneity in a Taiwanese family with a MAPT p.R5H mutation: a case report and literature review.BMC Neurol. 2017 Sep 18;17(1):186. doi: 10.1186/s12883-017-0966-3. BMC Neurol. 2017. PMID: 28923025 Free PMC article. Review.
-
Phenotypic signatures of genetic frontotemporal dementia.Curr Opin Neurol. 2011 Dec;24(6):542-9. doi: 10.1097/WCO.0b013e32834cd442. Curr Opin Neurol. 2011. PMID: 21986680 Review.
Cited by
-
Defining the presymptomatic phase of frontotemporal dementia.Curr Opin Neurol. 2023 Aug 1;36(4):276-282. doi: 10.1097/WCO.0000000000001174. Epub 2023 Jun 23. Curr Opin Neurol. 2023. PMID: 37340685 Free PMC article. Review.
-
Ordinal SuStaIn: Subtype and Stage Inference for Clinical Scores, Visual Ratings, and Other Ordinal Data.Front Artif Intell. 2021 Aug 12;4:613261. doi: 10.3389/frai.2021.613261. eCollection 2021. Front Artif Intell. 2021. PMID: 34458723 Free PMC article.
-
Estimated Disease Progression Trajectory of White Matter Disruption in Unilateral Temporal Lobe Epilepsy: A Data-Driven Machine Learning Approach.Brain Sci. 2024 Sep 29;14(10):992. doi: 10.3390/brainsci14100992. Brain Sci. 2024. PMID: 39452006 Free PMC article.
-
Presymptomatic and early pathological features of MAPT-associated frontotemporal lobar degeneration.Acta Neuropathol Commun. 2023 Aug 2;11(1):126. doi: 10.1186/s40478-023-01588-9. Acta Neuropathol Commun. 2023. PMID: 37533060 Free PMC article.
-
Identification of four biotypes in temporal lobe epilepsy via machine learning on brain images.Nat Commun. 2024 Mar 12;15(1):2221. doi: 10.1038/s41467-024-46629-6. Nat Commun. 2024. PMID: 38472252 Free PMC article.