

Undiagnosed SARS-CoV-2 seropositivity during the first 6 months of the COVID-19 pandemic in the United States
- PMID: 34158410
- PMCID: PMC8432952
- DOI: 10.1126/scitranslmed.abh3826
Undiagnosed SARS-CoV-2 seropositivity during the first 6 months of the COVID-19 pandemic in the United States
Abstract
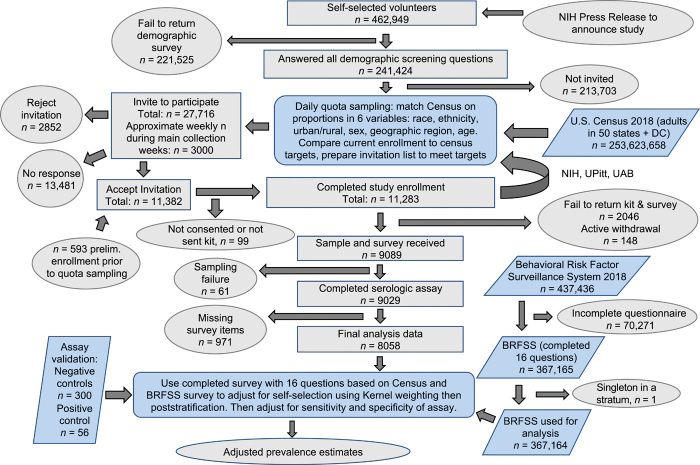
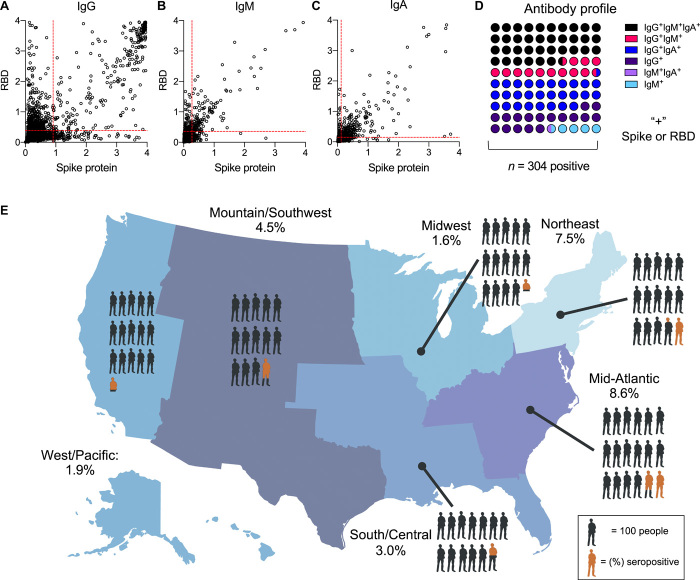
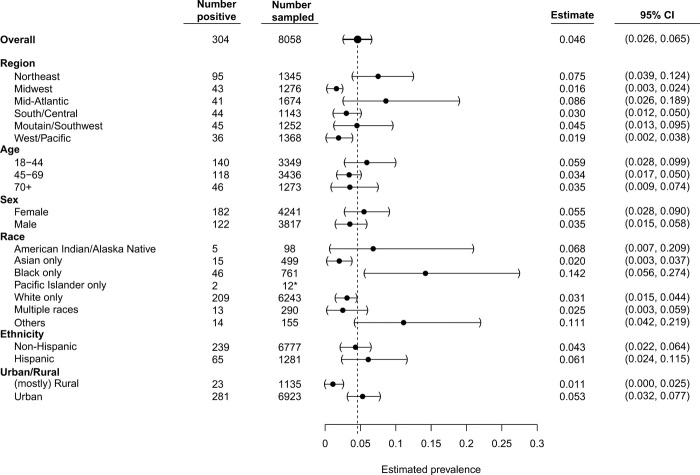
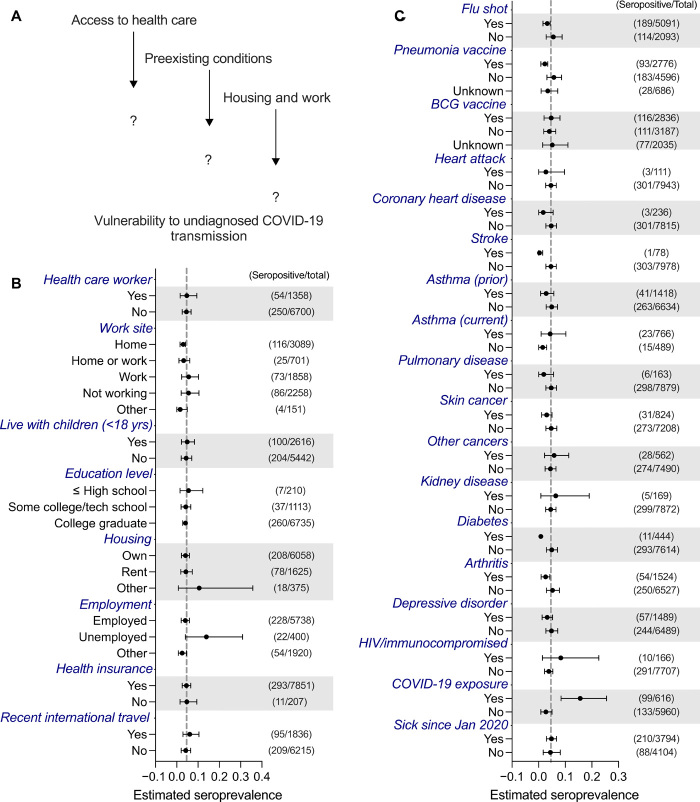
Asymptomatic SARS-CoV-2 infection and delayed implementation of diagnostics have led to poorly defined viral prevalence rates in the United States and elsewhere. To address this, we analyzed seropositivity in 9089 adults in the United States who had not been diagnosed previously with COVID-19. Individuals with characteristics that reflected the U.S. population (n = 27,716) were selected by quota sampling from 462,949 volunteers. Enrolled participants (n = 11,382) provided medical, geographic, demographic, and socioeconomic information and dried blood samples. Survey questions coincident with the Behavioral Risk Factor Surveillance System survey, a large probability-based national survey, were used to adjust for selection bias. Most blood samples (88.7%) were collected between 10 May and 31 July 2020 and were processed using ELISA to measure seropositivity (IgG and IgM antibodies against SARS-CoV-2 spike protein and the spike protein receptor binding domain). The overall weighted undiagnosed seropositivity estimate was 4.6% (95% CI, 2.6 to 6.5%), with race, age, sex, ethnicity, and urban/rural subgroup estimates ranging from 1.1% to 14.2%. The highest seropositivity estimates were in African American participants; younger, female, and Hispanic participants; and residents of urban centers. These data indicate that there were 4.8 undiagnosed SARS-CoV-2 infections for every diagnosed case of COVID-19, and an estimated 16.8 million infections were undiagnosed by mid-July 2020 in the United States.
Copyright © 2021 The Authors, some rights reserved; exclusive licensee American Association for the Advancement of Science. No claim to original U.S. Government Works. Distributed under a Creative Commons Attribution License 4.0 (CC BY).
Figures
Update of
-
Mapping a Pandemic: SARS-CoV-2 Seropositivity in the United States.medRxiv [Preprint]. 2021 Jan 31:2021.01.27.21250570. doi: 10.1101/2021.01.27.21250570. medRxiv. 2021. Update in: Sci Transl Med. 2021 Jul 7;13(601):eabh3826. doi: 10.1126/scitranslmed.abh3826. PMID: 33532807 Free PMC article. Updated. Preprint.
References
-
- Huang A. T., Garcia-Carreras B., Hitchings M. D. T., Yang B., Katzelnick L. C., Rattigan S. M., Borgert B. A., Moreno C. A., Solomon B. D., Rodriguez-Barraquer I., Lessler J., Salje H., Burke D., Wesolowski A., Cummings D. A. T., A systematic review of antibody mediated immunity to coronaviruses: Kinetics, correlates of protection, and association with severity. Nat. Commun. 11, 4704 (2020). - PMC - PubMed
-
- Long Q.-X., Liu B.-Z., Deng H.-J., Wu G.-C., Deng K., Chen Y.-K., Liao P., Qiu J.-F., Lin Y., Cai X.-F., Wang D.-Q., Hu Y., Ren J.-H., Tang N., Xu Y.-Y., Yu L.-H., Mo Z., Gong F., Zhang X.-L., Tian W.-G., Hu L., Zhang X.-X., Xiang J.-L., Du H.-X., Liu H.-W., Lang C.-H., Luo X.-H., Wu S.-B., Cui X.-P., Zhou Z., Zhu M.-M., Wang J., Xue C.-J., Li X.-F., Wang L., Li Z.-J., Wang K., Niu C.-C., Yang Q.-J., Tang X.-J., Zhang Y., Liu X.-M., Li J.-J., Zhang D.-C., Zhang F., Liu P., Yuan J., Li Q., Hu J.-L., Chen J., Huang A.-L., Antibody responses to SARS-CoV-2 in patients with COVID-19. Nat. Med. 26, 845–848 (2020). - PubMed
Publication types
MeSH terms
Substances
Grants and funding
LinkOut - more resources
Full Text Sources
Medical
Miscellaneous
