. 2021 Jul 14;13(602):eabg4262.
doi: 10.1126/scitranslmed.abg4262. Epub 2021 Jun 22.

Key epidemiological drivers and impact of interventions in the 2020 SARS-CoV-2 epidemic in England

Affiliations

Key epidemiological drivers and impact of interventions in the 2020 SARS-CoV-2 epidemic in England

Edward S Knock et al. Sci Transl Med. .

Abstract

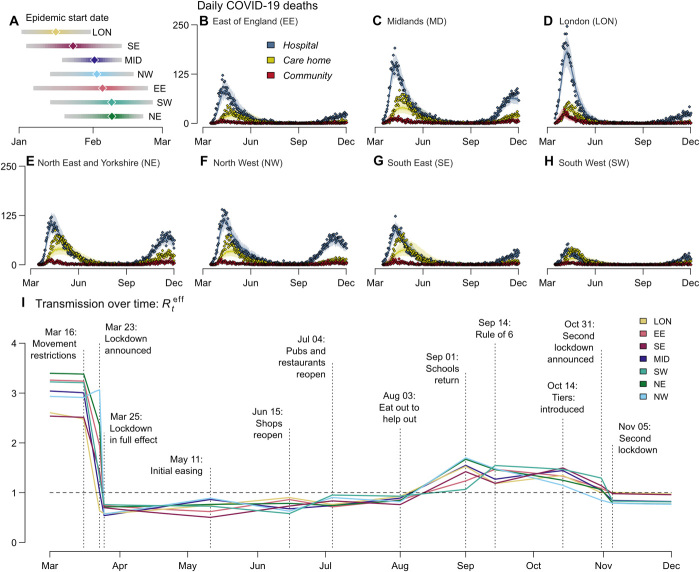
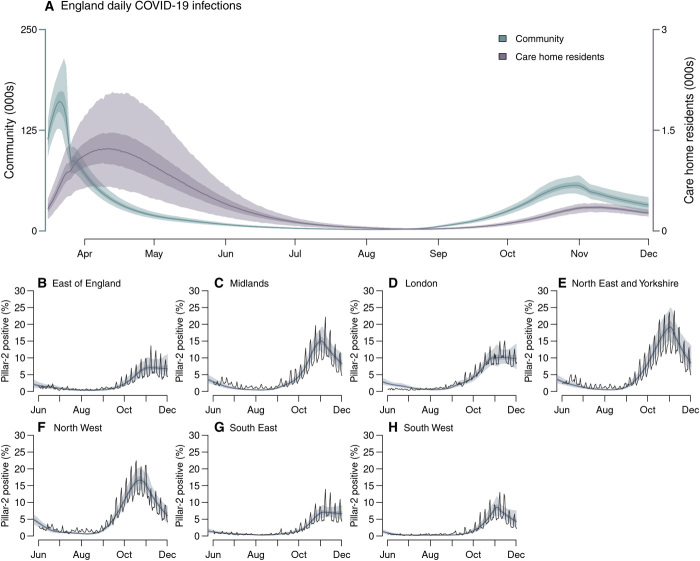
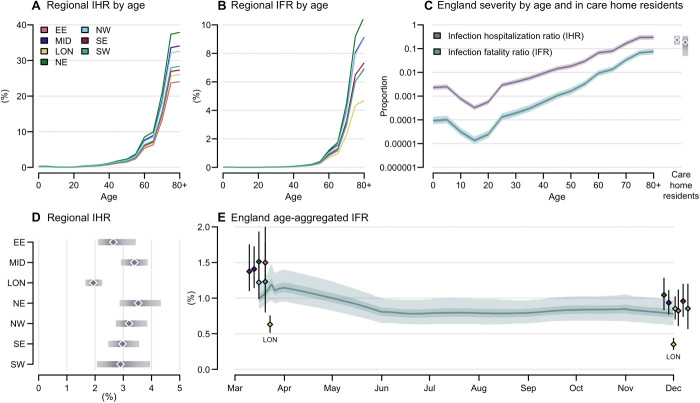
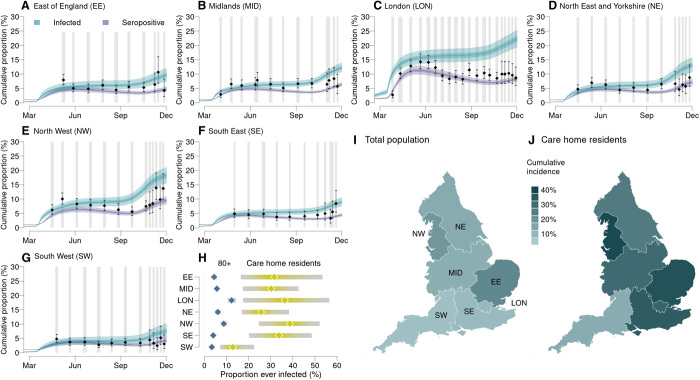
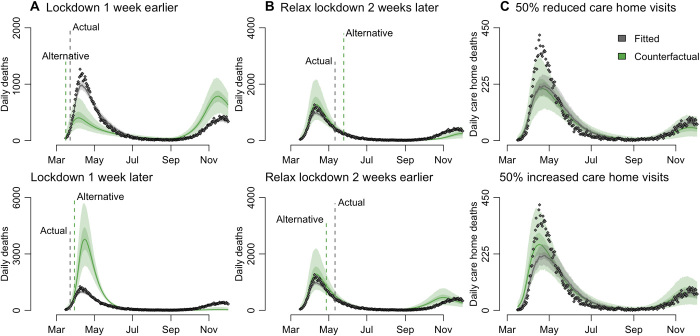
We fitted a model of SARS-CoV-2 transmission in care homes and the community to regional surveillance data for England. Compared with other approaches, our model provides a synthesis of multiple surveillance data streams into a single coherent modeling framework, allowing transmission and severity to be disentangled from features of the surveillance system. Of the control measures implemented, only national lockdown brought the reproduction number (Rt eff) below 1 consistently; if introduced 1 week earlier, it could have reduced deaths in the first wave from an estimated 48,600 to 25,600 [95% credible interval (CrI): 15,900 to 38,400]. The infection fatality ratio decreased from 1.00% (95% CrI: 0.85 to 1.21%) to 0.79% (95% CrI: 0.63 to 0.99%), suggesting improved clinical care. The infection fatality ratio was higher in the elderly residing in care homes (23.3%, 95% CrI: 14.7 to 35.2%) than those residing in the community (7.9%, 95% CrI: 5.9 to 10.3%). On 2 December 2020, England was still far from herd immunity, with regional cumulative infection incidence between 7.6% (95% CrI: 5.4 to 10.2%) and 22.3% (95% CrI: 19.4 to 25.4%) of the population. Therefore, any vaccination campaign will need to achieve high coverage and a high degree of protection in vaccinated individuals to allow nonpharmaceutical interventions to be lifted without a resurgence of transmission.


Figures

Fig. 1
Fig. 1. Trajectory of the England COVID-19 epidemic.
(A) Inferred epidemic start date in each NHS England region. (B to H) Model fit to reported daily deaths from COVID-19 in care homes, hospitals, and in the community (that is, neither in a hospital nor a care home) for each NHS England region. Points show the daily data (see section S1.1.2 for details of data sources) (1). Solid lines show the median posterior, and the shaded area shows the 95% CrI. (I) Mean estimated effective reproduction number within the general community (excluding care homes) in each region from March to December 2020. Vertical lines and labels represent dates of key policy changes, defining the breaking points of the underlying piecewise linear transmission rate. Dashed horizontal line depicts a reproduction number (R0) of 1.
Fig. 2
Fig. 2. Infection incidence and case positivity over time.
(A) Inferred daily SARS-CoV-2 infections in England care home residents (excluding care home workers; right axis) and the wider community (left axis). (B to H) Comparison of modeled (shaded bands) and observed (solid line) proportion of PCR tests that were positive under pillar-2 testing (community swab testing for symptomatic individuals) in >25-year-olds. Shaded bands depict 95% CrI, 50% CrI, and median model outputs.
Fig. 3
Fig. 3. Age-dependent probabilities of progression through hospital pathways.
(A) Probability of admission to ICU. (B) Probability of death in a general hospital ward. (C) Probability of death in an ICU. (D) Probability of death in hospital during stepdown care. (E) Probability of death through all hospital pathways [obtained by combining (B) to (D) using the branching structure shown in fig. S4]. Black circles and vertical segments show the posterior mean and 95% CrI of splines fitted to data, and blue circles and vertical segments show raw data mean values and 95% confidence intervals (exact binomial) for each 5-year age group. (F) Average estimated length of stay in each ward (posterior mean and 95% CrI).
Fig. 4
Fig. 4. Estimated relative severity of disease by age group and region.
(A and B) Variation in (A) the median inferred infection fatality ratio (IFR) and (B) infection hospitalization ratio (IHR) by age group in each region. Ages 80+ were modeled as a single risk group; care home residents were not included. (C) Estimated England IFR and IHR by age group and in care home residents (estimate excludes care home workers). National severity estimates are produced by aggregating regional estimates on the basis of infection incidence. (D) Regional estimated IHR, aggregated over age and risk group by infection incidence. Plots in (A) to (D) use parameter estimates and incidence weightings calculated as of 1 December 2020. (E) Estimated England IFR over time; colored dots show regional estimates of IFR at the start of the epidemic and on 1 December 2020 [clusters each correspond to one time point, London (LON)]. In (C) to (E), shaded bands depict 95% CrI and interquartile ranges, and points depict medians.
Fig. 5
Fig. 5. Cumulative COVID-19 incidence and seropositivity by region.
(A to G) Comparison of the estimated proportion of the population testing seropositive in 2020 with observations from serological surveys [see section S1.1.4 (14)]. Vertical gray shaded bands show serological survey timings, black points show the observed seroprevalence (bars, 95% exact confidence intervals), and blue and purple lines show the proportion of the population infected and seropositive, respectively, as inferred from our model (shaded bands show the 95% CrI, 50% CrI, and median). (H) Comparison by region of the estimated cumulative attack rate (median and 95% CrI) in care home residents (yellow, excludes care home workers) versus in the 80+ age group in the community (blue). The estimated mean final epidemic size in each England NHS region (I) in total and (J) in care home residents (excludes care home workers).
Fig. 6
Fig. 6. Counterfactual analysis of the impact on mortality aggregated across NHS England regions.
We estimated the impact of (A) initiating lockdown 1 week earlier/later, (B) relaxing lockdown 2 weeks earlier/later, and (C) in response to 50% more/less restricted care home visits from March to November. (A) and (B) present counterfactual outcomes for daily deaths in England but have different y-axis scales to better highlight differences between the observed data and each alternative lockdown scenario. In all panels, gray dots depict data [see section S1.1.2 for details of data sources (1)]. Gray and green solid lines show the posterior median for the fitted and counterfactual model, respectively, and shaded bands depict the corresponding 95% CrI and interquartile ranges. Vertical dashed lines indicate the timings of the actual and alternative (used in the counterfactual analysis) interventions, respectively. Figure S3 presents a regional breakdown of this figure.

References

    1. GOV.UK, Coronavirus (COVID-19) in the UK (2020).
    1. Mahase E., Covid-19: UK records first death, as world’s cases exceed 100 000. BMJ 368, m1294 (2020). - PubMed
    1. GOV.UK, Prime Minister’s statement on coronavirus (COVID-19): 20 March 2020 - GOV.UK (2020).
    1. Jeffrey B., Walters C. E., Ainslie K. E. C., Eales O., Ciavarella C., Bhatia S., Hayes S., Baguelin M., Boonyasiri A., Brazeau N. F., Cuomo-Dannenburg G., FitzJohn R. G., Gaythorpe K., Green W., Imai N., Mellan T. A., Mishra S., Nouvellet P., Unwin H. J. T., Verity R., Vollmer M., Whittaker C., Ferguson N. M., Donnelly C. A., Riley S., Anonymised and aggregated crowd level mobility data from mobile phones suggests that initial compliance with covid-19 social distancing interventions was high and geographically consistent across the UK. Wellcome Open Res. 5, 170 (2020). - PMC - PubMed
    1. Care Quality Commission, [ARCHIVED CONTENT] UK Government Web Archive - The National Archives, https://webarchive.nationalarchives.gov.uk/20200605160439/https://www.cq... (2020).

Publication types