. 2021 Jun 22;12(1):3823.
doi: 10.1038/s41467-021-23671-2.

Preference uncertainty accounts for developmental effects on susceptibility to peer influence in adolescence

Collaborators, Affiliations

Preference uncertainty accounts for developmental effects on susceptibility to peer influence in adolescence

Andrea M F Reiter et al. Nat Commun. .

Abstract

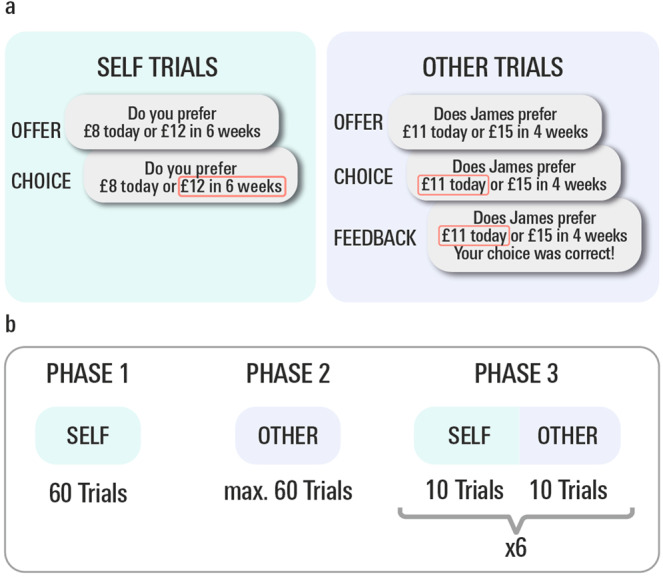
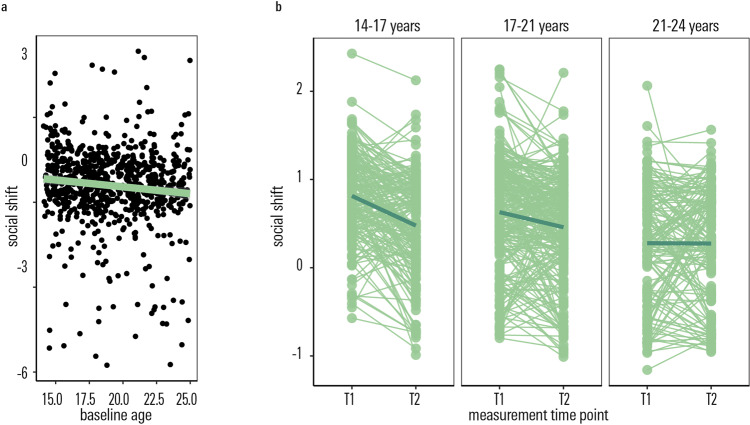
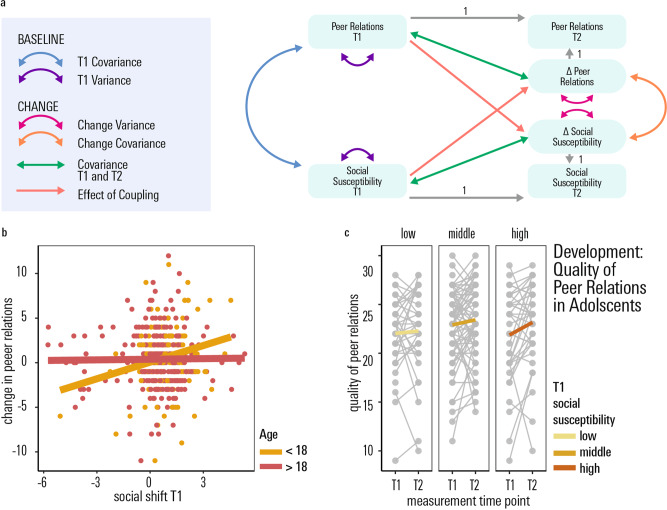
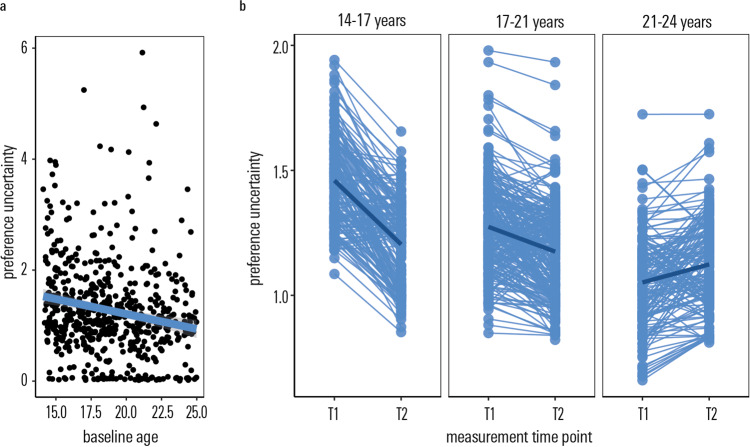
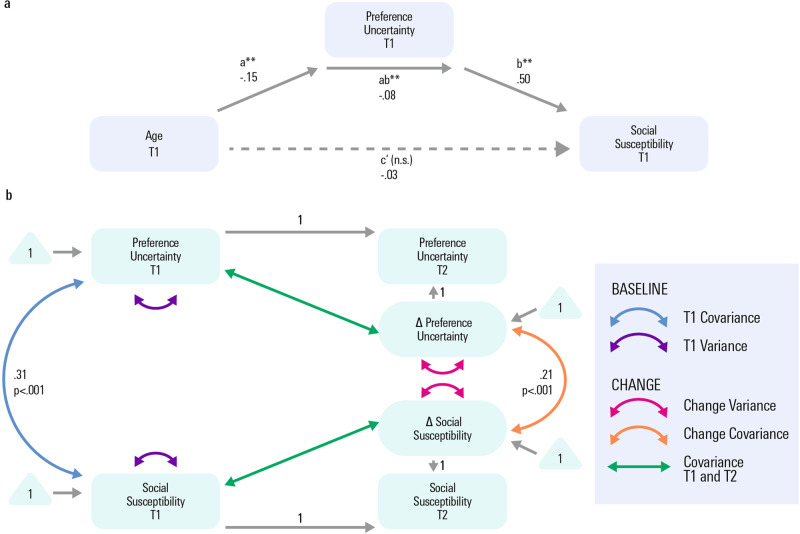
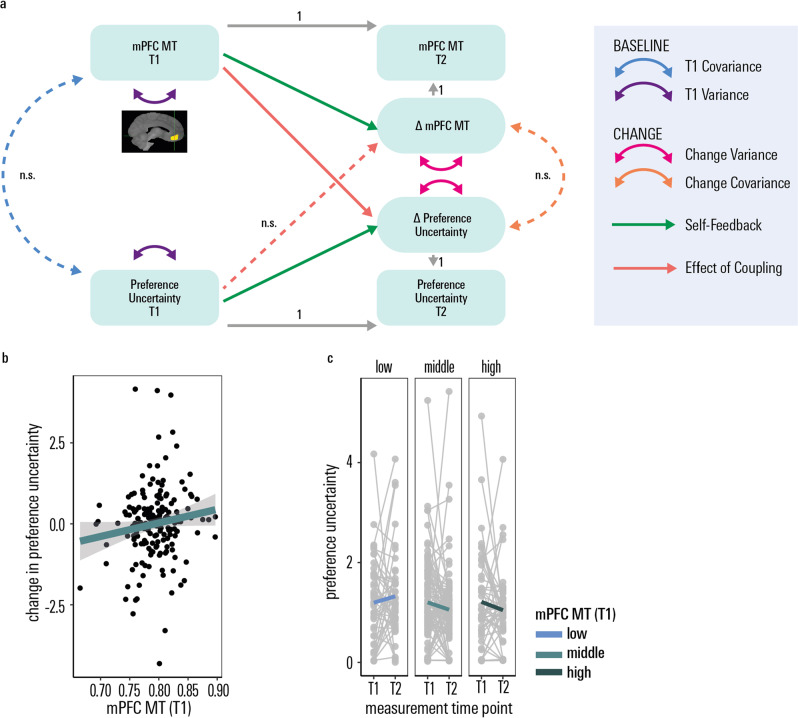
Adolescents are prone to social influence from peers, with implications for development, both adaptive and maladaptive. Here, using a computer-based paradigm, we replicate a cross-sectional effect of more susceptibility to peer influence in a large dataset of adolescents 14 to 24 years old. Crucially, we extend this finding by adopting a longitudinal perspective, showing that a within-person susceptibility to social influence decreases over a 1.5 year follow-up time period. Exploiting this longitudinal design, we show that susceptibility to social influences at baseline predicts an improvement in peer relations over the follow-up period. Using a Bayesian computational model, we demonstrate that in younger adolescents a greater tendency to adopt others' preferences arises out of a higher uncertainty about their own preferences in the paradigmatic case of delay discounting (a phenomenon called 'preference uncertainty'). This preference uncertainty decreases over time and, in turn, leads to a reduced susceptibility of one's own behaviour to an influence from others. Neuro-developmentally, we show that a measure of myelination within medial prefrontal cortex, estimated at baseline, predicts a developmental decrease in preference uncertainty at follow-up. Thus, using computational and neural evidence, we reveal adaptive mechanisms underpinning susceptibility to social influence during adolescence.


Conflict of interest statement

The authors declare no competing interests.

Figures

Fig. 1
Fig. 1. Social delay discounting task.
a Example trial for ‘self’ and ‘other’ trial types. In self trials, participants see an offer of a smaller amount of money they can receive on the same day or a larger amount of money they can receive after a variable delay period. Subjects were instructed to indicate their preference according to their true personal preference and, to enforce expression of true preferences, they were told that one trial would be chosen at random to determine their pay out. In ‘other’ trials, subjects chose between the smaller, immediate and the larger, delayed option on behalf of another person, and received feedback on these choices thereby enabling them to learn the others’ delay discounting preferences. Individual scores of susceptibility to social influence were defined as the degree of change in one’s own discount rate towards the preference of a social partner (i.e., log kself_phase3 – log kself_phase1). b Experimental Design. In phase 1, participants completed 60 ‘self’ trials, in phase 2, participants engaged in ‘other’ trials for a minimum of 20 trials, until either the participant got eight correct answers out of the most recent 10 trials, or until 60 learning trials were completed.
Fig. 2
Fig. 2. Developmental effects on social susceptibility as measured by preference shifts in the delay discounting task.
a A tendency to show a peer-induced shift in delay discounting preferences (positive values indicate a change towards the partner) declines with age. The error band denotes the 95% confidence level interval. b Such susceptibility to peer influence also decreases within person over the course of the longitudinal follow-up period. We plot posterior estimates from our mixed effects model. Note that baseline age entered the model as a continuous regressor, here we plot 4-year-age bins ≤17 years old, >17 – ≤21 years old, >21 years old, for visualisation purposes alone. T1 measurement time point 1, baseline assessment; T2 measurement time point 2, follow-up assessment after ~1–5 years. Source data are provided as a Source Data file.
Fig. 3
Fig. 3. Social susceptibility and the development of peer relations.
a Schematic of the latent change score model of the longitudinal development of social susceptibility in our task, the longitudinal development of real-life psycho-social functioning (perceived quality of peer relations) from baseline to long follow-up (~1.5 years later) as well as their co-development. Social susceptibility at time point 1 significantly predicts an increase in the quality of peer relationships within the follow-up period. b This positive association was driven by the younger (< 18 years old) people in our sample, but was not significant in those aged 18 or older. The full set of parameter estimates is included in the Supplementary Table 1. Error bands denote the 95% confidence level interval. c Change in the quality of peer relations in the adolescent subgroup (<18 years), plotted as a function of T1 Social susceptibility. T1 measurement time point 1, baseline assessment; T2 measurement time point 2, follow-up assessment after ~1–5 years. Source data are provided as a Source Data file.
Fig. 4
Fig. 4. Development of preference uncertainty.
Preference uncertainty decreases cross-sectionally (a) and over the 1.5-year follow-up (b). This decrease is most pronounced in the youngest participants (in terms of baseline age). We plot posterior estimates of our mixed model analysis. The error band denotes the 95% confidence level interval. Note that baseline age entered the model as a continuous regressor, here we plot 4-year-age bins ≤17 years old, >17 ≤21 years old, >21 years old, only for visualisation purposes. T1 measurement time point 1, baseline assessment; T2 measurement time point 2, follow-up assessment after ~1–5 years. Source data are provided as a Source Data file.
Fig. 5
Fig. 5. Mediation analyses testing for a mediating role of preference uncertainty for the relationship of development with social susceptibility.
a Mediation analysis for social susceptibility (i.e. preference shift measured in our delay discounting task) as predicted from age and mediated by preference uncertainty at T1. Age predicted preference uncertainty (path a). The mediator (preference uncertainty) predicted preference shift (path b, controlled for the age effect on preference uncertainty). Importantly, the mediation effect was significant (path ab). The direct path c’, namely the age effect on preference shift after accounting for the mediation, was not significant. The proportion of total variance accounted for by the mediation effect was significant. Thus, the age effect on social susceptibility at baseline was accounted for by preference uncertainty. b In line with our assumption that development of social susceptibility is accounted for by development of preference uncertainty, the bivariate latent change score model not only showed a significant covariation of preference uncertainty with social susceptibility at T1, but also significant covariation of the rate of longitudinal change in both domains. The full set of parameter estimates is included in Supplementary Information Table 2. n.s. not significant, T1 measurement time point 1, baseline assessment; T2 measurement time point 2, follow-up assessment after ~1–5 years.; ** denotes p < 0.001 Source data are provided as a Source Data file.
Fig. 6
Fig. 6. Association of preference uncertainty with the mPFC myelin marker.
a Bivariate latent change score model. Three developmental brain-behaviour relationships are possible and tested for by the model: (1) differences in myelin at baseline affect the rate of preference uncertainty decrease; (2) preference uncertainty at baseline predicts the degree of myelin gain between baseline and long follow-up, (3) correlated change (the degree of reduction in preference uncertainty is correlated with the degree of myelin marker change). While the path indicating the mPFC myelin marker (magnetisation Transfer) as a significant predictor of longitudinal change in preference uncertainty was significant (standardised beta = −0.13, p = 0.03), the other cross-domain coupling paths were not. Solid lines: significant path, dashed line: non-significant path. No means are displayed for clarity; the full set of parameter estimates is included in Supplementary Table 3. b Higher values of the mPFC myelin marker (magnetisation transfer) at measurement time point 1 led to a more pronounced longitudinal change in preference uncertainty (note that a stronger longitudinal decline is coded as positive (‘more change’) for illustration purposes). The error band denotes the 95% confidence level interval. c Longitudinal decrease in preference uncertainty as a function of different levels of T1 myelin marker values. For illustration purposes, we plot preference uncertainty residuals corrected for baseline age, IQ and sex. n.s. not significant, T1 measurement time point 1, baseline assessment; T2 measurement time point 2, follow-up assessment after ~1–5 years, mPFC medial prefrontal cortex, MT Magnetisation Transfer. Source data are provided as a Source Data file.

References

    1. Blakemore S-J, Mills KL. Is adolescence a sensitive period for sociocultural processing? Annu. Rev. Psychol. 2014;65:187–207. doi: 10.1146/annurev-psych-010213-115202. - DOI - PubMed
    1. Foulkes L, Blakemore S-J. Is there heightened sensitivity to social reward in adolescence? Curr. Opin. Neurobiol. 2016;40:81–85. doi: 10.1016/j.conb.2016.06.016. - DOI - PubMed
    1. Knoll LJ, Leung JT, Foulkes L, Blakemore S-J. Age-related differences in social influence on risk perception depend on the direction of influence. J. Adolesc. 2017;60:53–63. doi: 10.1016/j.adolescence.2017.07.002. - DOI - PMC - PubMed
    1. Knoll, L. J., Magis-Weinberg, L., Speekenbrink, M. & Blakemore, S.-J. Social influence on risk perception during adolescence. Psychol. Sci.10.1177/0956797615569578 (2015). - PMC - PubMed
    1. Reiter AMF, Suzuki S, O’Doherty JP, Li SC, Eppinger B. Risk contagion by peers affects learning and decision-making in adolescents. J. Exp. Psychol. Gen. Advance online publication. 2019 doi: 10.1037/xge0000512. - DOI - PubMed

Publication types