. 2021 Jun 22;12(1):3830.
doi: 10.1038/s41467-021-23904-4.

LINC00842 inactivates transcription co-regulator PGC-1α to promote pancreatic cancer malignancy through metabolic remodelling

Affiliations

LINC00842 inactivates transcription co-regulator PGC-1α to promote pancreatic cancer malignancy through metabolic remodelling

Xudong Huang et al. Nat Commun. .

Abstract

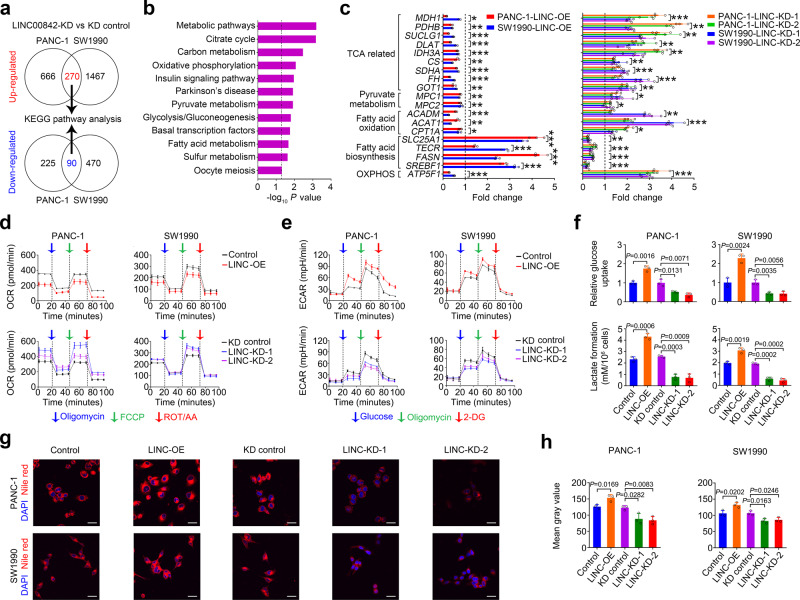
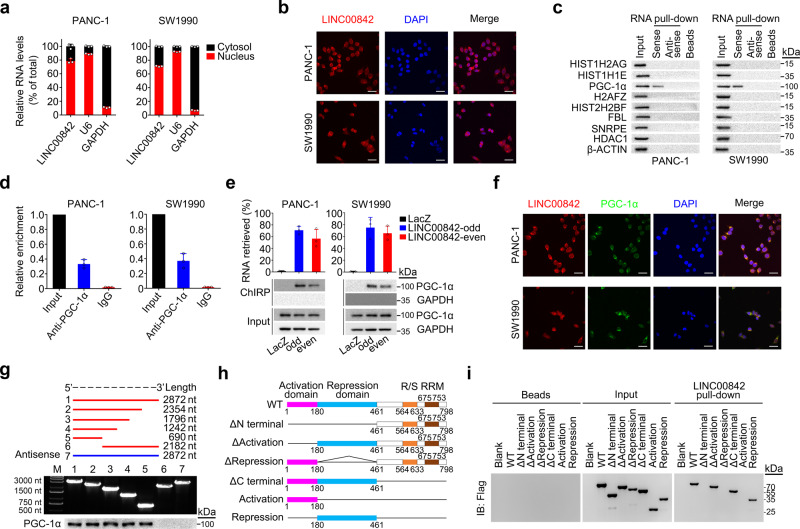
The molecular mechanism underlying pancreatic ductal adenocarcinoma (PDAC) malignancy remains unclear. Here, we characterize a long intergenic non-coding RNA LINC00842 that plays a role in PDAC progression. LINC00842 expression is upregulated in PDAC and induced by high concentration of glucose via transcription factor YY1. LINC00842 binds to and prevents acetylated PGC-1α from deacetylation by deacetylase SIRT1 to form PGC-1α, an important transcription co-factor in regulating cellular metabolism. LINC00842 overexpression causes metabolic switch from mitochondrial oxidative catabolic process to fatty acid synthesis, enhancing the malignant phenotypes of PDAC cells. High LINC00842 levels are correlated with elevated acetylated- PGC-1α levels in PDAC and poor patient survival. Decreasing LINC00842 level and inhibiting fatty acid synthase activity significantly repress PDAC growth and invasiveness in mouse pancreatic xenograft or patient-derived xenograft models. These results demonstrate that LINC00842 plays a role in promoting PDAC malignancy and thus might serve as a druggable target.


Conflict of interest statement

The authors declare no competing interests.

Figures

Fig. 1
Fig. 1. LINC00842 is associated with survival time in patients with PDAC.
a Volcano plot of lncRNAs associated with survival time in TCGA PAAD patients. Red and blue dots represent FDR ≤ 0.05 while gray dots represent FDR > 0.05 (upper panel). Ten top significant lncRNAs selected for investigation (lower panel). b Associations of the expression levels of 10 lncRNAs with survival time of patients in Cohort 1, showing only LINC00842 was significantly associated. HR, hazard ratio; CI, confidence interval. c Kaplan–Meier estimates of survival time of patients in Cohort 1, Cohort 2 and combined sample by different LINC00842 levels in tumor. The median survival times for patients with high LINC00842 (≥ median) in Cohort 1, Cohort 2 and combined sample were 10.3, 5.0, and 9.9 months, significantly shorter than 20.0, 19.0, and 20.0 months in patients with low LINC00842 (< median), with the HRs (95% CI) for death of high LINC00842 level being 2.39 (1.60–3.56), 2.58 (1.13–5.90), and 2.45 (1.77–3.40), respectively. d, e LINC00842 levels were significantly higher in PDAC tumors than paired normal tissues (d, Cohort 1 (n = 158), Cohort 2 (n = 69) and combined sample (n = 227)) and in stage III/IV tumors (Cohort 1 (n = 22), Cohort 2 (n = 22) and combined sample (n = 44)) than in stage I/II tumors (Cohort 1 (n = 136), Cohort 2 (n = 47) and combined sample (n = 183)) (e). Data are shown in box plots; the lines in the middle of the box are medians and the upper and lower lines indicate 25th and 75th percentiles. Wilcoxon rank-sum tests (two-tailed) were used in (d) and (e) to determine the P values. The number of stage I/II tumors are 136 and 47 and stage III/IV tumors are 22 and 22 in Cohort 1 and Cohort 2, respectively. fi Effects of LINC00842 overexpression (LINC-OE) or silence (LINC-KD) on abilities of PDAC cell proliferation (f, results are means ± SD from 3 experiments and each had 6 replicates), colony formation (g, results are means ± SD from 3 independent experiments), migration (h) and invasion (i). Data in (h) and (i) are mean ± SD from 3 random fields. j Effect of LINC00842 expression change on PDAC xenograft growth in mice. Shown are images of the subcutaneous xenografts at the end of experiments (left panels) and the growth curves of the xenografts (right panels). Data represent mean ± SEM (n = 5). k Bioluminescence images showing the effect of LINC00842 expression change on the tumor burden of mice with orthotopically transplanted PDAC (n = 5). l Statistics of fluorescence intensity of tumor burden in mice shown in (k). Data represent mean ± SD. m Effect of LINC00842 expression change on survival time of mice with PDAC orthotopic transplantation (n = 8). n` Histopathological images of 4 organs of mice with orthotopic transplantation show differences in tumor metastases (H&E staining). Scale bars, 500 and 100 μm. o Statistics of tumor metastases in mice in each group. The P values in (gi), (l) and *P < 0.05; **P < 0.01, and ***P < 0.001 in (f), (j) were determined by Student’s t-test (two-tailed) compared with corresponding control.
Fig. 2
Fig. 2. LINC00842 alters metabolic programs in PDAC cells.
a Differentially expressed genes identified by RNA sequencing in PDAC cells with or without LINC00842 knockdown (KD). Upregulated genes (fold change ≥2) and downregulated genes (fold change ≤0.5) were selected for pathway enrichment analysis. b Kyoto Encyclopedia of Genes and Genomes (KEGG) analysis of differentially expressed genes regulated by LINC00842. The dotted line indicates P < 0.05 (two-tailed). c Validation of some RNA-sequencing results by using quantitative RT-PCR. Data were normalized to control or KD-control. TCA, tricarboxylic acid cycle; OXPHOS, oxidative phosphorylation. d, e Effects of LINC00842 overexpression (LINC-OE) or silence (LINC-KD) on oxygen consumption rate (OCR) (d) or extracellular acidification rate (ECAR) (e). f Effects of LINC00842 expression change on glucose uptake or lactate production. g, h Representative pictures of Nile red (red) and DAPI (blue) staining of cells with LINC00842 overexpression or silencing (g) and quantification using Image J software (h). Scale bar, 30 μm. Results in (c), (f), and (h) are mean ± SD from 3 independent experiments. The P value in (f), (h) and *P < 0.05; **P < 0.01, and ***P < 0.001 in (c) were determined by Student’s t-test (two-tailed).
Fig. 3
Fig. 3. LINC00842 promotes anabolic metabolism in PDAC cells.
ad LINC00842 expression change significantly altered the abundance of tricarboxylic acid cycle (TCA) intermediates (a and c) or long-chain acylcarnitines (b and d). eh LINC00842 overexpression (OE) or knockdown (KD) significantly changed the levels of TCA intermediates expressed as mass isotopomer percentage. il LINC00842 expression change significantly altered the levels of palmitate (C16:0, i and k) and stearate (C18:0, j and l) paired mass isotopomer percentages. Results in (al) are mean ± SD from 3 independent experiments. *P < 0.05; **P < 0.01, and ***P < 0.001 were determined by Student’s t-test (two-tailed).
Fig. 4
Fig. 4. LINC00842 directly interacts with PGC-1α in PADC cells.
a, b Subcellular localization analysis by PCR (a) or RNA FISH (b) shows LINC00842 is mainly located in the nuclei. U6 and GAPDH were served as nuclear and cytoplasmic markers and shown are mean ± SD from 3 independent experiments (a). Scale bar, 30 μm (b). c Western blot analysis of proteomic screening suggested 8 potential LINC00842-binding proteins obtained from RNA pull-down assays with LINC00842 or its antisense. d Association of PGC-1α with LINC00842 determined by RNA immunoprecipitation (RIP) assays. Data represent relative enrichment (mean ± SD) to input from 3 independent experiments. IgG was used as the negative control. e Results of chromatin isolation by RNA purification (ChIRP) assays using LINC00842-odd, -even or LacZ (negative control) antisense probe sets. Upper panels are RNA retrieval rate (mean ± SD from 3 assays) and lower panels are immunoblot of PGC-1α and GAPDH (negative control) in ChIRP and input. f Immunofluorescence assays show co-localization of LINC00842 (red) and PGC-1α (green) predominately in the nuclei. Scale bar, 30 μm. g Truncation mapping of LINC00842 PGC-1α binding domain. Top panel: diagrams of LINC00842 full-length and truncated fragments. Middle: RNA sizes of in vitro transcribed LINC00842 full-length and truncated fragments. Bottom: immunoblot analysis of PGC-1α pulled down by different LINC00842 fragments. h Schematic diagram of Flag-tagged PGC-1α and its truncated forms used in LINC00842 pull-down assays. i Immunoblot analysis of Flag-tagged wild-type (WT) PGC-1α and its truncated forms retrieved by in vitro transcribed biotinylated LINC00842.
Fig. 5
Fig. 5. LINC00842 reduces deacetylation of PGC-1α by SIRT1 in PDAC cells.
a LINC00842 overexpression (LINC-OE) or silence (LINC-KD) did not affect PPARGC1A (PPA) mRNA and protein levels. b LINC00842 expression change altered acetylated PGC-1α (acetyl-PGC-1α) levels. c LINC00842 expression change did not affect SIRT1 mRNA and protein levels. d Reciprocal immunoprecipitation assays show inhibitory effect of LINC00842 on the interaction of PGC-1α with SIRT1. e, f Effect of SIRT1 agonist SRT2104 on the interaction of PGC-1α or its Repression domain (PGC-1α-Rep) with LINC00842. The level of LINC00842 RNA in RNA immunoprecipitation product decreased in a SRT2104 dose-dependent manner. g Results of chromatin isolation by RNA purification (ChIRP) assays using LINC00842-odd, -even or LacZ (negative control) antisense probe sets. SRT2104 treatment reduced the interaction of PGC-1α or its Repression domain with LINC00842. h Immunoprecipitation and immunoblotting assays show inhibitory effect of LINC00842 on PGC-1α deacetylation by SRT2104 (4 µM). i Effects of LINC00842 sense or antisense on in vitro PGC-1α-Lys deacetylation by recombinant human SIRT1 (rhSIRT1) in the presence or absence of NAD+, showing only LINC00842 sense inhibited the deacetylation. Flag was blotted as a loading control. The immunoblots in (gi) are representative results from 3 independent experiments with similar results. The results shown in (a), (c), (e), and (f) are mean ± SD from 3 independent experiments. The P values were determined by Student’s t-test (two-tailed).
Fig. 6
Fig. 6. High glucose induces LINC00842 expression via transcription factor YY1 in PDAC cells.
a LINC00842 levels in cells cultured with 5 or 25 mM of glucose (n = 3). b LINC00842 levels in cells at different times after switch of glucose dose in culture medium (n = 3). c, d Association of PGC-1α (c, n = 3) or its Repression domain (PGC-1α-Rep, d, n = 3) with LINC00842 determined by RNA immunoprecipitation (RIP) assays in cells cultured with different glucose doses. e Immunoprecipitation and immunoblot analysis of acetyl-PGC-1α levels in cells cultured with 25 mM of glucose at 2 and 4 h and after switch to 5 mM of glucose for 2 and 4 h. f, g Immunoprecipitation and immunoblot analysis of acetyl-PGC-1α levels in cells with LINC00842 overexpression (f) or knockdown (g) exposed to indicated glucose doses for 4 h. h, i Co-immunoprecipitation analysis of PGC-1α and SIRT1 interaction in cells with LINC00842 overexpression (h) or knockdown (i) exposed to indicated glucose doses for 4 h. j Prediction of potential transcription factors in the LINC00842 promoter region. k Relative LINC00842 levels in cells with or without knockdown of each of the 6 transcription factors indicated in (j) (n = 3). l Schema of the putative YY1 binding site in the promoter of LINC00842 gene and the primers used for chromatin immunoprecipitation (ChIP) analysis. The consensus and mutant sequences for YY1 binding were boxed. m ChIP analysis with anti-YY1 antibodies or IgG control. Upper panel shows qPCR results (n = 3) and lower panel are images of agarose gel electrophoresis of the qPCR products. n Luciferase reporter assays in cells co-transfected with the indicated plasmids for 48 h (n = 4). o Luciferase reporter assays in cells cultured in 5 mM of glucose and then switched to 25 mM of glucose for 4 h (n = 4). p Immunoblot analysis of YY1 level in cells exposed to 5 or 25 mM of glucose. q Immunoprecipitation and immunoblot analysis of acetyl-PGC-1α levels in cells transfected with the indicated plasmids or siRNAs and exposed to 25 mM glucose. r Immunoprecipitation and immunoblot analysis of acetyl-PGC-1α levels in cells transfected with the indicated plasmids or antisense oligonucleotide (ASO) of LINC00842 and exposed to 5 mM glucose. The results in (ad), (k), (mo) are mean ± SD from at least 3 independent experiments. The P values were determined by Student’s t-test (two-tailed).
Fig. 7
Fig. 7. LINC00842 is a potential therapeutic target for PDAC.
a Immunoprecipitation and immunoblot analysis of YY1, acetyl-PGC-1α, and FASN in PDAC and paired non-tumor tissues (n = 30) from one experiment. b Levels of LINC00842 RNA and YY1, FASN, and acetyl-PGC-1α proteins in PDAC and paired non-tumor tissues (n = 30). RNA levels were determined with qPCR while protein levels were determined with western blotting and quantified using Image J. Data are shown in box plots; the lines in the middle of the box are median and the upper and lower lines indicate 25th and 75th percentiles. The P values were determined by Wilcoxon test (two-tailed). c, d Spearman’s correlations between levels of LINC00842 and YY1, acetyl-PGC-1α or FASN (c) and between YY1, acetyl-PGC-1α, and FASN (d) in PDAC tissues (n = 30). e Timeline schematic for treatment of mice carrying xenograft in the pancreas with antisense oligonucleotide (ASO)-control (Ctrl), ASO-LINC00842, Orlistat or combination of ASO-LINC00842 and Orlistat. Arrows indicate different treatment time points. f, g Bioluminescence imaging (left panel), quantitative fluorescent intensities (upper right panel), and survival time (lower right panel) of mice with different treatment. Fluorescent intensity data represent mean ± SD from 5 mice in each group; The P values were determined by Student’s t-test (two-tailed). h Timeline schematic for treatment of mice carrying patient-derived tumor xenograft (PDX). Arrows indicate different treatment time points. i ASO-LINC00842 and Orlistat treatment significantly inhibited PDX growth in mice. Data in each time point represent mean ± SEM from 5 mice. **P < 0.01 and ***P < 0.001 of Student’s t-test (two-tailed. No adjustments were made for multiple comparisons). jl LINC00842 RNA (j), acetyl-PGC-1α (k), and FASN (l) protein or activity levels in PDX of mice before and after treatment. Data are mean ± SD from 5 mice; The P values in (jl) were determined by Student’s t-test (two-tailed). m Proposed acting model for LINC00842 that regulates metabolic reprogramming in PDAC.

References

    1. Chen W, et al. Cancer statistics in China, 2015. CA Cancer J. Clin. 2016;66:115–132. doi: 10.3322/caac.21338. - DOI - PubMed
    1. Siegel, R. L., Miller, K. D. & Jemal, A. Cancer statistics, 2020. CA Cancer J. Clin. 70, 7–30 (2020). - PubMed
    1. Kleeff J, et al. Pancreatic cancer. Nat. Rev. Dis. Prim. 2016;2:16022. doi: 10.1038/nrdp.2016.22. - DOI - PubMed
    1. Chaffer CL, Weinberg RA. A perspective on cancer cell metastasis. Science. 2011;331:1559–1564. doi: 10.1126/science.1203543. - DOI - PubMed
    1. Cairns RA, Harris IS, Mak TW. Regulation of cancer cell metabolism. Nat. Rev. Cancer. 2011;11:85–95. doi: 10.1038/nrc2981. - DOI - PubMed

Publication types

MeSH terms

Substances