. 2021 Jun 22;12(1):3829.
doi: 10.1038/s41467-021-24005-y.

Rapid evolution of bacterial mutualism in the plant rhizosphere

Affiliations

Rapid evolution of bacterial mutualism in the plant rhizosphere

Erqin Li et al. Nat Commun. .

Abstract

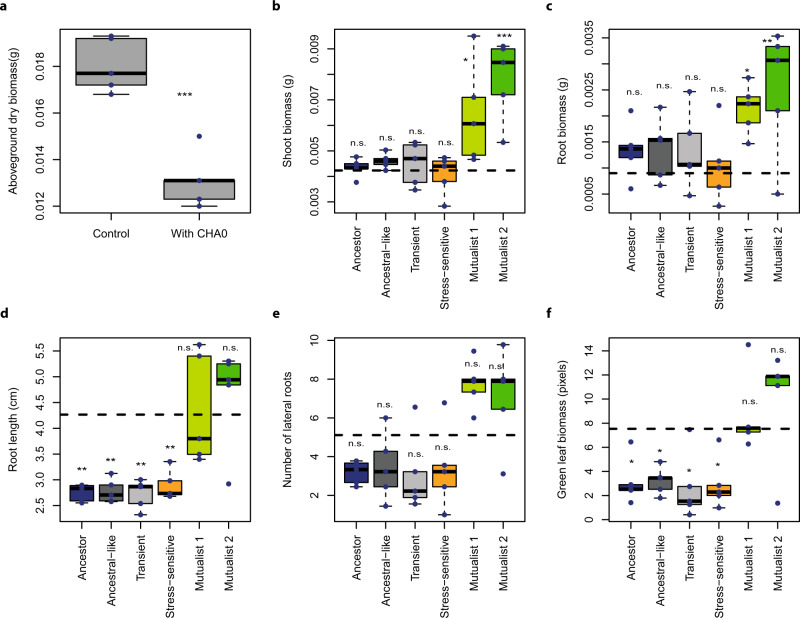
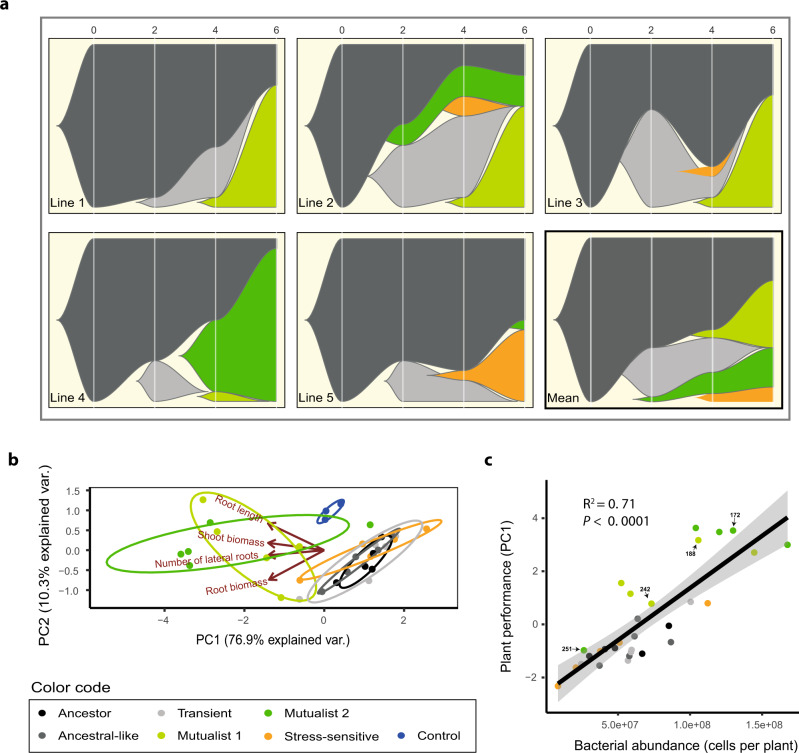
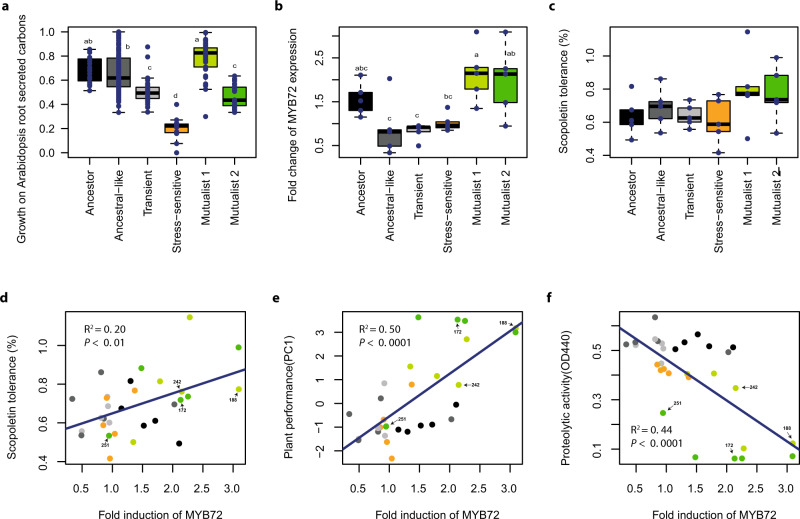
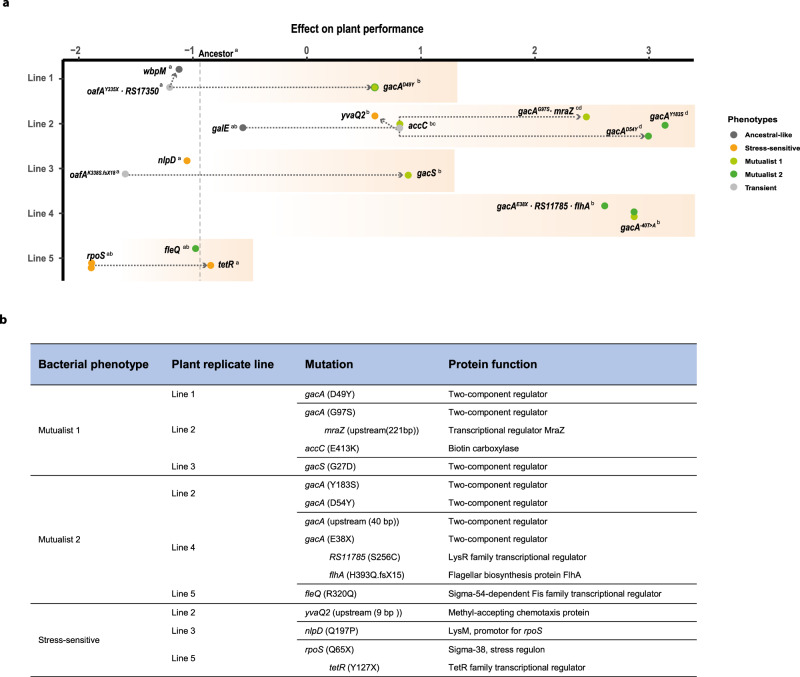
While beneficial plant-microbe interactions are common in nature, direct evidence for the evolution of bacterial mutualism is scarce. Here we use experimental evolution to causally show that initially plant-antagonistic Pseudomonas protegens bacteria evolve into mutualists in the rhizosphere of Arabidopsis thaliana within six plant growth cycles (6 months). This evolutionary transition is accompanied with increased mutualist fitness via two mechanisms: (i) improved competitiveness for root exudates and (ii) enhanced tolerance to the plant-secreted antimicrobial scopoletin whose production is regulated by transcription factor MYB72. Crucially, these mutualistic adaptations are coupled with reduced phytotoxicity, enhanced transcription of MYB72 in roots, and a positive effect on plant growth. Genetically, mutualism is associated with diverse mutations in the GacS/GacA two-component regulator system, which confers high fitness benefits only in the presence of plants. Together, our results show that rhizosphere bacteria can rapidly evolve along the parasitism-mutualism continuum at an agriculturally relevant evolutionary timescale.


Conflict of interest statement

The authors declare no competing interests.

Figures

Fig. 1
Fig. 1. Evolution of bacterial mutualism in the rhizosphere of Arabidopsis thaliana.
Panel a shows the initially antagonistic effect of Pseudomonas protegens CHA0 on A. thaliana after one plant growth cycle in the sterile sand study system (n = 5; aboveground biomass ***P = 0.0001). Panels bf compare the effects of ancestral and evolved Pseudomonas protegens CHA0 phenotypes on plant performance-related traits in a separate plant growth assays performed on agar plates at the end of the selection experiment (n = 3 for control and n = 5 for each evolved phenotype, see Table S2). Different panels show the shoot biomass in grams (b), root biomass in grams (c), number of lateral roots (d), root length in cm (e), and the amount of plant ‘greenness’ in terms of green-to-white pixel ratio (f) after 14 days of bacterial inoculation (Supplementary Data 2; blue dashed horizontal lines show the non-inoculated control plants). Bacterial phenotype groups are displayed in different colours (black: ancestor; dark grey: ancestral-like; light grey: transient; orange: stress-sensitive, light green: mutualist 1 and dark green: mutualist 2) and were classified and named based on K-means clustering (Fig. S1) using 14 phenotypic traits linked to growth, stress tolerance, production of bioactive compounds and antimicrobial activity (Table S1). All boxplots show median (centre line), interquartile range (25–75%) and whiskers that extend 1.5 times the interquartile range overlaid with a scatter plot showing independent replicates. Statistical testing in all panels was carried out using one-way ANOVA, and asterisks above plots indicate significant differences between control and bacteria-treated plants (*P = 0.05, **P = 0.01, ***P = 0.001; n.s. = non-significant). Data for all panels are provided in the Source Data file.
Fig. 2
Fig. 2. Temporal changes in bacterial phenotypes during the selection experiment and positive correlation between evolved bacteria and plant growth.
Panels in a show the dynamics of five bacterial phenotype groups across five plant replicate lines and the overall mean pattern during six growth cycles (6 months). The x-axis shows the plant growth cycle (0: ancestral bacterium) and the y-axis shows the relative abundance of each bacterial phenotype. Panel b shows a principal component analysis (PCA) for five representative bacterial isolates from each evolved phenotype group in addition to ancestor isolates (see Table S2) based on their plant growth-related traits. The negative PC1 values of each isolate were extracted and combined to a ‘Plant performance’ index, which included bacterial effects on shoot biomass, root biomass and root architecture explaining 76.9% of the total variation in plant growth. Panel c shows a positive correlation between ‘Plant performance’ and bacterial abundance on the plant roots at the end of the fitness assays; the black line and grey area indicate the linear regressions with 95% confidence intervals, respectively (n = 30, biologically independent isolates, see Table S2; P = 4.296e−09). In all panels, bacterial phenotype groups are displayed on different colours (black: ancestor; dark grey: ancestral-like; light grey: transient; orange: stress-sensitive, light green: mutualist 1 and dark green: mutualist 2). The sample IDs of four isolates from the two mutualistic phenotype groups are highlighted on labels. Data for all panels are provided in the Source Data file.
Fig. 3
Fig. 3. Selection mechanisms favouring the increase in the relative abundance of mutualists in the rhizosphere of Arabidopsis thaliana.
Panel a shows the growth of ancestor and evolved Pseudomonas protegens CHA0 phenotypes on carbons typically secreted by A. thaliana (14 most dominant carbons analysed as a combined index based on normalised first principal component PC1, which explained 83.9% of total variation). In total, 256 isolates were characterized including ancestral (n = 16), ‘Ancestral-like’ (n = 119), ‘Transient’ (n = 41), ‘Stress-sensitive’ (n = 11), ‘Mutualist 1’ (37), and ‘Mutualist 2’ (n = 31) phenotypes. Panel b shows the effect of ancestor and evolved P. protegens CHA0 phenotypes on the expression of MYB72 (transcription factor responsible for scopoletin production) in the roots of a GUS A. thaliana reporter line (based on the quantification of GUS staining of the roots, Fig. S6). Panel c shows the relative growth of ancestor and evolved P. protegens CHA0 phenotypes in the presence of the plant-secreted scopoletin antimicrobial at 2 mM concentration after 72 h of incubation relative to no-scopoletin control. Panel d shows a positive relationship between MYB72 expression (fold induction; x-axis) and scopoletin tolerance (y-axis) for all tested isolates. Panel e shows a positive relationship between MYB72 expression (fold induction; x-axis) and plant performance (y-axis) for all tested isolates. Panel f shows a negative relationship between MYB72 expression (fold induction; x-axis) and proteolytic activity (y-axis) for all tested isolates. The sample IDs of four isolates from the two mutualistic phenotype groups are highlighted on labels (see Table S2) in panels df. Panels bf include five representative bacterial isolates (n = 5, biologically independent isolates) from each phenotype in addition to the ancestor (each replicate line represented; see Table S2). In all panels, bacterial phenotype groups are displayed on different colours (black: ancestor; dark grey: ancestral-like; light grey: transient; orange: stress-sensitive, light green: Mutualist 1 and dark green: Mutualist 2). All boxplots show median (centre line), interquartile range (25–75%) and whiskers that extended 1.5 times the interquartile range overlaid with a scatter plot showing independent replicates. Statistical testing in panels ac was carried out using one-way ANOVA followed by Tukey’s multiple comparison test (α = 0.05; different lowercase letters indicate significant differences). Panels df show linear regression (black line) and Pearson correlations fitted over all biologically independent isolates (n = 30). Data for all panels are provided in the Source Data file.
Fig. 4
Fig. 4. Genetic basis of bacterial evolution in the rhizosphere of Arabidopsis thaliana.
Panel a shows clear parallel evolution between four out of five plant replicate selection lines based on re-sequencing of 25 evolved and five ancestor isolates used in the phenotypic assays. Filled dots represent isolates with novel mutations (present in 18/25 evolved isolates). The seven isolates without mutations, or only synonymous mutations, are not included. The x-axis shows a combined index of ‘Plant performance’ relative to non-inoculated control plants (values on the x-axis indicate positive and negative effects on the plant and the y-axis shows the five independent plant replicate selection lines). The effect of the ancestral bacterial genotype on plant performance is shown as a vertical dashed line. Statistical testing in panel a was carried out using one-way ANOVA (each line analysed separately). The different letters on the top right of each genotype indicate significant differences based on a Tukey’s HSD test (α = 0.05; each line analysed separately, n = 3). Bacterial phenotype groups are displayed on different colours (black: ancestor; dark grey: ancestral-like; light grey: transient; orange: stress-sensitive, light green: Mutualist 1 and dark green: Mutualist 2) and the accumulation of mutations within replicate lines are shown with connected dashed arrows. Panel b table lists unique mutations linked with evolved bacterial phenotypes. Successive mutations that appeared within the same genetic background are shown after the indent. Notably, these additional mutations did not affect the bacterial phenotypes (see Table S3 for a more detailed description of the mutations). Data for all panels are provided in the Source Data file.
Fig. 5
Fig. 5. Competitive fitness of gac mutants relative to their direct ancestors in the rhizosphere and in in vitro culture media.
The gac mutants’ relative fitness (r) was calculated based on the deviation from the initial 1:1 genotype ratio (dashed line) after direct competition in different environments. Fitness values above the dashed line indicate a higher competitive advantage of gac mutants relative to their ancestral genotypes without gac mutations (Table S2), whereas values below the dashed line denote for decreased competitive ability of evolved gac mutants. In all panels, green and beige backgrounds denote competition assays conducted in the rhizosphere and in standard culture media, respectively. All boxplots show median (centre line), interquartile range (25–75%) and whiskers that extended 1.5 times the interquartile range overlaid with a scatter plot showing independent replicates (n = 3). Different small letters above the boxplots represent significant differences in relative fitness (r) between growth conditions for each mutant (one-way ANOVA, Tukey’s HSD test, α = 0.05). Data for all panels are provided in the Source Data file.

Similar articles

Cited by

References

    1. Berendsen RL, Pieterse CMJ, Bakker PAHM. The rhizosphere microbiome and plant health. Trends Plant Sci. 2012;17:478–486. doi: 10.1016/j.tplants.2012.04.001. - DOI - PubMed
    1. Philippot L, Raaijmakers JM, Lemanceau P, van der Putten WH. Going back to the roots: the microbial ecology of the rhizosphere. Nat. Rev. Microbiol. 2013;11:789–799. doi: 10.1038/nrmicro3109. - DOI - PubMed
    1. Dethlefsen L, McFall-Ngai M, Relman DA. An ecological and evolutionary perspective on human–microbe mutualism and disease. Nature. 2007;449:811–818. doi: 10.1038/nature06245. - DOI - PMC - PubMed
    1. Brownlie JC, Johnson KN. Symbiont-mediated protection in insect hosts. Trends Microbiol. 2009;17:348–354. doi: 10.1016/j.tim.2009.05.005. - DOI - PubMed
    1. Kiers ET, Denison RF. Sanctions, cooperation, and the stability of plant-rhizosphere mutualisms. Annu. Rev. Ecol. Evol. Syst. 2008;39:215–236. doi: 10.1146/annurev.ecolsys.39.110707.173423. - DOI

Publication types

MeSH terms

Supplementary concepts