. 2021 Sep;14(5):1113-1126.
doi: 10.1038/s41385-021-00418-2. Epub 2021 Jun 22.

Growth faltering regardless of chronic diarrhea is associated with mucosal immune dysfunction and microbial dysbiosis in the gut lumen

Affiliations

Growth faltering regardless of chronic diarrhea is associated with mucosal immune dysfunction and microbial dysbiosis in the gut lumen

Nicholas S Rhoades et al. Mucosal Immunol. 2021 Sep.

Abstract

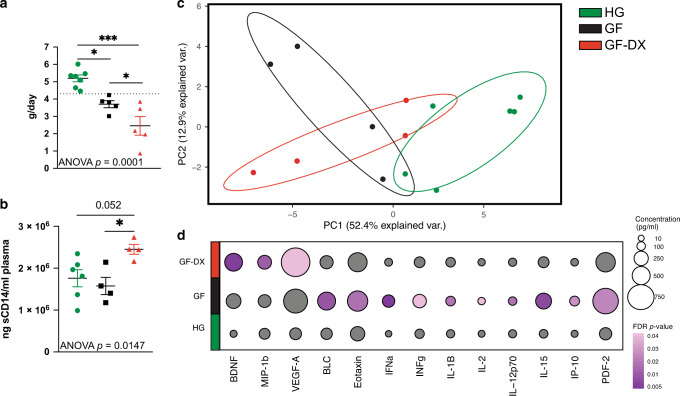
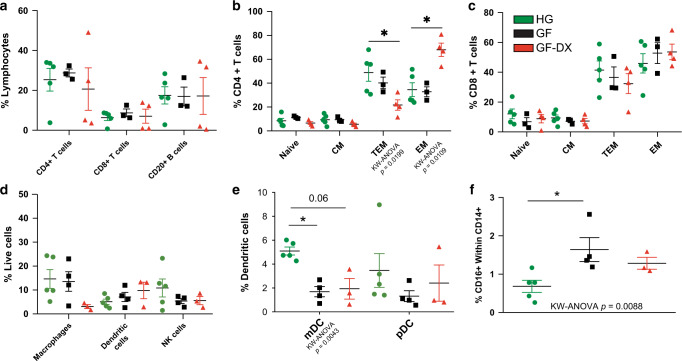
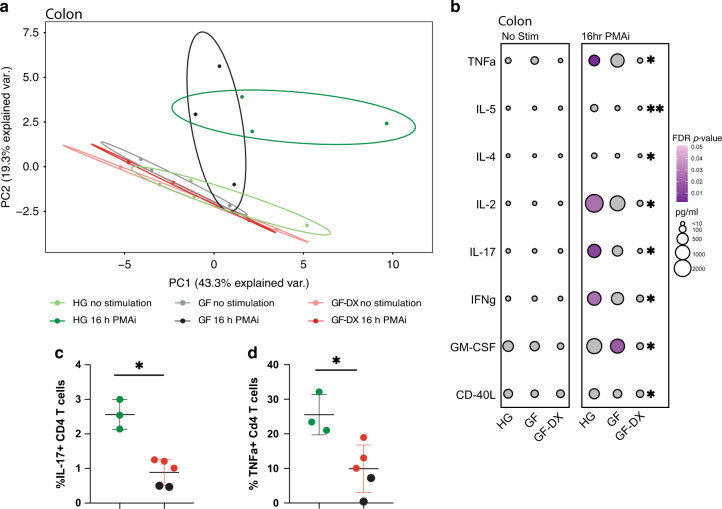
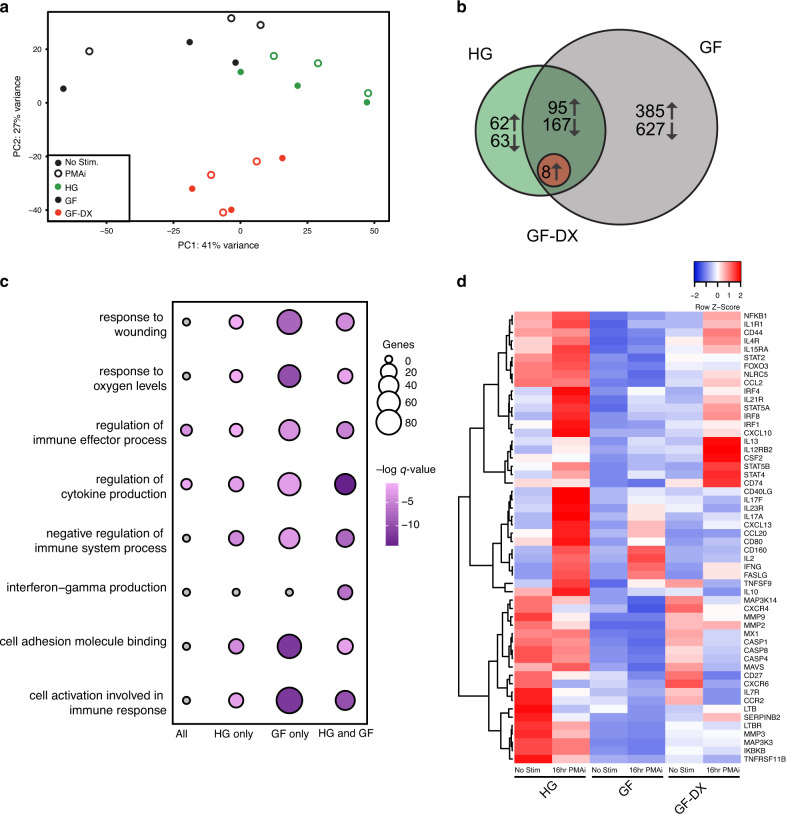
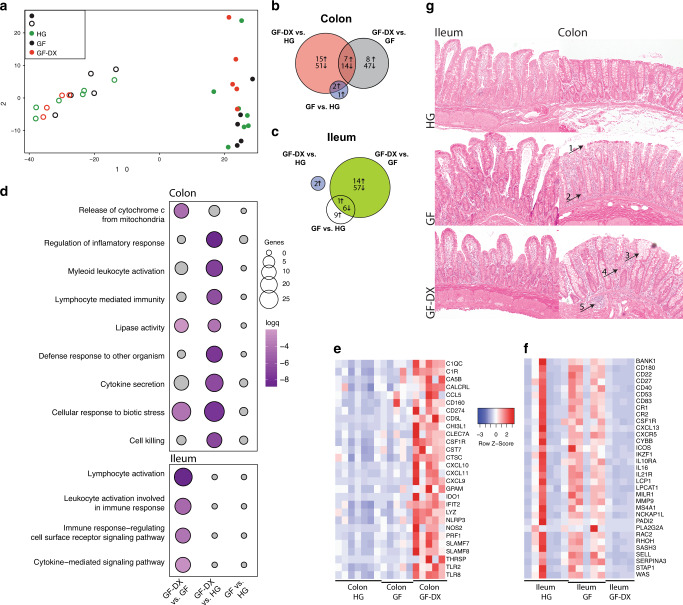
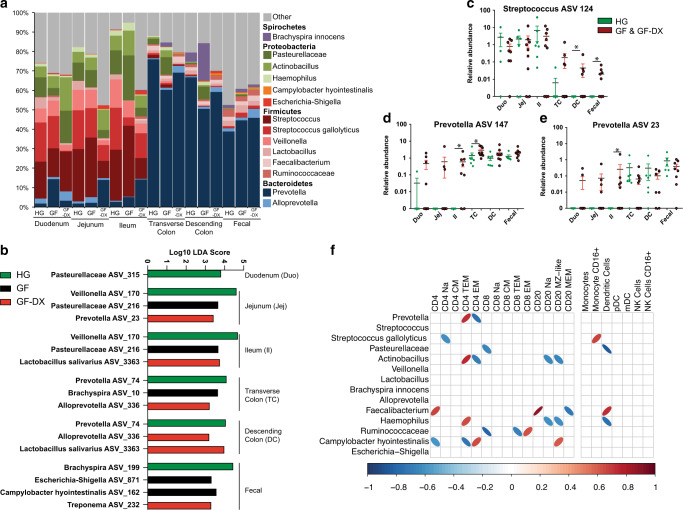
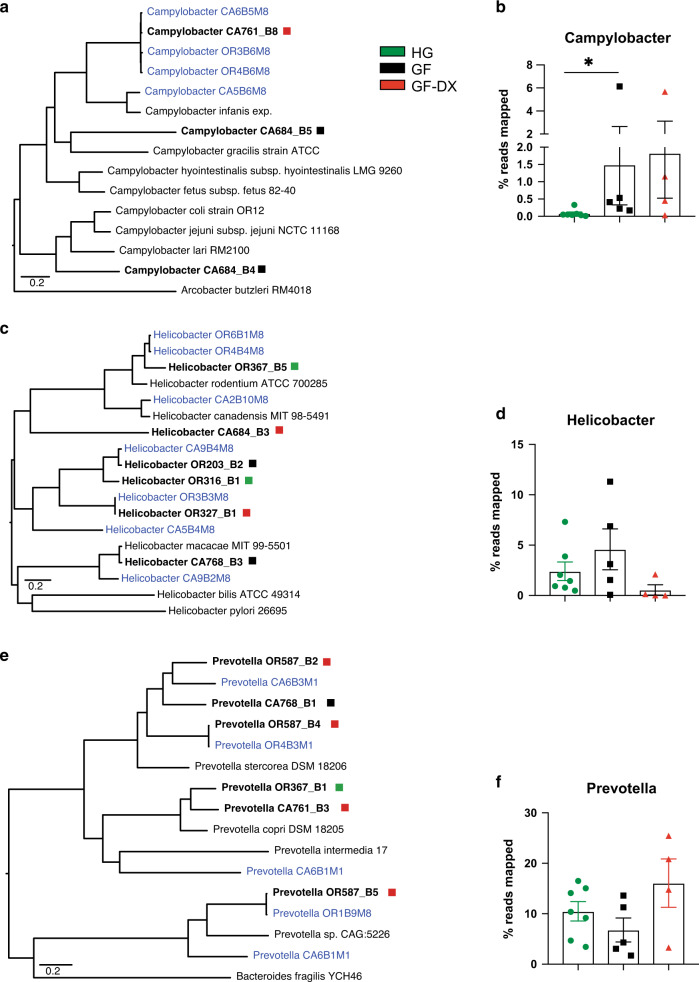
Despite the impact of childhood diarrhea on morbidity and mortality, our understanding of its sequelae has been significantly hampered by the lack of studies that examine samples across the entire intestinal tract. Infant rhesus macaques are naturally susceptible to human enteric pathogens and recapitulate the hallmarks of diarrheal disease such as intestinal inflammation and growth faltering. Here, we examined intestinal biopsies, lamina propria leukocytes, luminal contents, and fecal samples from healthy infants and those experiencing growth faltering with distant acute or chronic active diarrhea. We show that growth faltering in the presence or absence of active diarrhea is associated with a heightened systemic and mucosal pro-inflammatory state centered in the colon. Moreover, polyclonal stimulation of colonic lamina propria leukocytes resulted in a dampened cytokine response, indicative of immune exhaustion. We also detected a functional and taxonomic shift in the luminal microbiome across multiple gut sites including the migration of Streptococcus and Prevotella species between the small and large intestine, suggesting a decompartmentalization of gut microbial communities. Our studies provide valuable insight into the outcomes of diarrheal diseases and growth faltering not attainable in humans and lays the groundwork to test interventions in a controlled and reproducible setting.


Conflict of interest statement

The authors declare no competing interests.

Figures

Fig. 1
Fig. 1. Growth faltering and growth faltering with active chronic diarrhea are associated with heightened but distinct systemic inflammation.
a Growth rate (grams/day) was calculated for each infant in comparison with the colony average growth rates (calculated from 6510 rhesus macaques, split evenly between males and females) for the same period (dashed line). Animals that fell below the average growth rate were characterized as GF, animals below the average growth rate and with active diarrhea were classified as GF-DX, and animals above the average were considered HG. b Plasma levels of soluble CD14, a marker or systemic inflammation. c Principal component analysis of circulating immune mediators measured in plasma by multiplexed Elisa. d Bubble plots of circulating immune factor levels (picograms per milliliter of plasma). A total of 33 analytes were measured and only analytes significantly different by Kruskal Wallis non-parametric One-Way ANOVA (p < 0.05) were included in the plot. The size of each circle indicates the mean concentration of the indicated analyte and the color of the circle denotes the p-value of Dunn’s multiple comparisons test. Post-hoc comparisons were made between HG vs. GF and HG vs. GF-DX.
Fig. 2
Fig. 2. Growth faltering and growth faltering with active chronic diarrhea coincide with a unique immune cell population in the colon.
a Scatter plots denoting percent abundance of lamina propria T and B cells in the colon. Naïve and memory T cell subsets of colonic lamina propria for (b) CD4+ and (c) CD8+ T cells. d Percent abundance of lamina propria dendritic cells (DC), macrophages, and natural killer (NK) cells in the colon along with (e) mDCs and pDC subsets, and (f) CD16+ Macrophages. Each point represents a study animal. Horizontal bars and whiskers indicate the mean +/− SEM. Significance was determined using Kruskal Wallis non-parametric ANOVA, with Dunn’s multiple comparisons *p < 0.05, **p < 0.01. Post-hoc comparisons were made between HG vs. GF and HG vs. GF-DX.
Fig. 3
Fig. 3. Growth faltering with active chronic diarrhea but not growth faltering alone disrupt immune mediator production by colonic LPLs.
a The principal component analysis generated from the levels of 33 immune mediators released by colonic LPLs collected from HG, GF, and GF-DX infants in the absence and presence of PMA/ionomycin (PMAi) stimulation. b Bubble immune factor production (picograms per milliliter) in the presence or absence of PMAi stimulation by colonic LPLs. A total of 33 analytes were measured and only analytes significantly different by Kruskal Wallis non-parametric ANOVA (p < 0.05) were included in the plot. The size of each circle indicates the mean concentration of the indicated analyte and the color of the circle denotes the p-value of Dunn’s multiple comparisons test. Post-hoc comparisons were made between HG vs. GF and HG vs. GF-DX. c, d Percent of circulating CD4+ T cells producing (c) IL-17 and (d) TNFa after 6-h stimulation with PMAi. Horizontal bars and whiskers indicate the mean +/− SEM. Significance was determined using an unpaired t-test, *p > 0.05.
Fig. 4
Fig. 4. Transcriptional changes of colonic Lamina propria leukocytes (LPLs) in response to PMAi stimulation.
a Principal component analysis of transcriptomic data from colonic LPLs in the absence and after PMA/ionomycin stimulation for 16 h from HG, GF, and GF-DX infants. b Venn diagrams of DEGs detected in colonic LPLs obtained from HG, GF, and GF-DX infants using in response to stimulation using pairwise EdgeR analysis. c Functional enrichment of DEG detected in the colon and ileum of infants determined using Metascape. Each circle denotes a gene ontology (GO) term. The size of the circle reflects the number of DEGs that enriched to that GO term. d Heatmap of select DEGs from the “cell activation involved in immune response” and “interferon-gamma production” GO-terms normalized by row.
Fig. 5
Fig. 5. Transcriptional and histological changes in ileal and colonic gut biopsies from animals experiencing growth faltering and/or active chronic diarrhea.
a Principal component analysis of transcriptomic data generated from ileal and colonic biopsies of healthy, faltering and faltering with diarrhea infants. b Venn diagrams of DEGs detected in colonic tissue biopsies obtained from HG, GF, and GF-DX infants. c Venn diagrams of DEGs detected in ileal tissue biopsies obtained from HG, GF, and GF-DX infants. d Functional enrichment of DEG detected in the colon and ileum of infants determined using Metascape. Each circle denotes a gene ontology (GO) term. The size of the circle reflects the number of DEGs that enriched to that GO term. e, f Heatmaps of select DEGs upregulated in the colon of GF-DX animals (e) and the ileum of GF animals (f) normalized by row. g Representative hematoxylin and eosin-stained images of the ileum and descending colon captured at ×10 magnification by a blinded pathologist. Arrows indicate hallmarks of intestinal inflammation: (1) epithelial disruptions, (2) increased lamina propria immune cells and elongated crypts, (3) crypt distortion, (4) crypt abscess, and (5) increased immune infiltration in the sub-mucosa.
Fig. 6
Fig. 6. Luminal microbial communities of the small and large intestine are distinct and shift with growth faltering and/or active chronic diarrhea.
a Stacked bar plot organized by sampling site and host status. All taxa below 1% average abundance grouped into the “Other” category. Bars represent the average for the indicated sample site/status. b Select differentially abundant ASVs between HG, GF, and GF-DX infants at each gut site. Differential abundance was determined using LEFsE (Log10 LDA score >2). ce Scatter plots of ASVs that displayed differential abundance patterns across gut sites between HG and combined GF and GF-DX infants. The unpaired t-test between HG and combined GF and GF-DX infants at each site, *p < 0.05, **p < 0.01, ***p < 0.001. f Correlation analysis between colonic lamina propria immune cell populations and microbial taxa with >1% average abundance. Only correlations with uncorrected p < 0.05 are shown as ellipses, with blue indicating a negative correlation and red a positive. The width of each ellipse is proportional to the strength of the correlation with a narrower ellipse indicating a lower p-value.
Fig. 7
Fig. 7. Genome assembly reveals a higher abundance of Campylobacter in growth faltering infants.
aCampylobacter core genome phylogram built on the alignment of all protein-coding genes common to all members of the tree (4 assembled genomes from colonic luminal contents [Bold], 4 genomes previously assembled from infant Rhesus macaque feces [Blue], 7 Published Campylobacter genomes [Black]) with exception of the outgroup A. butzerli. b Percentage of metagenomic reads that align to the 3 assembled Campylobacter genomes cumulatively. (Mann-Whitney test; **P < 0.01). c Helicobacter core genome phylogram built on the alignment of all protein-coding genes common to all members of the tree (6 assembled genomes from colonic luminal contents [Bold], 7 genomes previously assembled from infant Rhesus macaque feces [Blue], and 4 Published Helicobacter genomes) with exception of the outgroup H. pylori. d Percentage of metagenomic reads that align to the 6 assembled Helicobacter genomes cumulatively. (Mann-Whitney test; **P < 0.01). e Prevotella core genome phylogram built on the alignment of all protein-coding genes common to all members of the tree (6 assembled genomes from colonic luminal contents [Bold], 5 genomes previously assembled from infant Rhesus macaque feces [Blue], 4 Published Prevotella genomes [Black]) with exception of the outgroup B. fragilis. f Percentage of metagenomic reads that align to the 9 assembled Prevotella genomes cumulatively. (Mann-Whitney test; **P < 0.01).

Similar articles

Cited by

References

    1. Liu L, et al. Global, regional, and national causes of under-5 mortality in 2000-15: an updated systematic analysis with implications for the Sustainable Development Goals. Lancet. 2016;388:3027–3035. doi: 10.1016/S0140-6736(16)31593-8. - DOI - PMC - PubMed
    1. Clasen, T. F. et al. Interventions to improve water quality for preventing diarrhoea. Cochrane Database Syst. Rev.10, CD004794 (2015). - PMC - PubMed
    1. Ferdous F, et al. Severity of diarrhea and malnutrition among under five-year-old children in rural Bangladesh. Am. J. Trop. Med. Hyg. 2013;89:223–228. doi: 10.4269/ajtmh.12-0743. - DOI - PMC - PubMed
    1. Mata L. Diarrheal disease as a cause of malnutrition. Am. J. Trop. Med. Hyg. 1992;47:16–27. doi: 10.4269/ajtmh.1992.47.16. - DOI - PubMed
    1. Baqui AH, et al. Malnutrition, cell-mediated immune deficiency, and diarrhea: a community-based longitudinal study in rural Bangladeshi children. Am. J. Epidemiol. 1993;137:355–365. doi: 10.1093/oxfordjournals.aje.a116682. - DOI - PubMed

Publication types

MeSH terms