[Preprint]. 2021 Jun 16:2021.06.10.21258580.
doi: 10.1101/2021.06.10.21258580.

Metrics to relate COVID-19 wastewater data to clinical testing dynamics

Affiliations

Metrics to relate COVID-19 wastewater data to clinical testing dynamics

Amy Xiao et al. medRxiv. .

Update in

  • Metrics to relate COVID-19 wastewater data to clinical testing dynamics.
    Xiao A, Wu F, Bushman M, Zhang J, Imakaev M, Chai PR, Duvallet C, Endo N, Erickson TB, Armas F, Arnold B, Chen H, Chandra F, Ghaeli N, Gu X, Hanage WP, Lee WL, Matus M, McElroy KA, Moniz K, Rhode SF, Thompson J, Alm EJ. Xiao A, et al. Water Res. 2022 Apr 1;212:118070. doi: 10.1016/j.watres.2022.118070. Epub 2022 Jan 14. Water Res. 2022. PMID: 35101695 Free PMC article.

Abstract

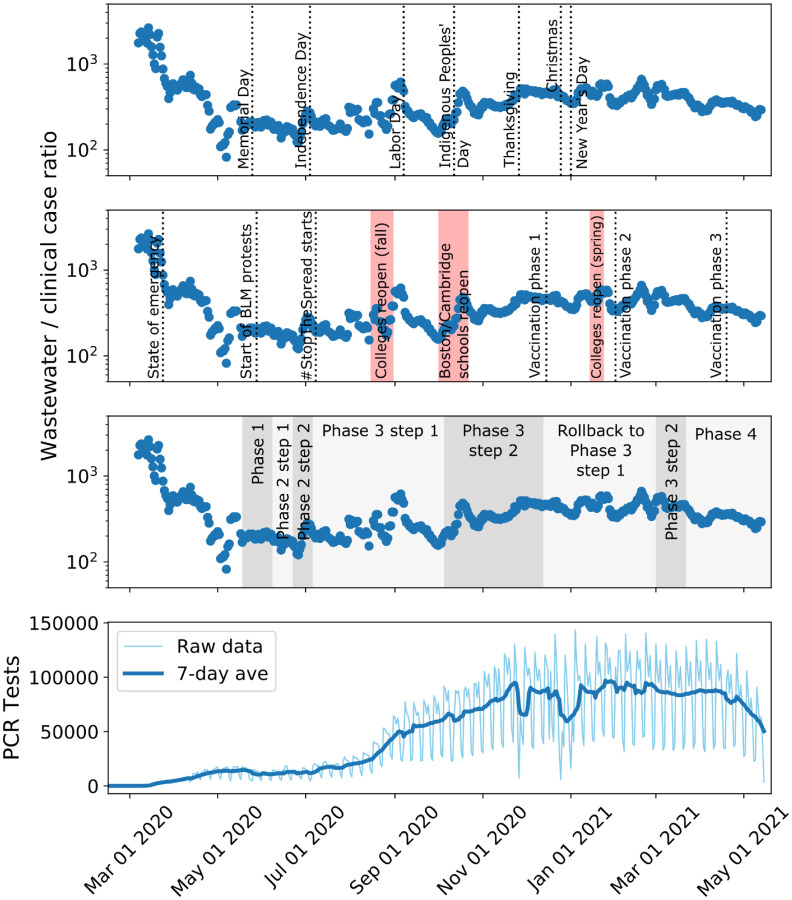
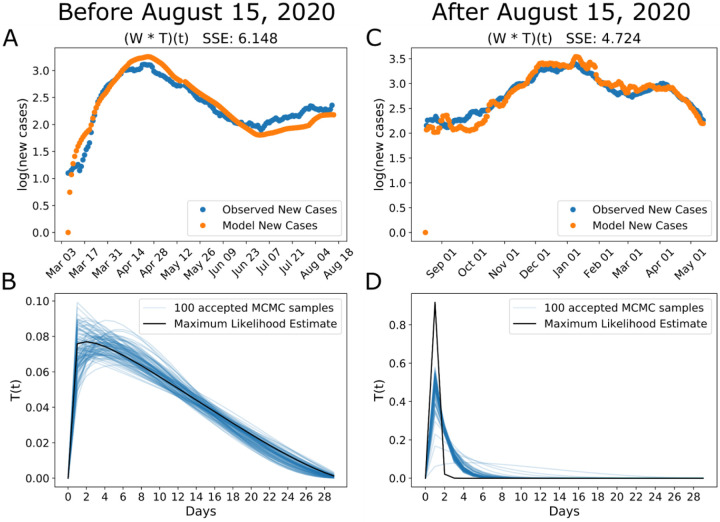
Wastewater surveillance has emerged as a useful tool in the public health response to the COVID-19 pandemic. While wastewater surveillance has been applied at various scales to monitor population-level COVID-19 dynamics, there is a need for quantitative metrics to interpret wastewater data in the context of public health trends. We collected 24-hour composite wastewater samples from March 2020 through May 2021 from a Massachusetts wastewater treatment plant and measured SARS-CoV-2 RNA concentrations using RT-qPCR. We show that the relationship between wastewater viral titers and COVID-19 clinical cases and deaths varies over time. We demonstrate the utility of three new metrics to monitor changes in COVID-19 epidemiology: (1) the ratio between wastewater viral titers and clinical cases (WC ratio), (2) the time lag between wastewater and clinical reporting, and (3) a transfer function between the wastewater and clinical case curves. We find that the WC ratio increases after key events, providing insight into the balance between disease spread and public health response. We also find that wastewater data preceded clinically reported cases in the first wave of the pandemic but did not serve as a leading indicator in the second wave, likely due to increased testing capacity. These three metrics could complement a framework for integrating wastewater surveillance into the public health response to the COVID-19 pandemic and future pandemics.


Conflict of interest statement

Declaration of Competing Interests

MM and NG are cofounders of Biobot Analytics. EJA is advisor to Biobot Analytics. CD, NE, MI, and KAM are employees at Biobot Analytics, and all these authors hold shares in the company.

Figures

Figure 1
Figure 1. SARS-CoV-2 RNA titers in Massachusetts wastewater and new clinical cases.
Seven-day averages of wastewater viral titers (blue) and new clinical cases reported for the three counties in the catchment (orange) (41–43). We marked major holidays (top), major social events (middle), and state reopening phases (bottom) in the three panels, respectively (Baker, 2021a, p. 2, 2021b, 2020a, 2020b, 2020c, 2020d, 2020e, 2020f, n.d.).
Figure 2
Figure 2. Ratio between wastewater viral titers and clinically reported new cases changes with testing availability.
(A) Ratio between seven-day averages of wastewater viral concentration (genome copies/L) and clinically reported new cases changes over the course of the pandemic, with some spikes after key holidays, important events, and reopening phases. (B) PCR tests conducted each day in Massachusetts throughout the pandemic (Massachusetts Department of Public Health, 2021b).
Figure 3
Figure 3. Modeling reveals that time delay between clinical case reporting and wastewater data changes over the course of the pandemic.
We use Approximate Bayesian Computation to determine the distribution of the time lag between when a case shows up in the wastewater surveillance data and when they are clinically reported. (A) Seven-day averages of wastewater data and new clinical case data from Mass.gov shown on a linear scale (Massachusetts Department of Public Health, 2021b, 2020a, 2020b). (B, C, D) Modeling results on data before August 15, 2020. (B) Simulated vs observed wastewater viral titers for data before 8/15. (C) Accepted values for the mean time lag (−6.2 days, 95% CI: −10.1, −2.7) and (D) standard deviation (2.7 days, 95% CI: 0.1, 6.7) of the time lag for data before 8/15. We used 10,000 iterations with a distance threshold of 1.3e-5 and 11.1% of parameter sets were accepted. (E, F, G) Modeling results on data from August 15, 2020 and after. (E) Simulated vs observed wastewater viral titers for data after 8/15. (F) Accepted values for the mean time lag (1.0 days, 95% CI: −2.4, 4.2) and (G) standard deviation (3.5 days, 95% CI: 0.2, 8.4) of the time lag for data after 8/15. We used 10,000 iterations with a distance threshold of 9.5e-7 and 15.3% of parameter sets were accepted. Negative time lags indicate that wastewater signal precedes clinical case reporting and vice versa.
Figure 4
Figure 4. Transfer function between wastewater and clinical cases becomes more peaked in the second wave of the pandemic.
We modeled clinically reported new cases as the convolution between wastewater viral titers and an unknown transfer function. (A, C) Our model finds parameters of a beta function that minimizes the sum of squared error (SSE) between the model prediction (orange) and the observed (blue) clinical new cases. (B, D) The maximum likelihood estimate of the transfer function (black) with 100 accepted Markov Chain Monte Carlo (MCMC) parameter sets in blue. Before 8/15, the transfer function has a broad peak and long tail. After 8/15, the transfer function becomes more sharply peaked.
Figure 5
Figure 5. Wastewater is an early warning of new cases but not deaths, perhaps due to a changing demographic of the pandemic.
(A) Seven-day averages of wastewater viral titers, new clinical cases in the three counties served by the WWTP (Massachusetts Department of Public Health, 2021b, 2020a, 2020b), and new reported deaths in the state of Massachusetts (Massachusetts Department of Public Health, 2021a). All three datasets are normalized by their sums for comparison. (B) Fraction of positive tests in Massachusetts by age bracket (Massachusetts Department of Public Health, 2021c). Positivity peaked among 80+ year-olds in the first wave of the pandemic, whereas the second wave saw an increase in positivity in 0–29 year-olds.

References

    1. Baker C.D., 2021a. Order advancing all communities to Phase III, Step 2 of the Commonwealth’s reopening plan. Commonwealth of Massachusetts Office of the Governor.
    1. Baker C.D., 2021b. Order advancing all communities to Phase IV, Step 1 of the Commonwealth’s reopening plan and transitioning to a travel advisory policy. Commonwealth of Massachusetts Office of the Governor.
    1. Baker C.D., 2020a. Order implementing a phased reopening of workplaces and imposing workplace safety measures to address COVID-19. Commonwealth of Massachusetts Office of the Governor.
    1. Baker C.D., 2020b. Order authorizing the re-opening of Phase II enterprises. Commonwealth of Massachusetts Office of the Governor.
    1. Baker C.D., 2020c. Order further advancing the re-opening of Phase II enterprises. Commonwealth of Massachusetts Office of the Governor.

Publication types