[Preprint]. 2021 Jun 17:2021.06.14.21258567.
doi: 10.1101/2021.06.14.21258567.

Subcutaneous REGEN-COV Antibody Combination for Covid-19 Prevention

Affiliations

Subcutaneous REGEN-COV Antibody Combination for Covid-19 Prevention

Meagan P O'Brien et al. medRxiv. .

Update in

  • Subcutaneous REGEN-COV Antibody Combination to Prevent Covid-19.
    O'Brien MP, Forleo-Neto E, Musser BJ, Isa F, Chan KC, Sarkar N, Bar KJ, Barnabas RV, Barouch DH, Cohen MS, Hurt CB, Burwen DR, Marovich MA, Hou P, Heirman I, Davis JD, Turner KC, Ramesh D, Mahmood A, Hooper AT, Hamilton JD, Kim Y, Purcell LA, Baum A, Kyratsous CA, Krainson J, Perez-Perez R, Mohseni R, Kowal B, DiCioccio AT, Stahl N, Lipsich L, Braunstein N, Herman G, Yancopoulos GD, Weinreich DM; Covid-19 Phase 3 Prevention Trial Team. O'Brien MP, et al. N Engl J Med. 2021 Sep 23;385(13):1184-1195. doi: 10.1056/NEJMoa2109682. Epub 2021 Aug 4. N Engl J Med. 2021. PMID: 34347950 Free PMC article. Clinical Trial.

Abstract

Background: Casirivimab and imdevimab (REGEN-COV™) markedly reduces risk of hospitalization or death in high-risk individuals with Covid-19. Here we explore the possibility that subcutaneous REGEN-COV prevents SARS-CoV-2 infection and subsequent Covid-19 in individuals at high risk of contracting SARS-CoV-2 by close exposure in a household with a documented SARS-CoV-2-infected individual.

Methods: Individuals ≥12 years were enrolled within 96 hours of a household contact being diagnosed with SARS-CoV-2 and randomized 1:1 to receive 1200 mg REGEN-COV or placebo via subcutaneous injection. The primary efficacy endpoint was the proportion of participants without evidence of infection (SARS-CoV-2 RT-qPCR-negative) or prior immunity (seronegative) who subsequently developed symptomatic SARS-CoV-2 infection during a 28-day efficacy assessment period.

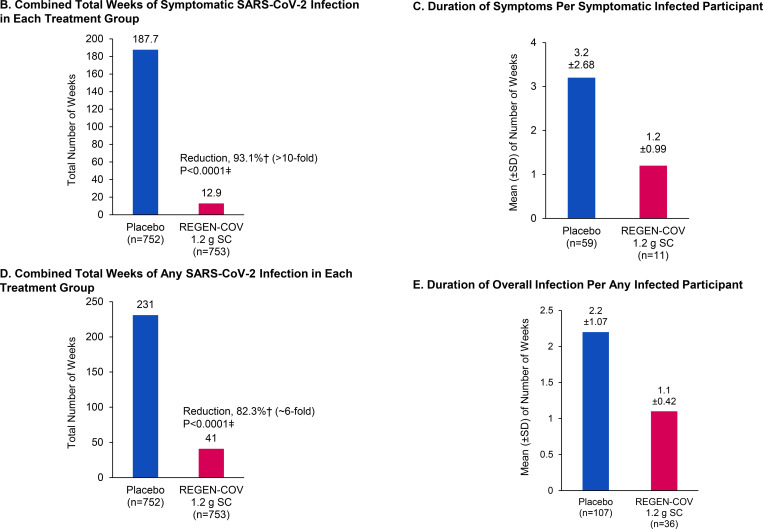
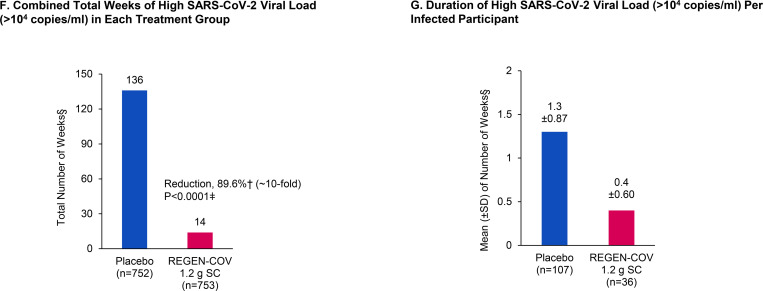
Results: Subcutaneous REGEN-COV significantly prevented symptomatic SARS-CoV-2 infection compared with placebo (81.4% risk reduction; 11/753 [1.5%] vs. 59/752 [7.8%], respectively; P<0.0001), with 92.6% risk reduction after the first week (2/753 [0.3%] vs. 27/752 [3.6%], respectively). REGEN-COV also prevented overall infections, either symptomatic or asymptomatic (66.4% risk reduction). Among infected participants, the median time to resolution of symptoms was 2 weeks shorter with REGEN-COV vs. placebo (1.2 vs. 3.2 weeks, respectively), and the duration of time with high viral load (>104 copies/mL) was lower (0.4 vs. 1.3 weeks, respectively). REGEN-COV was generally well tolerated.

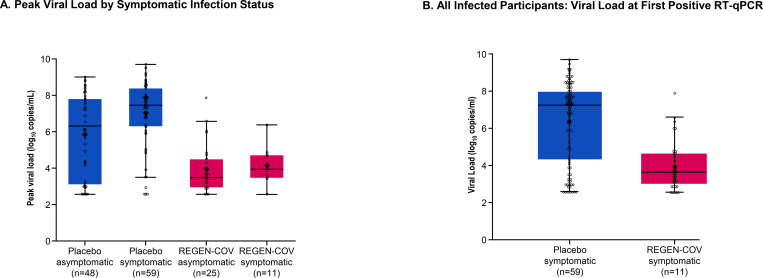
Conclusions: Administration of subcutaneous REGEN-COV prevented symptomatic Covid-19 and asymptomatic SARS-CoV-2 infection in uninfected household contacts of infected individuals. Among individuals who became infected, REGEN-COV reduced the duration of symptomatic disease, decreased maximal viral load, and reduced the duration of detectable virus.(ClinicalTrials.gov number, NCT04452318.).


Figures

Figure 1.
Figure 1.. REGEN-COV Reduces Symptomatic Infection in Those Who Are Uninfected at Baseline.
Panel A shows cumulative incidence of symptomatic infection following administration of REGEN-COV or placebo. Panel B shows combined total weeks of symptomatic SARS-CoV-2 infection in each treatment group. Panel C shows duration of symptoms per symptomatic infected participant. Panel D shows combined total weeks of any SARS-CoV-2 infection in each treatment group. Panel E shows duration of overall infection per any infected participant. Panel F shows combined total weeks of high SARS-CoV-2 viral load (>104 copies/ml) in each treatment group. Panel G shows duration of high SARS-CoV-2 viral load (>104 copies/ml) per infected participant. *Based on a logistic regression model including fixed category effects of treatment group (placebo vs. REGEN-COV), region (US vs. ex-US), and age (≥12 to <50 years of age, ≥50 years of age). †Based on the normalized weeks per 1000 participants.

ǂBased on a stratified Wilcoxon rank sum test (van Elteren test) with region (US vs. ex-US) and age group (12 to <50 years of age vs. ≥50 years of age) as strata. §If a visit had missing viral load data, that visit was not included in the analysis. Only participants with at least one post-baseline viral load nasopharyngeal swab samples were included in this analysis. CI denotes confidence interval, SARS-CoV-2 severe acute respiratory syndrome coronavirus 2, SC subcutaneous, and SD standard deviation.
Figure 2.
Figure 2.. Individuals Who Become Infected Despite REGEN-COV Treatment Demonstrate Lower Viral Burden Compared With Placebo-Treated Individuals.
Panel A shows peak viral load by symptomatic infection status. Panel B shows all infected participants: viral load at first positive RT-qPCR. Panel C shows infected participants by symptoms: viral load at first positive RT-qPCR. Lines in the boxes represent the median. Large, bolded dots in the boxes represent the mean. Bottom and top of boxes represent quartiles 1 (25th percentile) and 3 (75th percentile), respectively. Whiskers represent the 1.5 times interquartile range. RT-qPCR denotes quantitative real-time polymerase chain reaction, and SC subcutaneous.

References

    1. Zhu N, Zhang D, Wang W, et al. A Novel Coronavirus from Patients with Pneumonia in China, 2019. N Engl J Med 2020;382:727–33. - PMC - PubMed
    1. WHO Director-General’s opening remarks at the media briefing on COVID-19 – 11 March 2020. 2020. at https://www.who.int/director-general/speeches/detail/who-director-genera....)
    1. Wu F, Zhao S, Yu B, et al. A new coronavirus associated with human respiratory disease in China. Nature 2020;579:265–9. - PMC - PubMed
    1. Baum A, Fulton BO, Wloga E, et al. Antibody cocktail to SARS-CoV-2 spike protein prevents rapid mutational escape seen with individual antibodies. Science 2020;369:1014–8. - PMC - PubMed
    1. Copin R, Baum A, Wloga E, et al. The monoclonal antibody combination REGEN-COV protects against SARS-CoV-2 mutational escape in preclinical and human studies. Cell 2021. - PMC - PubMed

Publication types

Associated data