. 2021 Jul;196(3):649-665.
doi: 10.1007/s00442-021-04967-y. Epub 2021 Jun 22.

The role of habitat configuration in shaping animal population processes: a framework to generate quantitative predictions

Affiliations

The role of habitat configuration in shaping animal population processes: a framework to generate quantitative predictions

Peng He et al. Oecologia. 2021 Jul.

Abstract

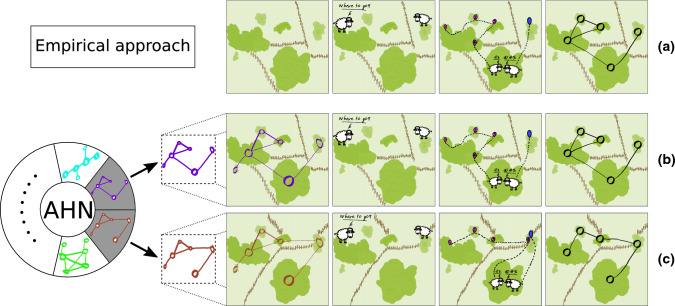
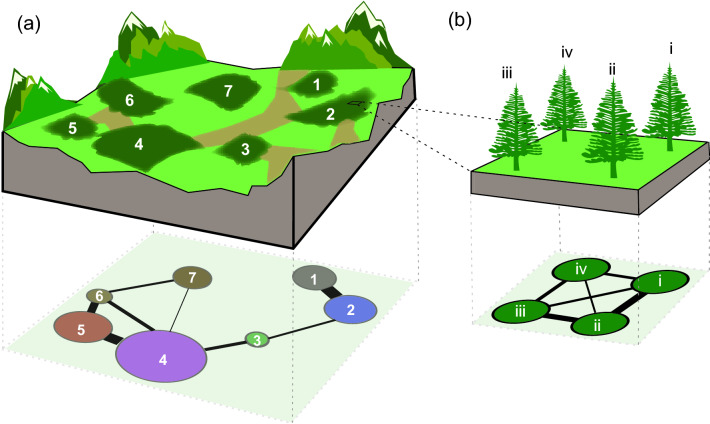
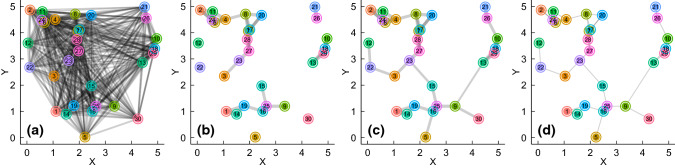
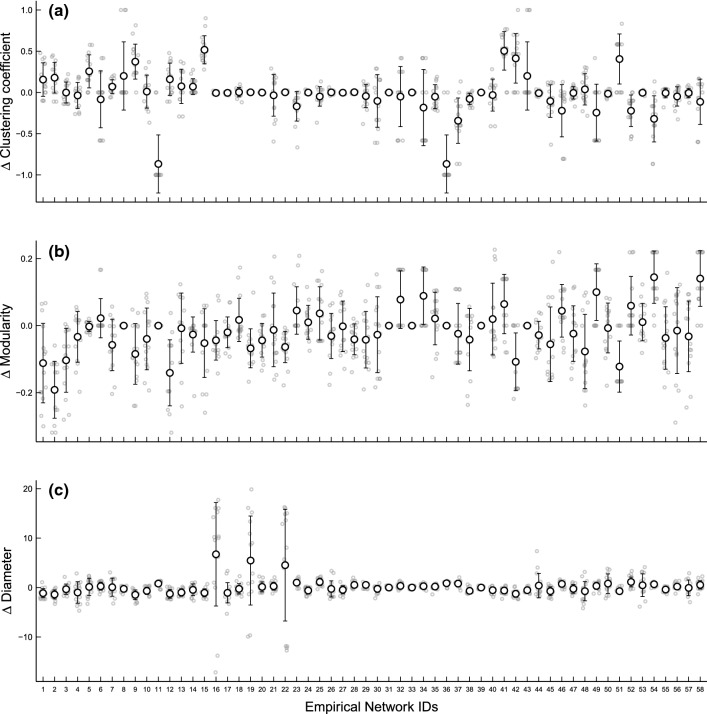
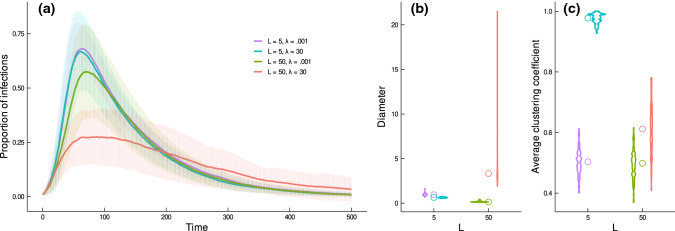
By shaping where individuals move, habitat configuration can fundamentally structure animal populations. Yet, we currently lack a framework for generating quantitative predictions about the role of habitat configuration in modulating population outcomes. To address this gap, we propose a modelling framework inspired by studies using networks to characterize habitat connectivity. We first define animal habitat networks, explain how they can integrate information about the different configurational features of animal habitats, and highlight the need for a bottom-up generative model that can depict realistic variations in habitat potential connectivity. Second, we describe a model for simulating animal habitat networks (available in the R package AnimalHabitatNetwork), and demonstrate its ability to generate alternative habitat configurations based on empirical data, which forms the basis for exploring the consequences of alternative habitat structures. Finally, we lay out three key research questions and demonstrate how our framework can address them. By simulating the spread of a pathogen within a population, we show how transmission properties can be impacted by both local potential connectivity and landscape-level characteristics of habitats. Our study highlights the importance of considering the underlying habitat configuration in studies linking social structure with population-level outcomes.

Keywords: Habitat configuration; Habitat networks; Landscape connectivity; Movement networks; Social networks.


Conflict of interest statement

We have no conflicting interest with this paper.

Figures

Fig. 1
Fig. 1
Two distinct approaches for understanding the role of habitat configuration in shaping animal population (or community) structures. a In most studies, animals are observed living and moving (e.g. via GPS tracking) within given time windows in specific habitats, from which characteristics of the connectivity of the focal habitat area are inferred or modelled (e.g. by resistance surface modelling, network-based landscape connectivity modelling, or circuit theory). By contrast, (b) with a bottom–up approach, we can simulate networks to depict the physical configurations of specific habitats, and then model individual movements (or more complex behaviours) in these habitats, from which we can gain sights on how observed structures (e.g. patterns of movements and social interactions) emerged. With this approach, we can also (c) simulate habitat networks controlling for key parameters (e.g. network connectivity), thus producing alternative scenarios that can control (or not) for features that are hypothesized to play a major role in shaping biological processes in populations. Here, we illustrate two simulated networks, one of which (b) can exactly depict the configuration of the given habitat for the focal species (a), while the other depicts a habitat that maintains some characteristics (e.g. the same distributions and sizes of habitat patches, represented by nodes) as the given habitat (a), but provides alternative patterns of potential connectivity (by randomizing the spatial distribution of movement barriers that determine which patches are connected)
Fig. 2
Fig. 2
Networks explicitly characterizing the physical configurations of animal habitats. We illustrate how five dimensions for assessing habitat configuration proposed by Tokeshi and Arakaki (2012) can be integrated and applied to construct animal habitat networks. These dimensions are (1) spatial scale (spatial resolution and extent), (2) composition diversity (heterogeneity), (3) size (area), (4) abundance or density (number of discrete habitat units per area), and (5) spatial arrangement (distribution) of habitat components. (a) A hypothetical landscape composed by forest fragments (numbered components) within a heterogeneous matrix with potential movement corridors (light green, which account for the presences of links between nodes) and physical barriers (light brown, which account for the absence of links between nodes). The physical features and spatial organization of the habitat components can be represented by a connected network at a large spatial scale, with a high composition diversity (fragments of different tree species), different habitat sizes (small and large fragments), high abundance (7 fragments), and heterogeneous spatial arrangement (fragments unequally distributed and connected by movement corridors across the landscape). (b) The physical features and spatial arrangement of habitat components can be characterized at different spatial scales. Here, part of the forest (fragment 2) can be represented by a connected network at a finer spatial scale (e.g. trees as habitat components), with a low composition diversity (the same tree species), small habitat size (single trees), low abundance of components (4 trees), and uniform spatial arrangement. In the two habitat networks, the compositional diversity (or quality) and size (or carrying capacity) of habitat components are characterized by node attributes (colours and sizes), the abundance by the number of nodes in the networks, and the spatial arrangement by the patterns of connectivity and the distribution of link weights (both as a function of the Euclidean distances between habitat components)
Fig. 3
Fig. 3
The workflow of the AHN model for generating animal habitat networks. First, (a) the algorithm constructs a fully connected and weighted habitat network. Here, numbered nodes represent 30 habitat components colour-coded by their attributes (such as their sizes, quality or compositions, with continuous or discrete colour palette) and connected by links whose thicknesses indicate the strength of the spatial relationship between the two habitat components, and is determined by the spatial positions of the nodes. The network is defined in a conceived 2-dimensional landscape in which the x and y axes indicate the spatial extents of the landscape (here the aspect ratio is 1, i.e. A=L2, but the model allows any x and y extents for capturing the diverse landscape geometry), therefore, it inherits spatial properties of the landscape. Next, (b) the algorithm removes the link between node i and j (ij) from the network with probability P(Dij); in this example, it results in a disconnected habitat network. Then, (c) the (disconnected) network components can be rewired with minimal number of links if a connected network is wanted. Finally, (d) the habitat network can be transformed to unweighted, if so desired (e.g. when we are interested only in the patterns of potential connections while their attributes are irrelevant to our hypotheses)
Fig. 4
Fig. 4
The AHN model can simulate spatially explicit networks to characterize habitat potential connectivity. Each grey circle denotes the difference in each of the three metrics (y-axes, a, b, c) between each of the 15 replicated random habitat networks generated by the AHN model with each set of best-fitting parameters identified from the given parameter space and the corresponding empirical network; black circles and bars characterize the means and the standard deviations
Fig. 5
Fig. 5
The application of the AHN model for understanding the role of habitat geometry and potential connectivity in mediating pathogen transmission dynamics in habitat-structured animal populations. a The transmission of pathogens in populations is dependent on both the landscape geometry (shape), depicted by L where a larger value represents landscapes with a larger aspect ratio, and the extent to which the potential connections between patches to be determined by the habitat features between them, depicted by λ, where a lower value corresponds to a weaker deterministic effect of how the species’ movement characteristics interact with the environmental features on the potential connectivity between patches with given spatial proximity. Simulations show that the transmission dynamics, when individual mobility is at a medium level (1-ps=0.5) under an infection rate of π=0.05 and a recovery rate of ρ=0.01, are impacted by habitat shape and potential connectivity. Specifically, habitats with a larger aspect ratio (a larger L value) and with their potential connectivity determined with a stronger deterministic effect of the configurational features on the potential connectivity between patches with given spatial proximity (i.e. a larger λ value) have the smallest disease outbreaks (each curve indicates the mean percentage of infected individuals in a population of 100 individuals moving on simulated habitat networks comprising 20 nodes, over 500 timesteps, with bars indicating the standard deviations from 100 replications). The interaction between landscape shape and the degree to which between-patch potential connectivity is determined by habitat configurational features affects the structural properties of habitat networks, such as diameter (b) and (average) clustering coefficient (c). Open circles (in b and c) indicate medians

References

    1. Albert R, Jeong H, Barabasi AL. Internet—diameter of the world-wide web. Nature. 1999;401:130–131. doi: 10.1038/43601. - DOI
    1. Allen B, et al. Evolutionary dynamics on any population structure. Nature. 2017;544:227–230. doi: 10.1038/nature21723. - DOI - PubMed
    1. Altermatt F, Holyoak M. Spatial clustering of habitat structure effects patterns of community composition and diversity. Ecology. 2012;93:1125–1133. doi: 10.1890/11-1190.1. - DOI - PubMed
    1. Alther R, Altermatt F. Fluvial network topology shapes communities of native and non-native amphipods. Ecosphere. 2018;9:e02102. doi: 10.1002/ecs2.2102. - DOI
    1. Altizer S, et al. Social organization and parasite risk in mammals: integrating theory and empirical studies. Annu Rev Ecol Evol S. 2003;34:517–547. doi: 10.1146/annurev.ecolsys.34.030102.151725. - DOI

LinkOut - more resources