

TMPRSS2 expression dictates the entry route used by SARS-CoV-2 to infect host cells
- PMID: 34159616
- PMCID: PMC8365257
- DOI: 10.15252/embj.2021107821
TMPRSS2 expression dictates the entry route used by SARS-CoV-2 to infect host cells
Abstract
SARS-CoV-2 is a newly emerged coronavirus that caused the global COVID-19 outbreak in early 2020. COVID-19 is primarily associated with lung injury, but many other clinical symptoms such as loss of smell and taste demonstrated broad tissue tropism of the virus. Early SARS-CoV-2-host cell interactions and entry mechanisms remain poorly understood. Investigating SARS-CoV-2 infection in tissue culture, we found that the protease TMPRSS2 determines the entry pathway used by the virus. In the presence of TMPRSS2, the proteolytic process of SARS-CoV-2 was completed at the plasma membrane, and the virus rapidly entered the cells within 10 min in a pH-independent manner. When target cells lacked TMPRSS2 expression, the virus was endocytosed and sorted into endolysosomes, from which SARS-CoV-2 entered the cytosol via acid-activated cathepsin L protease 40-60 min post-infection. Overexpression of TMPRSS2 in non-TMPRSS2 expressing cells abolished the dependence of infection on the cathepsin L pathway and restored sensitivity to the TMPRSS2 inhibitors. Together, our results indicate that SARS-CoV-2 infects cells through distinct, mutually exclusive entry routes and highlight the importance of TMPRSS2 for SARS-CoV-2 sorting into either pathway.
Keywords: COVID-19; Coronavirus; SARS-CoV-2; protease; virus entry.
© 2021 The Authors. Published under the terms of the CC BY NC ND 4.0 license.
Conflict of interest statement
The authors declare that they have no conflict of interest.
Figures
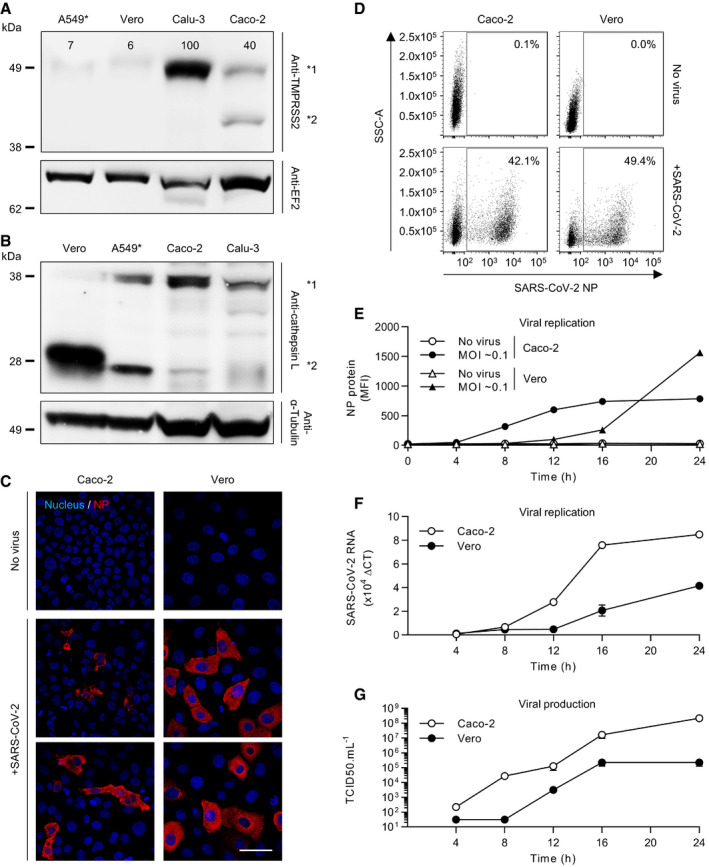
- A, B
Cells were lysed and analyzed by SDS–PAGE and Western blotting under nonreducing conditions (A) or reducing conditions (B). TMPRSS2 levels are expressed as percentages of TMPRSS2 levels in Calu‐3 cells normalized to levels of EF2. *1 indicates TMPRSS2 (A) and procathepsin L (B), and *2 shows cleaved TMPRSS2 (A) and cathepsin L (B). A549*, ACE2‐expressing A549 cells; EF2, elongation factor 2.
- C
Vero and Caco‐2 cells were infected with SARS‐CoV‐2 at MOIs of 0.2 for 8 h. Infected cells were then permeabilized and immunostained for the intracellular SARS‐CoV‐2 nucleoprotein (NP, red). Nuclei were stained with Hoechst (blue) before imaging by fluorescence confocal microscopy. Scale bars: 100 µm.
- D
Vero and Caco‐2 cells were exposed to SARS‐CoV‐2 at MOIs of 0.3 and 0.2, respectively, and harvested 16 h later. After fixation and permeabilization, infected cells were stained with the primary mAb against NP. Infection was analyzed by flow cytometry. SSC‐A = side scatter‐area.
- E
Infection of Vero and Caco‐2 cells was monitored over 24 h using the same flow cytometry‐based assay used for the experiment shown in panel D. Infection is given as the total fluorescence associated with the NP protein‐positive cells. MFI, mean fluorescence intensity. n = 3.
- F
SARS‐CoV‐2 mRNA levels were quantified by qRT–PCR in both Vero and Caco‐2 cells infected at MOIs of 0.3 and 0.4, respectively, for up to 24 h. n = 3.
- G
Supernatants from infected cells were collected during the time course in F and assessed for the production of new infectious viral particles using a TCID50 assay on naïve Vero cells. n = 3–6.
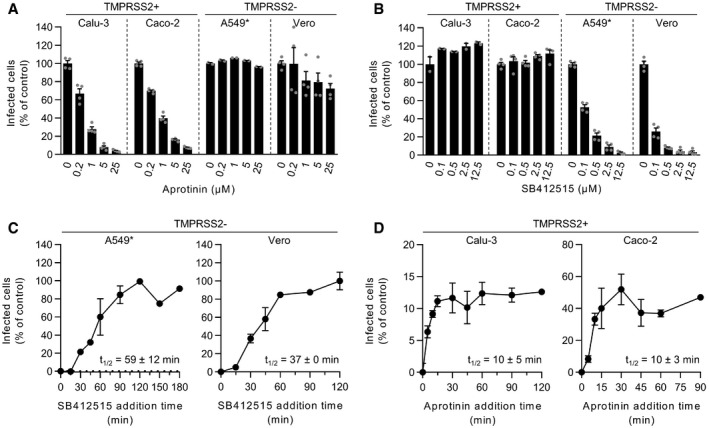
- A, B
Cells were pretreated with the indicated concentrations of aprotinin (A) and SB412515 (B), which are inhibitors of TMPRSS2 and cathepsin L, respectively. Infection of Calu‐3, Caco‐2, A549*, and Vero cells with SARS‐CoV‐2 at MOIs of 0.3, 0.4, 0.2, and 0.3, respectively, was achieved in the continuous presence of the drug. Infected cells were quantified by flow cytometry as described in Fig 1D, and data were normalized to samples where inhibitors had been omitted. n = 2–4 biological replicates.
- C, D
SARS‐CoV‐2 particles were bound to A549* and Vero cells (MOIs 0.2 and 0.3, respectively) (C) or Calu‐3 and Caco‐2 cells (0.6 and 0.5, respectively) (D) on ice for 90 min and subsequently warmed rapidly to 37°C to allow infectious penetration. SB412515 (10 µM, C) or aprotinin (30 µM, D) was added at different times postwarming to block further proteolytic activation. Infection was analyzed by flow cytometry, and data were normalized to samples where protease inhibitors had been omitted. n = 2.
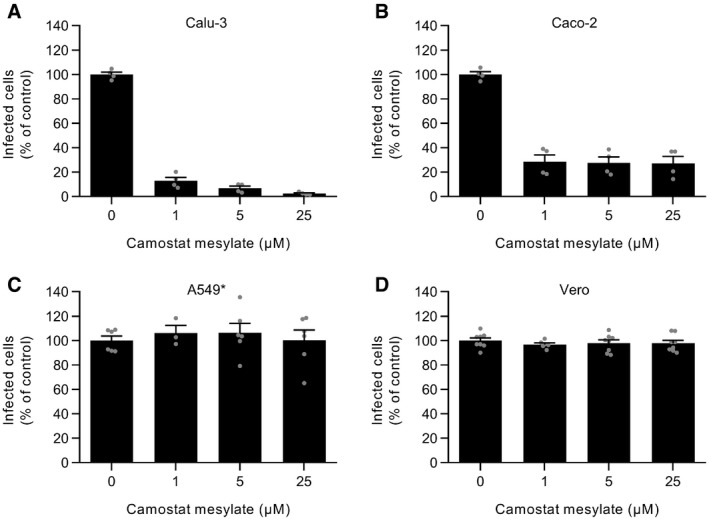
- A–D
Calu‐3, Caco‐2, A549*, and Vero cells were pretreated with camostat mesylate, which selectively inhibits TMPRSS2, at the indicated concentrations and subsequently infected with SARS‐CoV‐2 (MOI ˜0.3, 0.4, 0.2, and 0.3, respectively) in the continuous presence of the drug. The proportion of infected cells was quantified by flow cytometry as described in Fig 1D, and data were normalized to that from control samples where camostat mesylate had been omitted. n (A and B) = 4 and n (C and D) = 3–8.
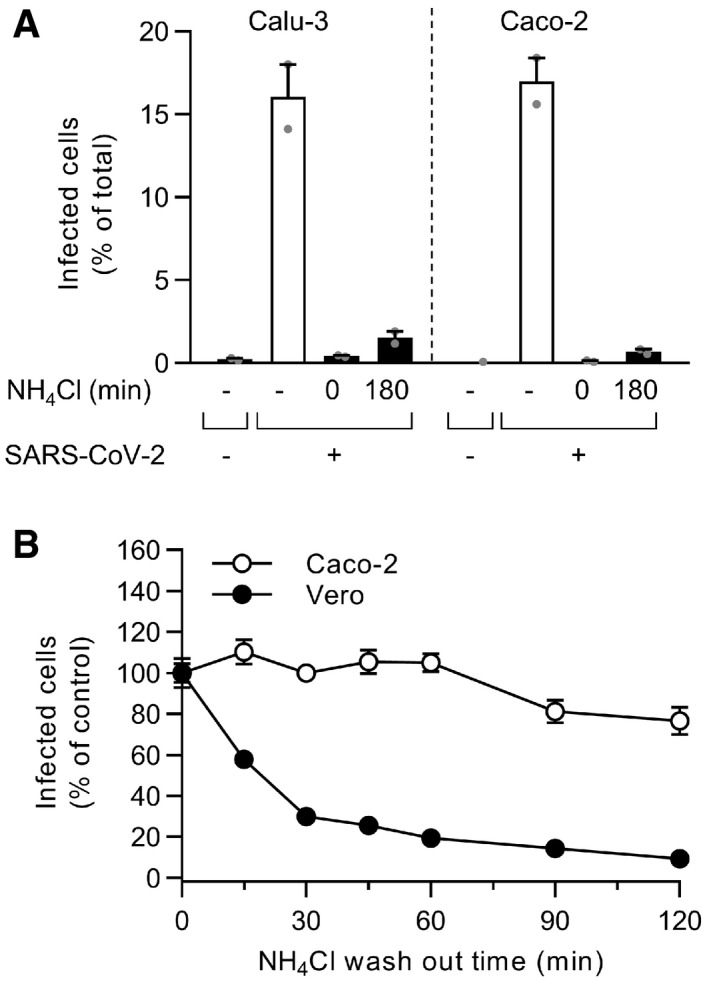
The controls of Fig 3E are shown here. Briefly, binding of SARS‐CoV‐2 to Calu‐3 or Caco‐2 cells (MOI ˜0.6 and 0.5) was synchronized on ice for 90 min. Subsequently, cells were rapidly shifted to 37°C to allow penetration. NH4Cl (75 mM) was added 3 hpi to neutralize endosomal pH. Infection was analyzed by flow cytometry, and raw data are shown. n = 1–2.
After the synchronization of SARS‐CoV‐2 binding to Caco‐2 and Vero cells (MOI ˜0.5 and 0.3, respectively) on ice for 90 min, NH4Cl (50 mM) was added and then washed out at the indicated time points to allow endosomal acidification and the acid‐dependent step of SARS‐CoV‐2 infectious penetration. Infection was analyzed by flow cytometry, and values were normalized to those from samples for which NH4Cl was removed at t0. n = 2.
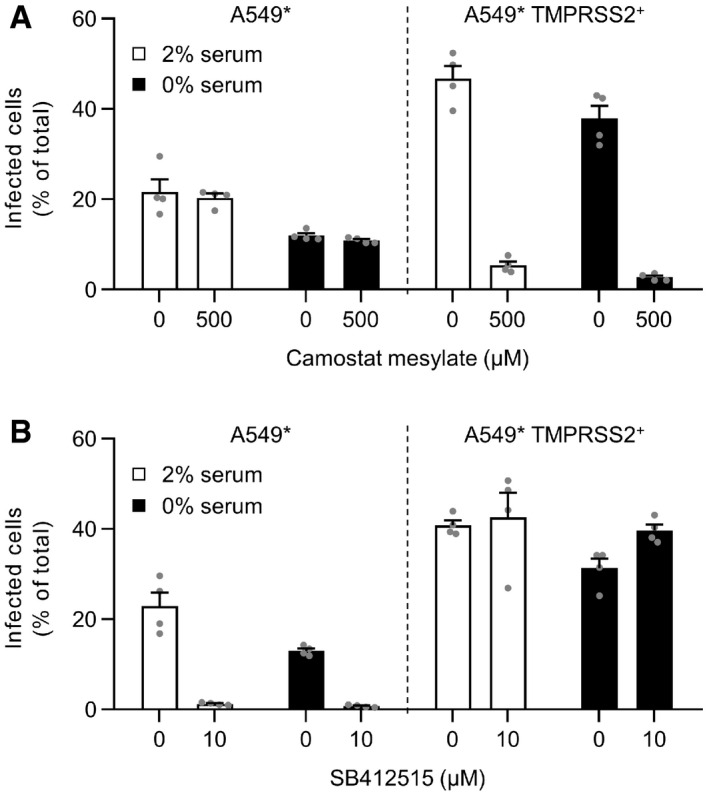
- A, B
A549* cells expressing or lacking TMPRSS2 were pretreated with camostat mesylate at 500 µM (A) or SB412515 at 10 µM (B) and subsequently infected with SARS‐CoV‐2 (MOI of 0.2) produced in the presence or absence of serum. Infection was performed in the continuous presence of the drugs. Infected cells were quantified by flow cytometry as described in Fig 1D, and data were normalized to samples where inhibitors had been omitted. n = 4.
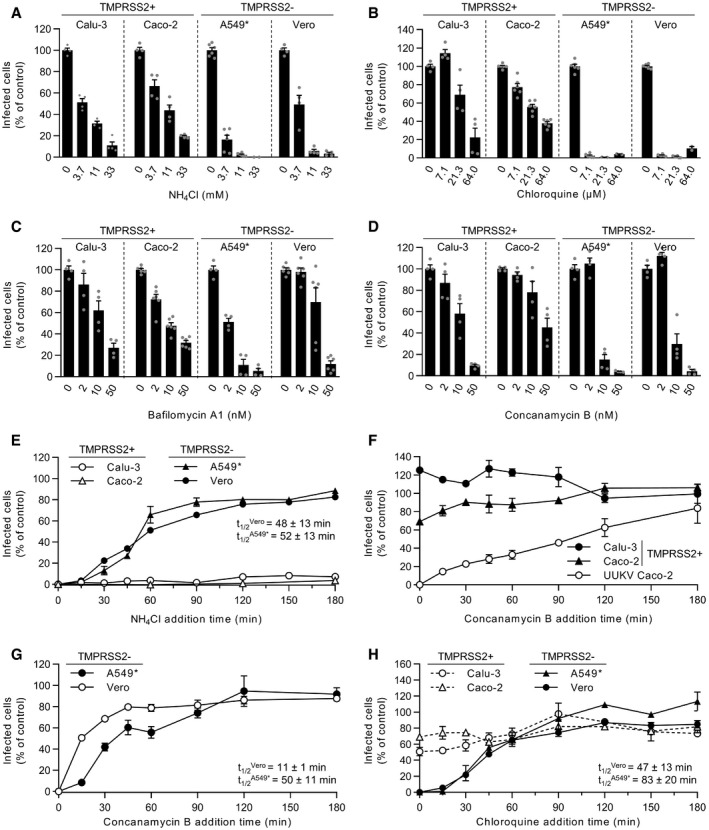
- A–D
Cells were pretreated with endosomal pH‐interfering drugs at the indicated concentrations and subsequently infected with SARS‐CoV‐2 as described in Fig 2A and B in the continuous presence of NH4Cl (A), chloroquine (B), bafilomycin A1 (C), or concanamycin B (D). The proportion of infected cells was quantified by flow cytometry as described in Fig 1D, and data were normalized to control samples that were not treated with inhibitors. n = 2–6 biological replicates.
- E
Binding of SARS‐CoV‐2 to Calu‐3, Caco‐2, A549*, and Vero cells (MOIs of 0.5, 0.6, 0.2, and 0.3, respectively) was synchronized on ice for 90 min. Subsequently, cells were rapidly shifted to 37°C to allow penetration. NH4Cl (50 mM for A549* and Vero cells, and 75 mM for Calu‐3 and Caco‐2 cells) was added at the indicated times to neutralize endosomal pH and block the acid‐dependent step of SARS‐CoV‐2 infectious penetration. The proportion of infected cells was analyzed by flow cytometry, and data were normalized to that from control samples that had not been treated with NH4Cl. n = 2.
- F, G
Same as in (E) but using concanamycin B (50 nM) instead of NH4Cl. Uukuniemi virus (UUKV) was used at a MOI of 150 to control the efficiency of concanamycin B to neutralize endosomal pH in Caco‐2 cells. n = 2.
- H
Same as in (E) but using chloroquine instead of NH4Cl. n = 2.
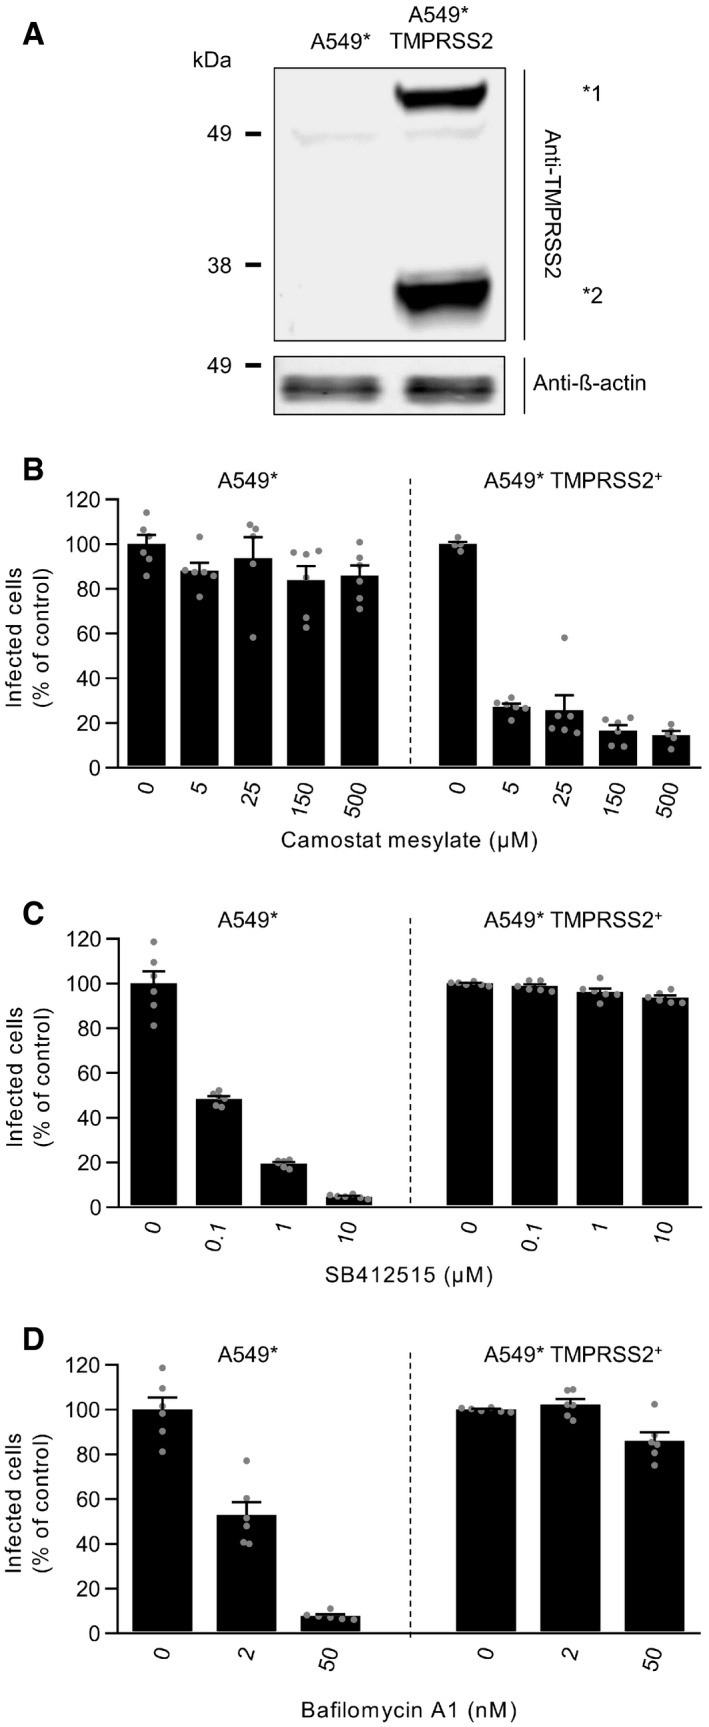
- A
TMPRSS2‐overexpressing and parental A549* cells were lysed and subjected to SDS–PAGE and Western blot analysis under reducing conditions. *1 and *2 indicate the full‐length and cleaved forms of TMPRSS2, respectively.
- B–D
A549* cells expressing or lacking TMPRSS2 were pretreated with the indicated concentrations of camostat mesylate (B), SB412515 (C), and bafilomycin A1 (D). Infection with SARS‐CoV‐2 (MOI ˜0.2) was achieved in the continuous presence of the drug. Infected cells were quantified by flow cytometry as described in Fig 1D, and data were normalized to samples where inhibitors had been omitted. n = 5–6 biological replicates.
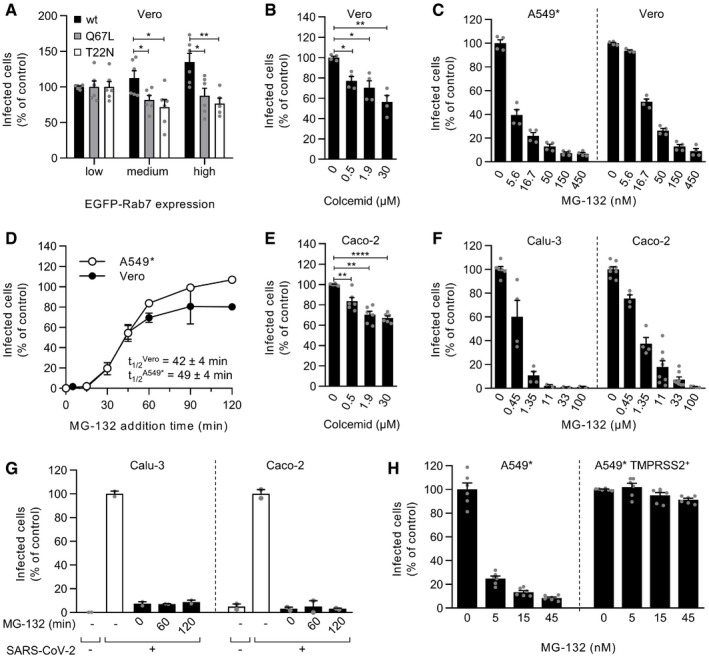
- A
EGFP‐Rab7a wild‐type (wt), Q79L (constitutively active mutant), and T22N (dominant‐negative mutant) were transiently expressed in Vero cells. The cells were then infected with SARS‐CoV‐2 at an MOI of ˜0.3. Using flow cytometry, cell populations with levels of EGFP‐Rab7a expression varying by roughly one‐log increments were selected, and the proportion of infected cells within each population was quantified at 8 hpi. Data were normalized to that of the cell population with the lowest EGFP‐Rab7a intensity. Unpaired t‐test with Welch’s correction was applied. *P < 0.05; **P < 0.01. n = 5–6 biological replicates.
- B, C
Vero and A549* cells were pretreated with colcemid (B) or MG‐132 (C) at the indicated concentrations and subsequently infected with SARS‐CoV‐2 (MOIs ˜0.3 and 0.2, respectively) in the continuous presence of inhibitors. Infection was analyzed by flow cytometry, and data were normalized to samples where inhibitors had been omitted. n = 3–4 biological replicates. Unpaired t‐test with Welch’s correction was applied. *P < 0.05; **P < 0.01; ****P < 0.0001.
- D
SARS‐CoV‐2 particles were bound to A549* and Vero cells (MOIs of 0.2 and 0.3, respectively) on ice for 90 min and then switched rapidly to 37°C to allow infectious penetration. MG‐132 (3.7 µM) was added to cells at the indicated times to block further late endosomal maturation. Infection was analyzed by flow cytometry, and data were normalized to that of control samples that had not been treated with MG‐132. n = 2.
- E
As in panel B but using a MOI of 0.4 and Caco‐2 cells instead of Vero cells. n = 6 biological replicates.
- F
As in panel C but using a MOI of 0.3 and 0.4 and Calu‐3 and Caco‐2 cells. n = 2–8 biological replicates.
- G
The timing of the MG‐132‐sensitive step during SARS‐CoV‐2 infectious entry into Calu‐3 and Caco‐2 cells was assayed as detailed in D but using 60 µM MG‐132 for Caco‐2 cells and MOIs of 0.5 and 0.6, respectively. n = 2.
- H
A549* cells expressing or lacking TMPRSS2 were pretreated with MG‐132 at the indicated concentrations and subsequently infected with SARS‐CoV‐2 (MOI ˜0.2) in the continuous presence of the drug. The proportion of infected cells was quantified by flow cytometry as described in Fig 1D, and data were normalized to that from control samples for which MG‐132 had been omitted. n = 6 biological replicates.
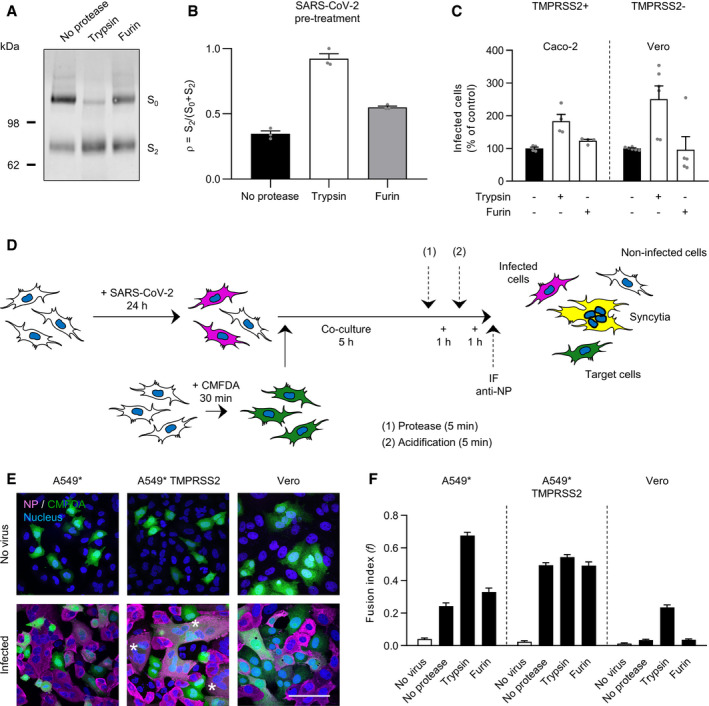
SDS–PAGE and Western blot analysis of SARS‐CoV‐2 particles treated with trypsin or furin under reducing conditions. S was detected using a rabbit antibody against the SARS‐CoV‐2 S2 region.
SARS‐CoV‐2 regions S0 (uncleaved) and S2 (cleaved) were semiquantified from (A), and the proportion of S2 on viral particles is shown as (ρ) = S2/S0+S2. n = 3.
SARS‐CoV‐2 was subjected to pretreatment with trypsin and furin for 15 min at 37°C prior to infection of Caco‐2 and Vero cells (MOIs of 0.4 and 0.3, respectively). Infected cells were quantified by flow cytometry as described in Fig 1D. Data were normalized to samples not pretreated with trypsin. n = 4–6 biological replicates.
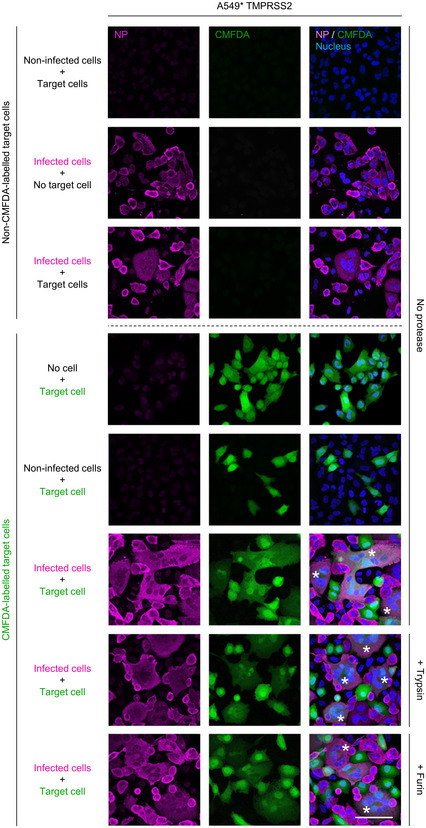
Depicts the cell–cell fusion model employed in this study. (1) or (2) indicates treatment with either exogenous proteases or low‐pH buffers; CMFDA, cytosolic green dye; IF anti‐NP, immunofluorescence staining against the SARS‐CoV‐2 nucleoprotein.
A549* expressing or lacking TMPRSS2 cells and Vero cells were first infected with SARS‐CoV‐2 at MOIs of 0.1 and 0.2, respectively, for 24 h and then cocultured for 5 h along with target cells, not infected but prestained with CMFDA, a cytosolic green dye. Cells were subsequently treated with trypsin or furin for 5 min at 37°C and left to coculture for an additional hour at 37°C. After fixation, nuclei were stained with Hoechst (blue), and infected cells were subjected to immunofluorescence staining against SARS‐CoV‐2 nucleoprotein (magenta). Samples were ultimately imaged by confocal fluorescence microscopy. White stars indicate syncytia with at least four nuclei. Scale bars: 100 µm.
Images of microscope fields obtained in (E) were quantified [A549*: n (no virus) = 30, n (no protease) = 80, n (trypsin) = 80, and n (furin) = 60; A549* TMPRSS2: n (no virus) = 30, n (no protease) = 80, n (trypsin) = 79, and n (furin) = 60; Vero: n (no virus) = 40, n (no protease) = 112, n (trypsin) = 114, and n (furin) = 60]. The fusion index is given as f = 1 – [(number of cells in a field after fusion)/(number of nuclei)].
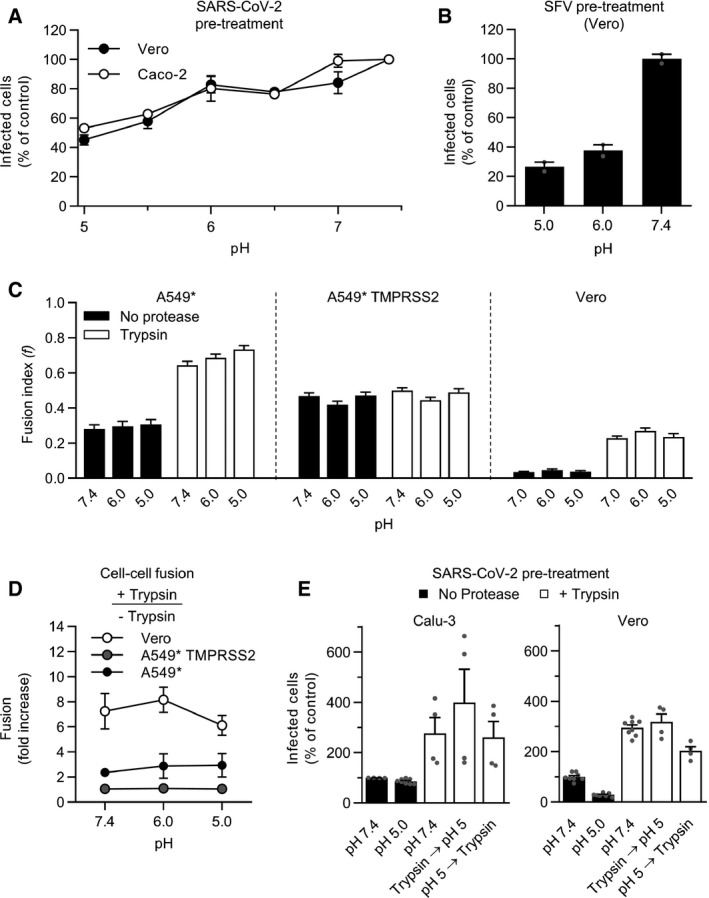
- A, B
(A) SARS‐CoV‐2 and (B) Semliki forest virus (SFV) particles were pretreated at the indicated pH for 10 min at 37°C. Viruses were subsequently neutralized with buffer at pH ˜7.4 and allowed to infect Caco‐2 (MOI ˜0.4) and Vero cells (MOI of 0.3 and 0.8, respectively). Infected cells were then immunostained against the NP protein and SFV E2 protein, respectively, and analyzed by flow cytometry. Data are normalized to that of samples pretreated with buffers at pH ˜7.4. n = 2.
- C
Samples were prepared as described in Fig 6E but, after trypsin treatment, infected cells were subjected to buffers at the indicated pH for 5 min at 37°C and left to recover for an additional hour at 37°C. Images of microscope fields (50 < n < 120) were quantified, and fusion index was calculated as in Fig 6F. n > 50 microscope fields were analyzed.
- D
Cell–cell fusion after trypsin treatment according to pH. The fusion is given as the ratio of the values obtained for trypsin‐treated samples to those obtained for untreated samples. n = 3–4.
- E
SARS‐CoV‐2 particles (MOI of 0.3) were first subjected to trypsin treatment for 15 min at 37°C and then exposed to buffers at the indicated pH for 10 min at 37°C, and vice versa. Calu‐3 and Vero cells were then infected at a MOI of 0.3 and analyzed by flow cytometry as described in Fig 1D. n = 4–8 biological replicates.
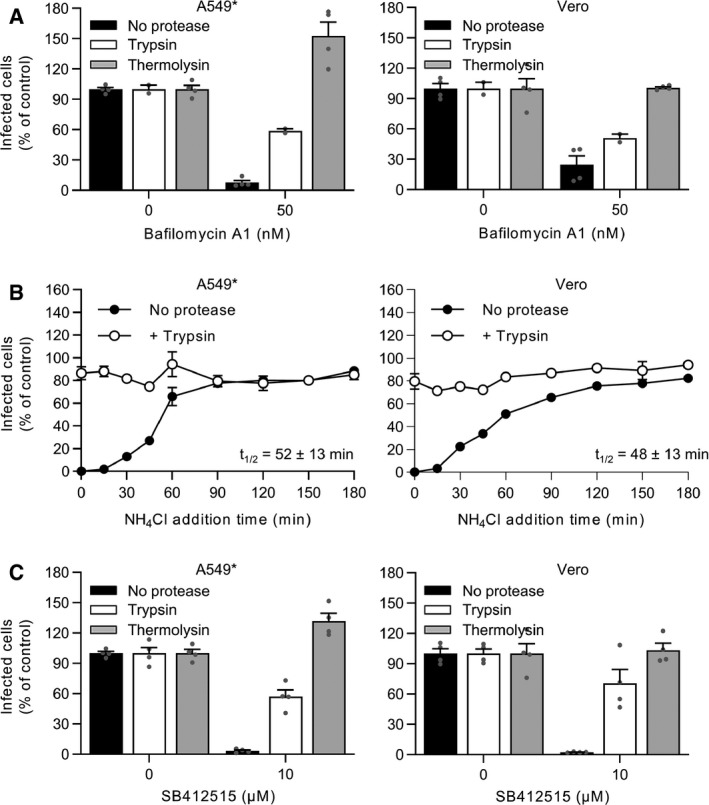
Trypsin‐ or thermolysin‐activated SARS‐CoV‐2 was allowed to infect A549* and Vero cells at MOIs of 0.2 and 0.3, respectively, in the continuous presence of bafilomycin A1. Infection was quantified by flow cytometry, and data were normalized to that from control samples not exposed to the inhibitor. n = 2–4 biological replicates.
Binding of trypsin‐activated SARS‐CoV‐2 to A549* and Vero cells (MOI ˜0.2 and 0.3, respectively) was synchronized on ice for 90 min. Subsequently, the cells were rapidly shifted to 37°C to allow penetration. NH4Cl (50 mM) was added at the indicated time to neutralize endosomal pH and block the acid‐dependent step of SARS‐CoV‐2 infectious penetration. Infected cells were analyzed by flow cytometry, and data were normalized to samples where NH4Cl had been omitted. n = 2.
SARS‐CoV‐2 was first treated with trypsin or thermolysin and then allowed to infect A549* and Vero cells (MOIs ˜0.2 and 0.3) in the continuous presence of SB412515 (cathepsin L inhibitor). Infected cells were quantified by flow cytometry as described in Fig 1D, and data were normalized to samples where SB412515 had been omitted. n = 4 biological replicates.
References
-
- Bertram S, Dijkman R, Habjan M, Heurich A, Gierer S, Glowacka I, Welsch K, Winkler M, Schneider H, Hofmann‐Winkler Het al (2013) TMPRSS2 activates the human coronavirus 229E for cathepsin‐independent host cell entry and is expressed in viral target cells in the respiratory epithelium. J Virol 87: 6150–6160 - PMC - PubMed
Publication types
MeSH terms
Substances
Grants and funding
- LO-2338/1-1/Deutsche Forschungsgemeinschaft (DFG)
- 416072091/Deutsche Forschungsgemeinschaft (DFG)
- TRR179 (272983813)/Deutsche Forschungsgemeinschaft (DFG)
- TRR186 (278001972)/Deutsche Forschungsgemeinschaft (DFG)
- SFB1129 (240245660)/Deutsche Forschungsgemeinschaft (DFG)
- Heisenberg Program (415089553)/Deutsche Forschungsgemeinschaft (DFG)
- LO-2338/3-1/Deutsche Forschungsgemeinschaft (DFG)
- INRAE
- IDEX-Impulsion 2020/University of Lyon
- A014/Fondation pour l Universite de Lyon
- 57440921/Deutscher Akademischer Austauschdienst (DAAD)
- CellNetworks
- 33.7533.-6-21/5/1/State Baden Wuerttemberg
- 01KI20198A/Bundesministerium Bildung und Forschung (BMBF)
LinkOut - more resources
Full Text Sources
Other Literature Sources
Medical
Molecular Biology Databases
Miscellaneous
