A Study to Assess the Dosimetric Impact of the Anatomical Changes Occurring in the Parotid Glands and Tumour Volume during Intensity Modulated Radiotherapy using Simultaneous Integrated Boost (IMRT-SIB) in Head and Neck Squamous Cell Cancers
- PMID: 34159749
- PMCID: PMC8335829
- DOI: 10.1002/cam4.4079
A Study to Assess the Dosimetric Impact of the Anatomical Changes Occurring in the Parotid Glands and Tumour Volume during Intensity Modulated Radiotherapy using Simultaneous Integrated Boost (IMRT-SIB) in Head and Neck Squamous Cell Cancers
Abstract
Background: Anatomical variations in head and neck cancer during IMRT leads to volume shrinkage, results in dosimetric variations in tumour and normal tissue including parotid glands, with a risk of radiation toxicities.
Methods: 30 patients with a stage II-IV head and neck squamous cell carcinoma (HNSCC) were treated with definitive IMRT-SIB and concomitant chemotherapy. Volumetric and dosimetric variations were evaluated during the period of IMRT by recalculating and obtaining dose-volume histograms of re-contoured target volumes and parotid glands on repeat CT scans taken multiple times during treatment (CT1, CT2, CT3 and CT4).
Results: Result showed significant (p < 0.001) mean decrease in both primary and nodal tumors volume with time whereas increase (p < 0.01 or p < 0.001) in respective V100 (%) and D2% (Gy). The mean parotid gland dose increased (p < 0.01 or p < 0.001) with time, whereas parotid gland volume and distance between plan isocenter and centre of mass of parotid glands decreased (p < 0.05 or p < 0.001) with time. Patient's mean weight and neck circumference both decrease (p < 0.001) with time whereas ECOG score increase (p < 0.001) with time. The mucosal toxicity increased significantly (p < 0.001) with time. The change in both weight and neck circumference showed significant (p < 0.001) and direct (positive correlation) association with change in parotid gland volume.
Conclusion: If the PTV and normal anatomy are changing with time, adaptive IMRT would be beneficial radiation dose delivery where possible.
Keywords: adaptive radiation; dosimetric variation; head neck cancer; imrt; parotid gland; volumetric variation.
© 2021 The Authors. Cancer Medicine published by John Wiley & Sons Ltd.
Conflict of interest statement
There is none.
Figures

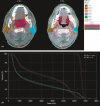
 ) and CT4 (
 )
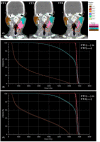
)
 ) c. Comparative DVH of CT1 (‐‐‐‐‐‐‐) and CT4 (
 )
)


References
-
- Barker JL, Garden AS, Ang KK, et al. Quantification of volumetric and geometric changes occurring during fractionated radiotherapy for head‐and‐neck cancer using an integrated CT/linear accelerator system. Int J Radiat Oncol Biol Phys. 2004;59(4):960‐970. - PubMed
-
- Naveen BS, Narayanan GNS. The necessity of replanning during the intensity‐modulated radiotherapy (IMRT) for head and neck cancer, to ensure adequate coverage of target volume. Int J Med Res Rev. 2020;8(2):189‐200.
-
- Nishi T, et al. Volume and dosimetric changes and initial clinical experience of a two‐step adaptive intensity modulated radiation therapy (IMRT) scheme for head and neck cancer. Radiother Oncol. 2013;106:85‐89. - PubMed
-
- Clifford Chao KS. Protection of salivary function by intensity‐modulated radiation therapy in patients with head and neck cancer. Seminars Radiation Oncol. 2002;12(1):20‐25. - PubMed
MeSH terms
LinkOut - more resources
Full Text Sources
Medical

