. 2021 Jun 23:10:e70339.
doi: 10.7554/eLife.70339.

Loss of heterozygosity results in rapid but variable genome homogenization across yeast genetic backgrounds

Affiliations

Loss of heterozygosity results in rapid but variable genome homogenization across yeast genetic backgrounds

Abhishek Dutta et al. Elife. .

Abstract

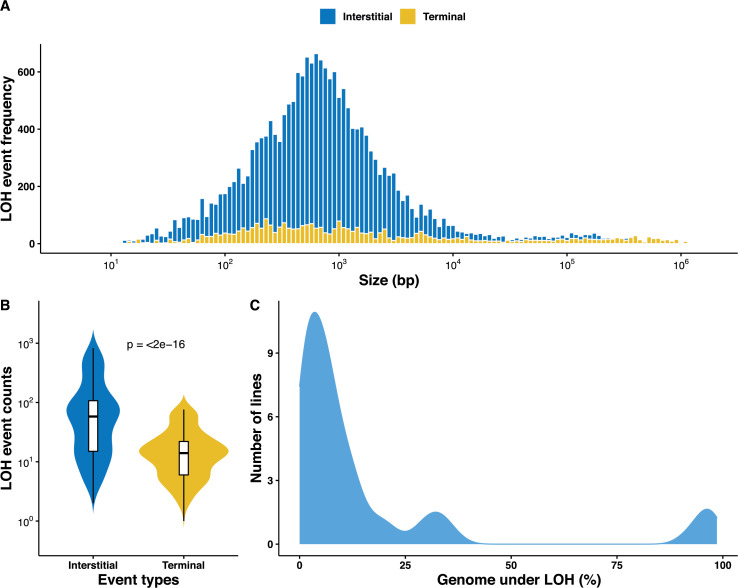
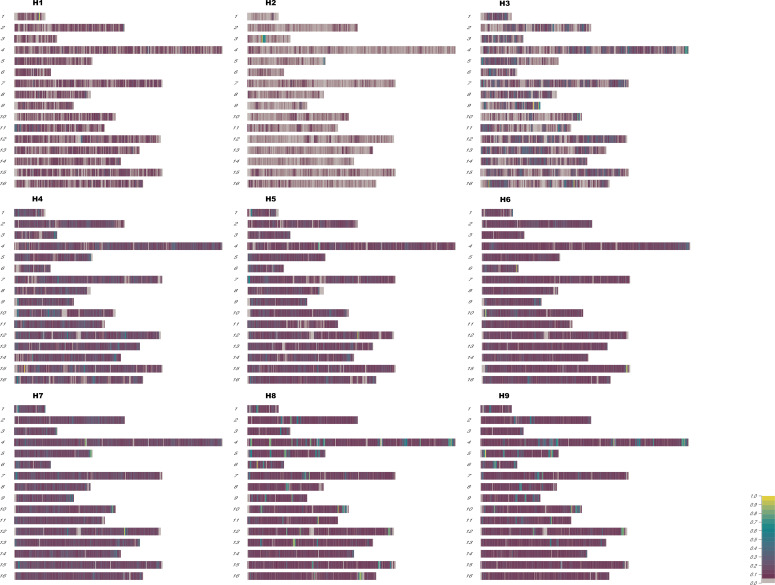
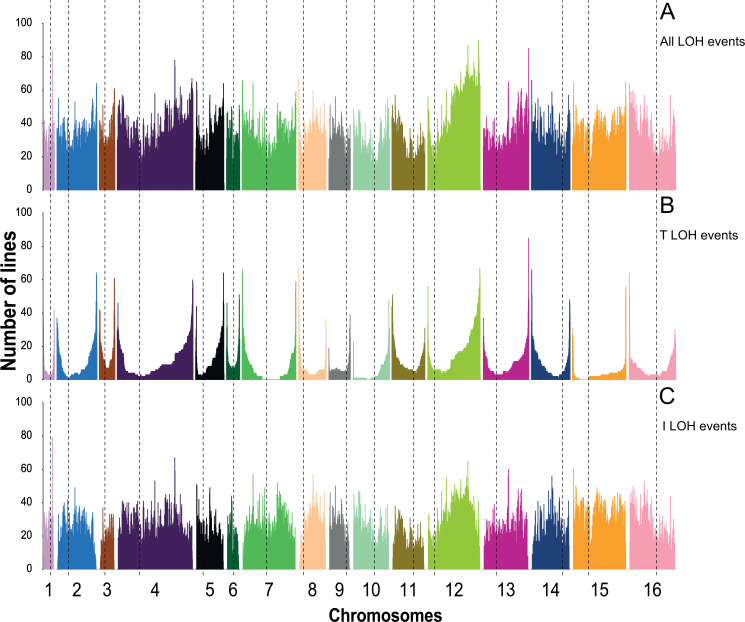
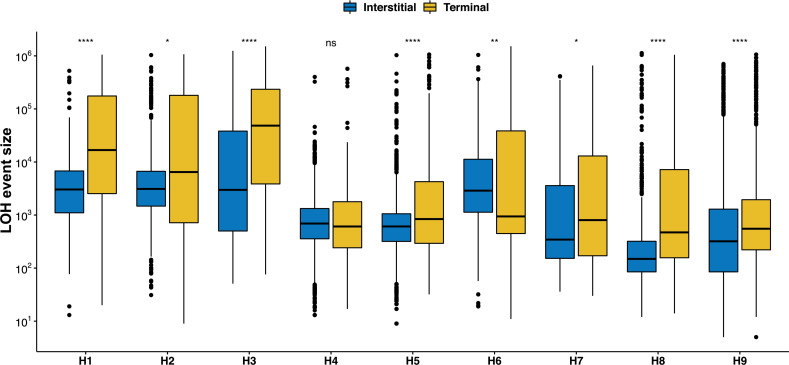
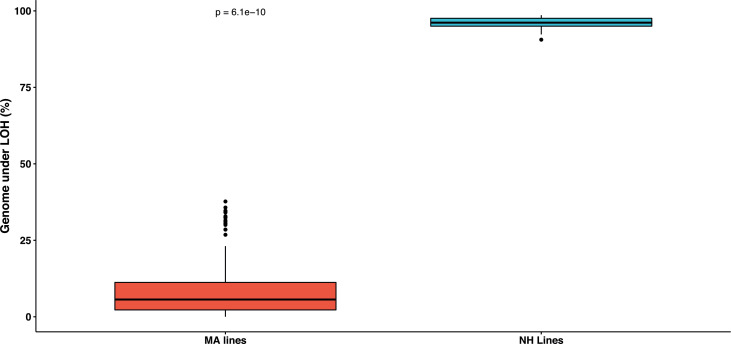
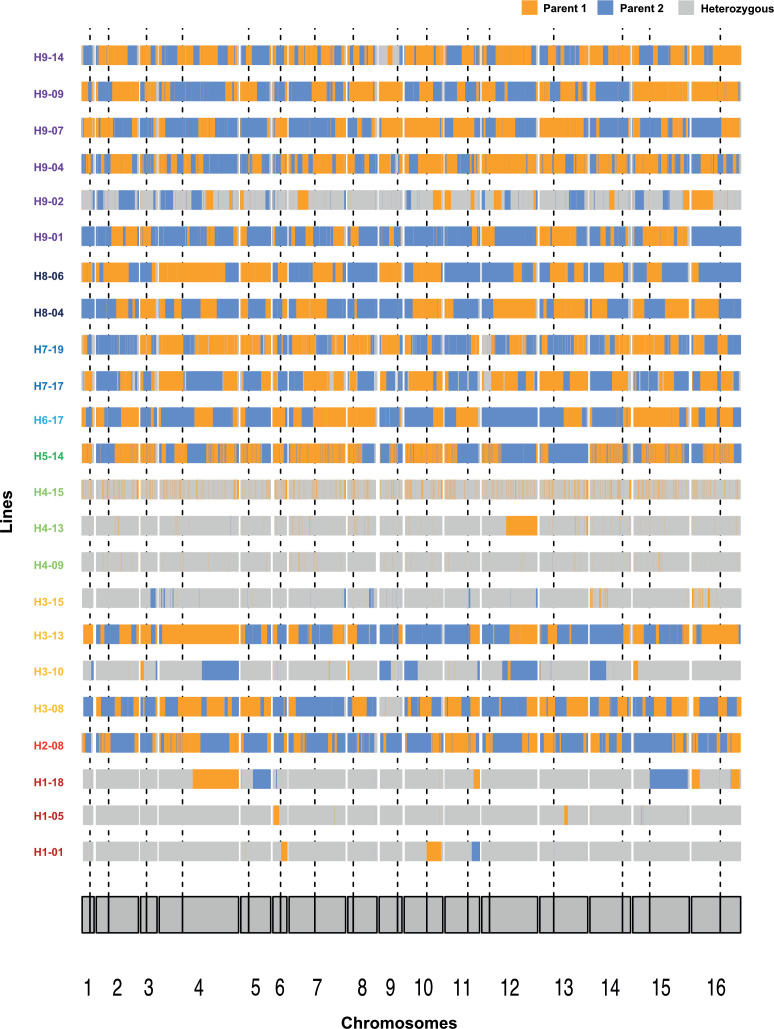
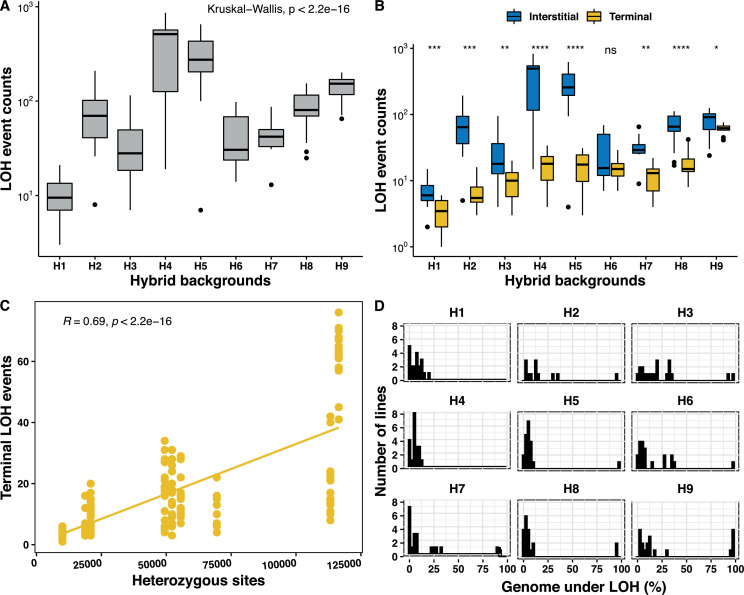
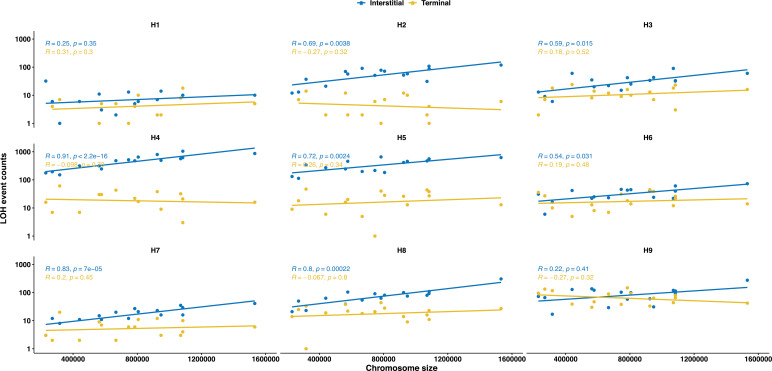
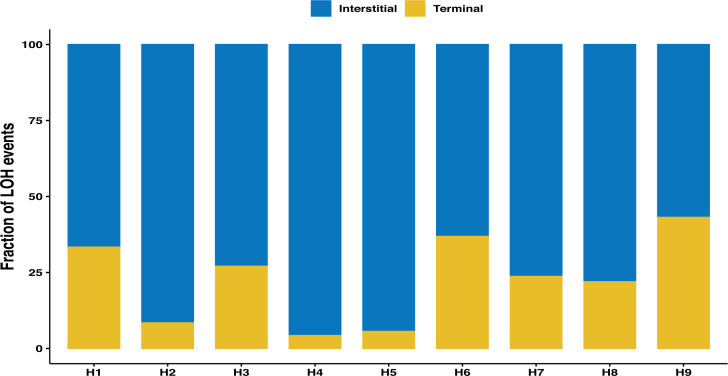
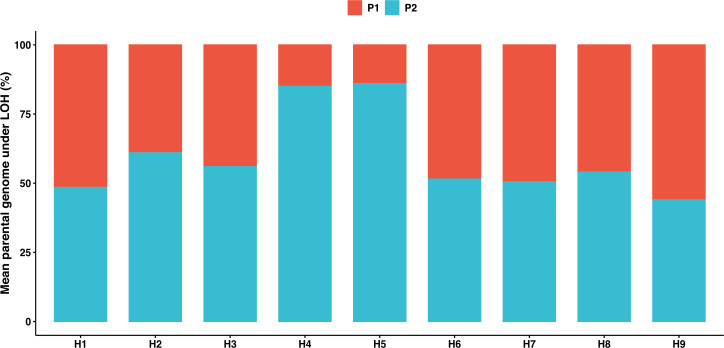
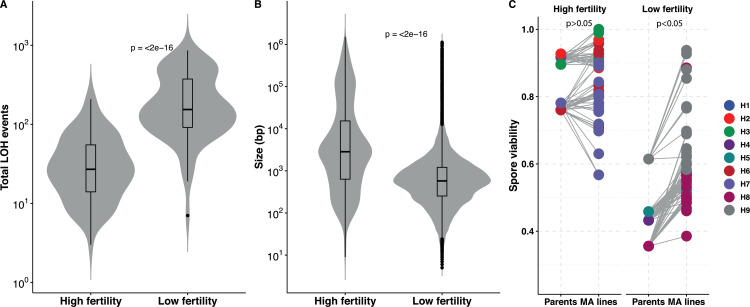
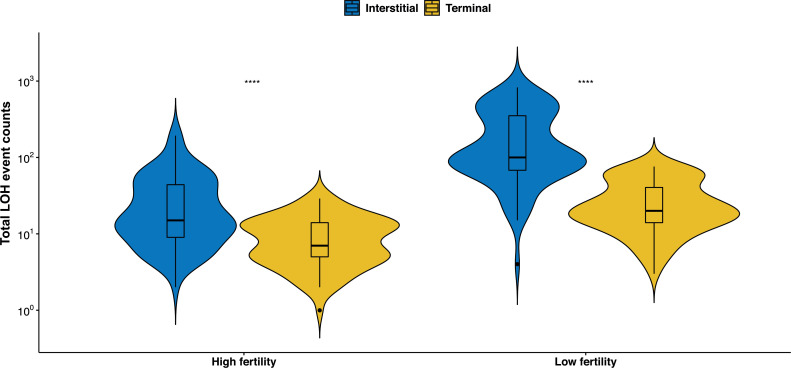
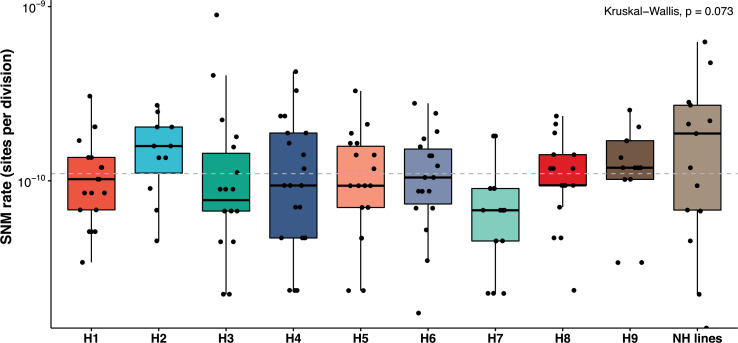
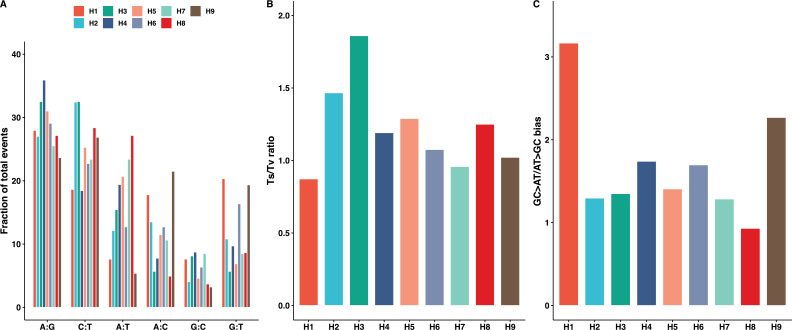
The dynamics and diversity of the appearance of genetic variants play an essential role in the evolution of the genome and the shaping of biodiversity. Recent population-wide genome sequencing surveys have highlighted the importance of loss of heterozygosity (LOH) events and have shown that they are a neglected part of the genetic diversity landscape. To assess the extent, variability, and spectrum, we explored the accumulation of LOH events in 169 heterozygous diploid Saccharomyces cerevisiae mutation accumulation lines across nine genetic backgrounds. In total, we detected a large set of 22,828 LOH events across distinct genetic backgrounds with a heterozygous level ranging from 0.1% to 1%. LOH events are very frequent with a rate consistently much higher than the mutation rate, showing their importance for genome evolution. We observed that the interstitial LOH (I-LOH) events, resulting in internal short LOH tracts, were much frequent (n = 19,660) than the terminal LOH (T-LOH) events, that is, tracts extending to the end of the chromosome (n = 3168). However, the spectrum, the rate, and the fraction of the genome under LOH vary across genetic backgrounds. Interestingly, we observed that the more the ancestors were heterozygous, the more they accumulated T-LOH events. In addition, frequent short I-LOH tracts are a signature of the lines derived from hybrids with low spore fertility. Finally, we found lines showing almost complete homozygotization during vegetative progression. Overall, our results highlight that the variable dynamics of the LOH accumulation across distinct genetic backgrounds might lead to rapid differential genome evolution during vegetative growth.

Keywords: S. cerevisiae; genetic diverstity; genetics; genomics; loss of heterozygosity; mitotic recombination; mutation accumulation; spore fertility.


Conflict of interest statement

AD, FD, JS No competing interests declared

Figures

Figure 1.
Figure 1.. Overall distribution of loss of heterozygosity (LOH) in the 169 mutation accumulation (MA) lines.
(A) LOH event tract size distribution across all 169 MA lines, the average tract sizes of the interstitial LOH (I-LOH) events (7.4 kb) and terminal LOH (T-LOH) events (55.3 kb), respectively. The global average LOH event size was 14.1 kb. (B) Violin plot of the LOH event counts in the MA lines population, I-LOH events were found to be significantly greater than T-LOH events (Wilcoxon test, p<2×10⁻¹⁶). (C) Distribution of MA lines based on the proportion of genome under LOH (%), dashed line indicates average proportion of genome under LOH across the 169 MA lines, 15.9% (±1.86).
Figure 1—figure supplement 1.
Figure 1—figure supplement 1.. Distribution of the heterozygous single nucleotide polymorphism (SNP) densities as a fraction of total heterozygous SNPs in 5 kb windows across the ancestral diploids as described in Table 1.
Figure 1—figure supplement 2.
Figure 1—figure supplement 2.. Chromosome-wide distribution of loss of heterozygosity (LOH) events across all mutation accumulation (MA) lines.
(A) All LOH events, (B) terminal LOH (T-LOH), events, and (C) interstitial LOH (I-LOH) events.
Figure 1—figure supplement 3.
Figure 1—figure supplement 3.. A terminal LOH (T-LOH) events are significantly larger than interstitial LOH (I-LOH) in the 169 mutation accumulation (MA) lines all backgrounds except H4 (Wilcoxon test, *p < 0.05; **p < 0.01; ***p<0.001; ****p < 0.0001; ns – not significant).
Figure 1—figure supplement 4.
Figure 1—figure supplement 4.. Boxplot depicting the fraction genome under loss of heterozygosity (LOH) in the nearly homozygous lines is significantly greater than the rest of the mutation accumulation (MA) lines (Wilcoxon test, p=6.1×10⁻¹⁰).
Figure 1—figure supplement 5.
Figure 1—figure supplement 5.. Chromosome-wide loss of heterozygosity (LOH) plots across representative lines from H1, H3, H4, and H9.
Orange and blue colors represent single nucleotide polymorphisms (SNPs) fixed toward either of the parents as described in Table 1 and Supplementary file 1. All the 14 nearly homozygous (NH) lines have been depicted. Dotted vertical lines represent position of the centromere.
Figure 2.
Figure 2.. Genetic background-dependent variation in the loss of heterozygosity (LOH) repertoire.
(A) The frequency of total LOH events across the nine genetic backgrounds are highly variable (Kruskal-Wallis test, p<2×10⁻¹⁶). (B) Variability in interstitial and terminal LOH events counts across all backgrounds H1–H9 (Kruskal-Wallis test, p<10−16), interstitial events were always in excess, except for in H6 (Wilcoxon test, *p < 0.05; **p < 0.01; ***p<0.001; ****p < 0.0001; ns – not significant). (C) Frequency of terminal LOH events increases with increasing heterozygosity in the nine genetic backgrounds (Pearson’s correlation; r = 0.69, p<2×10⁻¹⁶), interstitial and total events do not bear any correlation with the background heterozygosity (Pearson’s correlation; p>0.05). (D) Proportion of genome under LOH is significantly variable across the nine backgrounds (H1–H9) (Kruskal-Wallis test, p<2×10⁻¹⁶).
Figure 2—figure supplement 1.
Figure 2—figure supplement 1.. The frequency of interstitial LOH (I-LOH) events increases with increasing chromosome size for all backgrounds except for H1 and H9; no such correlation was observed for terminal LOH (T-LOH) events.
Figure 2—figure supplement 2.
Figure 2—figure supplement 2.. Overall fraction of interstitial and terminal loss of heterozygosity (LOH) tracts across the nine genetic backgrounds.
Figure 2—figure supplement 3.
Figure 2—figure supplement 3.. Fraction of the genome fixed toward either of the parental genomes across the nine genetic backgrounds.
Biased fixation was only observed in H4 and H5 backgrounds (binomial test, p<0.05).
Figure 3.
Figure 3.. Loss of heterozygosity (LOH) accumulation is associated with spore fertility.
(A) Total LOH events accumulated in mutation accumulation (MA) lines derived from ancestral diploids with high spore fertility, that is, meiotic spore viability greater than or equal to 75% and the fraction of four-spore viable tetrads greater than 50% (H1, H2, H3, H6, H7) is significantly lower than in MA lines derived from ancestral diploids with low spore fertility, that is, meiotic spore viability lesser than 75% and the fraction of four-spore viable tetrads less than 50% (H4, H5, H8, H9) (Wilcoxon test, p<2×10⁻¹⁶). (B) The size (in bp) of the LOH events accumulated in MA lines derived from ancestral diploids with high spore fertility is significantly larger than in MA lines derived from ancestral diploids with low spore fertility (Wilcoxon test, p<2×10⁻¹⁶). The average LOH event size in the high spore fertility and low spore fertility MA lines are 45.8 and 7.4 kb, respectively. (C) Spore viabilities in both the high and low spore fertility groups compared respective to their ancestral diploids. There is a significant improvement in the spore viabilities of the MA lines derived from the low spore fertility ancestors (Mann-Whitney U test, p=0.04), whereas the viabilities do not change in the MA lines derived from the high spore fertility ancestral diploids (Mann-Whitney U test, p=0.34). The spore viabilities of the individual MA lines and the ancestral diploids detailed in Supplementary file 4.
Figure 3—figure supplement 1.
Figure 3—figure supplement 1.. The total number of interstitial LOH (I-LOH) and terminal LOH (T-LOH) events are significantly greater in the mutation accumulation (MA) lines derived from ancestral diploids with low fertility (Wilcoxon test, *p < 0.05; **p < 0.01; ***p<0.001; ****p < 0.0001; ns – not significant).
Figure 4.
Figure 4.. Mutation rates are constant across the backgrounds and within the nearly homozygous (NH) lines (range 0.67–1.9 × 10⁻¹⁰ mutations/site/division; Kruskal-Wallis test, p>0.05).
The overall, mean single nucleotide mutation (SNM) rate in the 169 MA lines 1.1 × 10⁻¹⁰ per site per division is not different from previous estimates in various diploid Saccharomyces cerevisiae strains. NH lines represent the SNM rates in the NH lines. SNMs have been detailed in Supplementary files 5 and 6.
Figure 4—figure supplement 1.
Figure 4—figure supplement 1.. SNM spectrum across the nine hybrid backgrounds.
(A) The spectrum of single nucleotide mutations (SNMs) in the mutation accumulation (MA) lines is variable across all genetic backgrounds (Chi-square test, p<0.05; Supplementary file 5–6). (B) The transition to transversion ratio is similar across all genetic backgrounds, significantly increased only in H3 (Chi-square test, p<0.05; Supplementary file 5–6). (C) The GC > AT/AT > GC mutational bias was similar in all genetic backgrounds, significantly increased only in H1 (Chi-square test, p<0.05; Supplementary file 5–6).
Figure 4—figure supplement 2.
Figure 4—figure supplement 2.. The frequency of mutations was significantly impacted at C/G sites than A/T sites by the neighboring nucleotides (Chi-square test, p<0.05; Supplementary file 5–6).
Horizontal red lines indicate mean events.
Figure 4—figure supplement 3.
Figure 4—figure supplement 3.. The frequency of aneuploid chromosomes across the nine genetic backgrounds (H1–H9).
Two backgrounds carried ancestral trisomies, H3 (+1 chrIX) and H9 (+1 chrIX; +1 chrXVI).
Author response image 1.

Similar articles

Cited by

References

    1. Andersen MP, Nelson ZW, Hetrick ED, Gottschling DE. A genetic screen for increased loss of heterozygosity in Saccharomyces cerevisiae. Genetics. 2008;179:1179–1195. doi: 10.1534/genetics.108.089250. - DOI - PMC - PubMed
    1. Argueso JL, Wanat J, Gemici Z, Alani E. Competing crossover pathways act during meiosis in Saccharomyces cerevisiae. Genetics. 2004;168:1805–1816. doi: 10.1534/genetics.104.032912. - DOI - PMC - PubMed
    1. Beekman CN, Ene IV. Short-term evolution strategies for host adaptation and drug escape in human fungal pathogens. PLOS Pathogens. 2020;16:e1008519. doi: 10.1371/journal.ppat.1008519. - DOI - PMC - PubMed
    1. Bouchonville K, Forche A, Tang KE, Selmecki A, Berman J. Aneuploid chromosomes are highly unstable during DNA transformation of Candida albicans. Eukaryotic Cell. 2009;8:1554–1566. doi: 10.1128/EC.00209-09. - DOI - PMC - PubMed
    1. Brion C, Legrand S, Peter J, Caradec C, Pflieger D, Hou J, Friedrich A, Llorente B, Schacherer J. Variation of the meiotic recombination landscape and properties over a broad evolutionary distance in yeasts. PLOS Genetics. 2017;13:e1006917. doi: 10.1371/journal.pgen.1006917. - DOI - PMC - PubMed

Publication types

MeSH terms

Associated data