. 2021 Sep 3;9(1):e0010321.
doi: 10.1128/Spectrum.00103-21. Epub 2021 Jun 23.

Field-Realistic Tylosin Exposure Impacts Honey Bee Microbiota and Pathogen Susceptibility, Which Is Ameliorated by Native Gut Probiotics

Affiliations

Field-Realistic Tylosin Exposure Impacts Honey Bee Microbiota and Pathogen Susceptibility, Which Is Ameliorated by Native Gut Probiotics

J Elijah Powell et al. Microbiol Spectr. .

Abstract

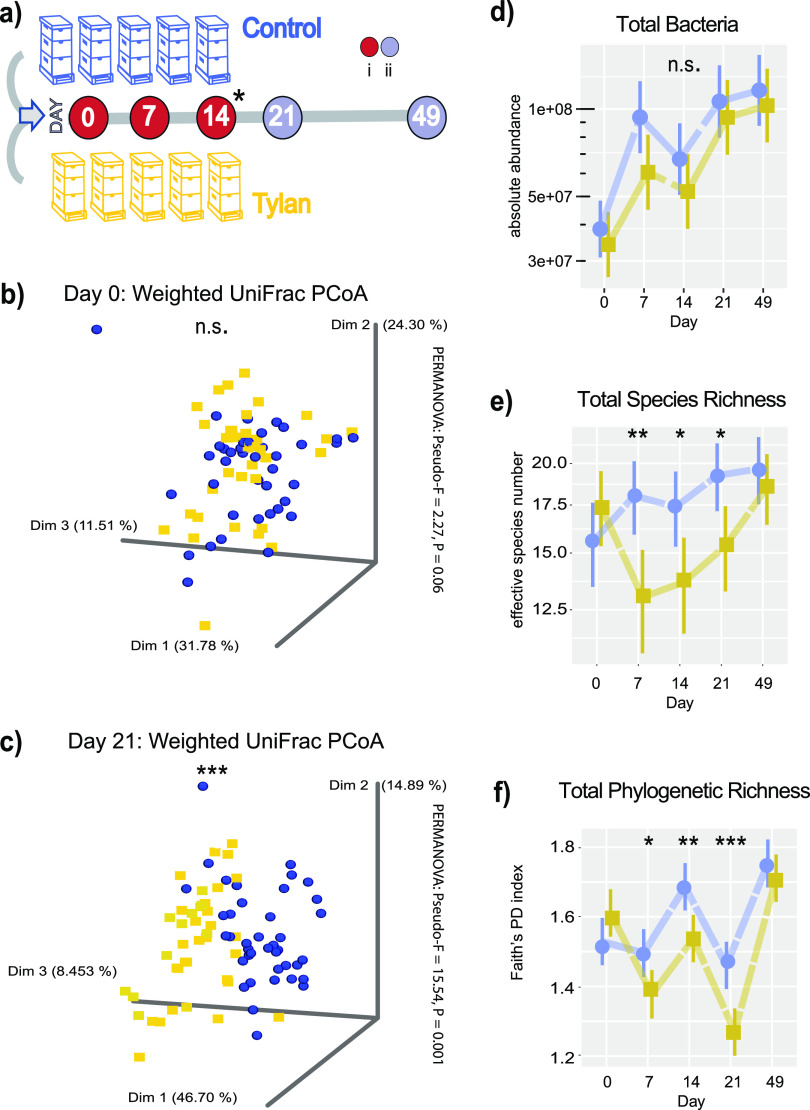
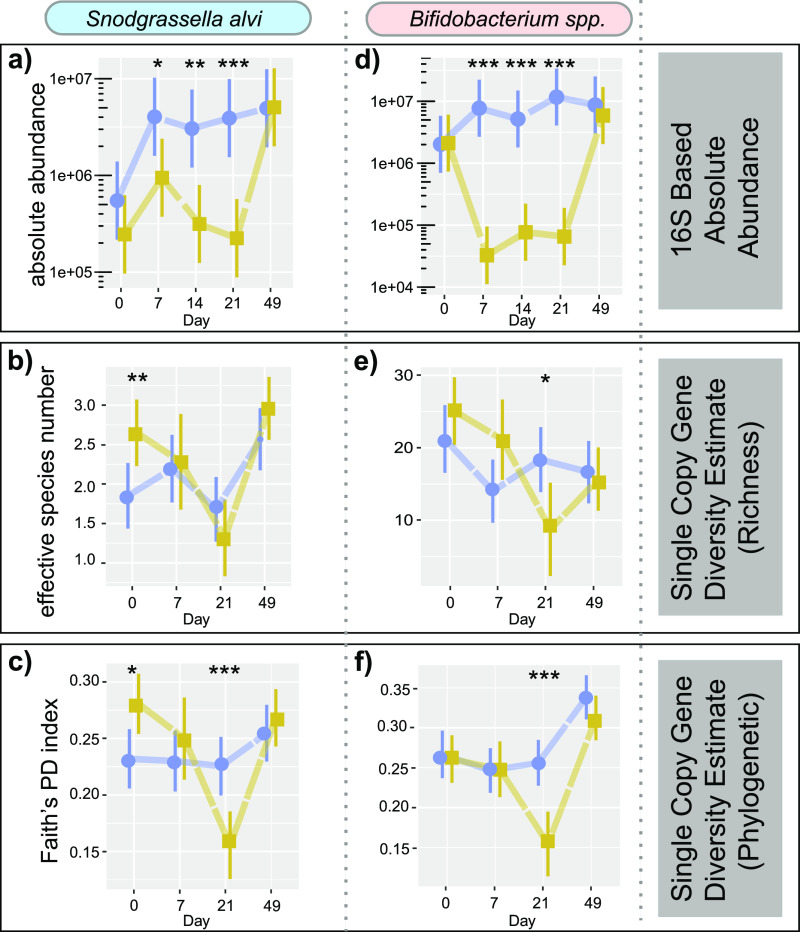
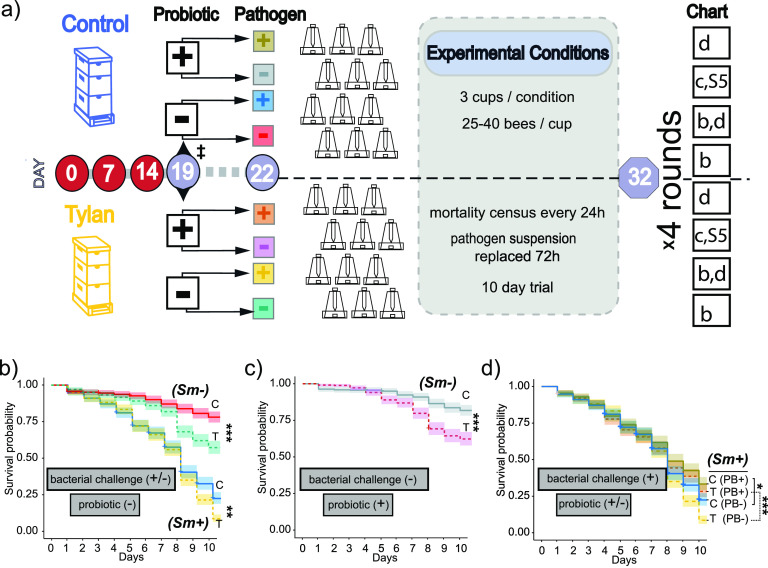
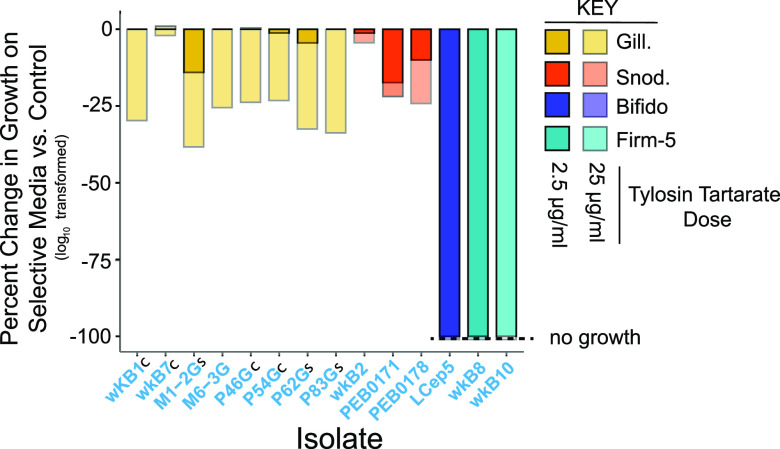
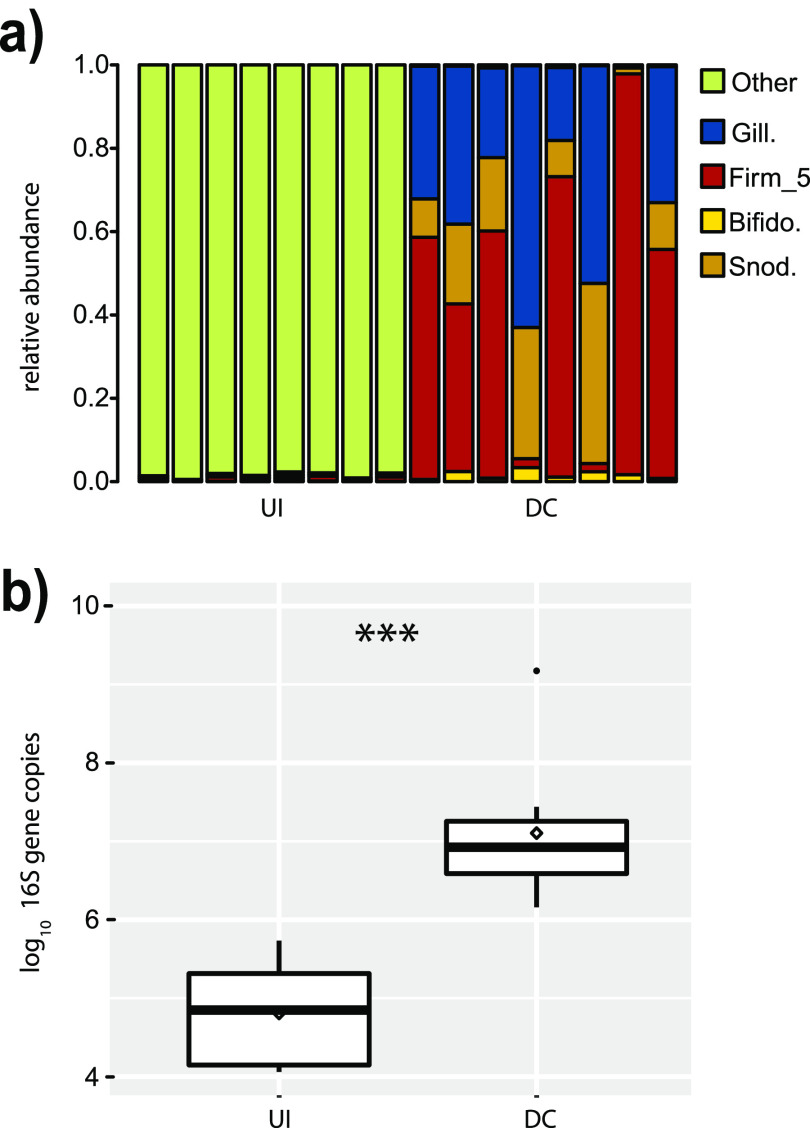
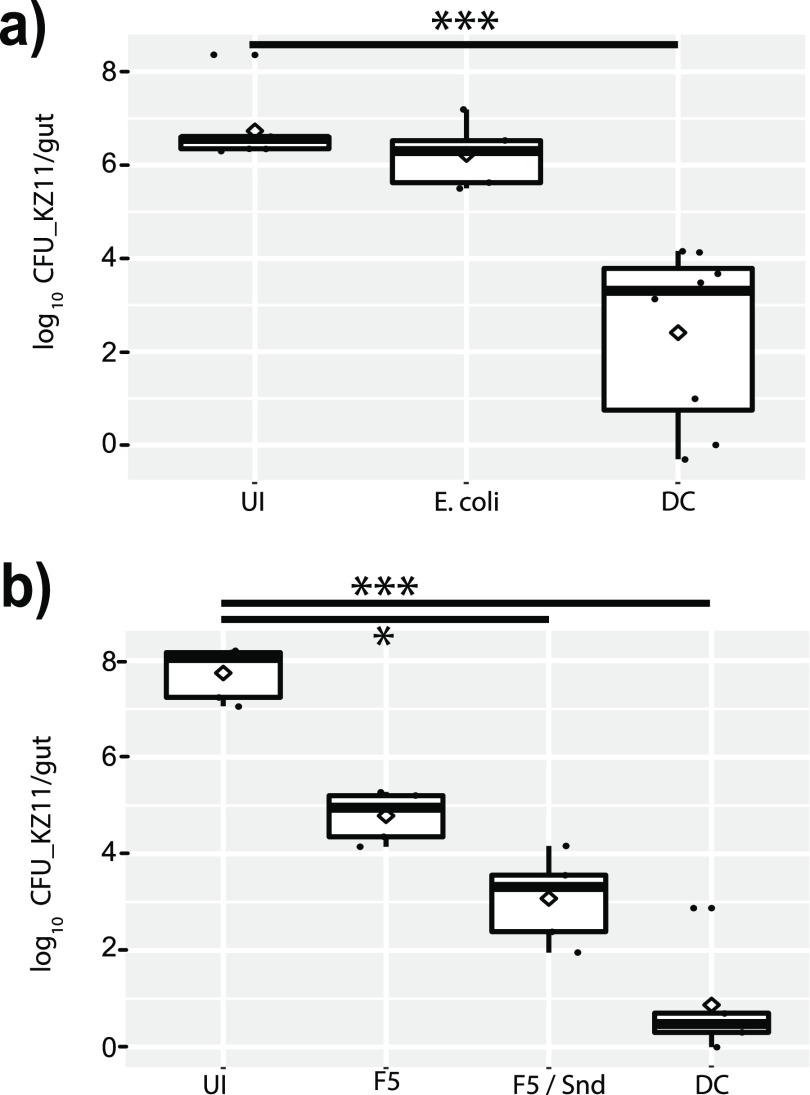
Antibiotics have been applied to honey bee (Apis mellifera) hives for decades to treat Paenibacillus larvae, which causes American foulbrood disease and kills honey bee larvae. One of the few antibiotics approved in apiculture is tylosin tartrate. This study examined how a realistic hive treatment regimen of tylosin affected the gut microbiota of bees and susceptibility to a bacterial pathogen. Tylosin treatment reduced bacterial species richness and phylogenetic diversity and reduced the absolute abundances and strain diversity of the beneficial core gut bacteria Snodgrassella alvi and Bifidobacterium spp. Bees from hives treated with tylosin died more quickly after being fed a bacterial pathogen (Serratia marcescens) in the laboratory. We then tested whether a probiotic cocktail of core bee gut species could bolster pathogen resistance. Probiotic exposure increased survival of bees from both control and tylosin-treated hives. Finally, we measured tylosin tolerance of core bee gut bacteria by plating cultured isolates on media with different tylosin concentrations. We observed highly variable responses, including large differences among strains of both S. alvi and Gilliamella spp. Thus, probiotic treatments using cultured bee gut bacteria may ameliorate harmful perturbations of the gut microbiota caused by antibiotics or other factors. IMPORTANCE The antibiotic tylosin tartrate is used to treat honey bee hives to control Paenibacillus larvae, the bacterium that causes American foulbrood. We found that bees from tylosin-treated hives had gut microbiomes with depleted overall diversity as well as reduced absolute abundances and strain diversity of the beneficial bee gut bacteria Snodgrassella alvi and Bifidobacterium spp. Furthermore, bees from treated hives suffered higher mortality when challenged with an opportunistic pathogen. Bees receiving a probiotic treatment, consisting of a cocktail of cultured isolates of native bee gut bacteria, had increased survival following pathogen challenge. Thus, probiotic treatment with native gut bacteria may ameliorate negative effects of antibiotic exposure.

Keywords: dysbiosis; honey bee; microbiota; probiotics; tylosin.


Figures

FIG 1
FIG 1
16S rRNA gene metabarcoding analysis of the effect of tylosin tartrate treatment of hives on the microbiome of honey bee workers. (a) Experimental design scheme: 5 hives were given either powdered sugar (control) or tylosin with sugar. All circles indicate days that bees were sampled: (i) red circles are days treatments were also administered, (ii) gray circles indicate days sampled posttreatment, * indicates that only 16S rRNA gene metabarcoding was analyzed for day 14 and not taxon-specific gene targets. (b and c) Principal-coordinate analysis of weighted UniFrac dissimilarity of control and tylosin samples at day 0 and day 3 sampling. Significant clustering by group was analyzed by PERMANOVA. (d) Plot of absolute abundance of bacteria. Total 16S rRNA gene copies were estimated by qPCR and corrected for rRNA operon number per genome. (e) Plot of species richness as assessed by effective species number. (f) Total phylogenetic richness as measured by Faith’s phylogenetic diversity (PD) index. (d to f) Bars on plots represent 95% confidence intervals. Generalized linear mixed-effects models assuming Poisson regression (d) and default distribution (e to f) were used to compare changes in bacterial abundances between control and treatment bees per sampling time. Mixed models were fitted using the package lme4 and followed by post hoc tests using package emmeans. *, P  ≤  0.05; **, P  ≤  0.01; and ***, P  ≤  0.001. Blue, control; yellow, tylosin treatment.
FIG 2
FIG 2
Estimates of 16S rRNA gene-based absolute abundance and single-copy gene target-based alpha diversity (effective species number and phylogenetic diversity) for Snodgrassella alvi (a to c) and Bifidobacterium spp. (d to f). Bars on plots represent 95% confidence intervals. Generalized linear mixed-effects models assuming Poisson regression (a and d) and default distribution (b, c, e, and f) were used to compare changes in bacterial abundances between control and treatment bees per sampling time. Mixed models were fitted using the package lme4 and followed by post hoc tests using package emmeans. *, P  ≤  0.05; **, P  ≤  0.01; and ***, P  ≤  0.001. Blue, control; yellow, tylosin treatment.
FIG 3
FIG 3
Bacterial pathogen challenge following hive tylosin treatment and/or probiotic treatment. (a) Matched hives were treated with sugar (control) or sugar with antibiotic (tylosin) on days 0, 7, and 14. One hive per condition (control or tylosin) per round (4 rounds total) was used. Workers were removed to the lab on day 19 (‡) and split into two groups per hive/treatment condition. One of these groups was fed a probiotic mixture of cultured bee gut specific microbiota (PB+) and the other was fed buffer only (PB−). Bees were allowed 3 days before all groups were split again, and within each split, one half were assigned to receive a pathogenic challenge (Sm+) in sugar syrup while the other split received only sugar syrup (Sm−). All split groups were placed in cup cages of 25 to 40 individuals (3 cups per condition). Mortality was assessed over the next 10 days with the pathogen suspension being replaced every 72 h. (b) Kaplan-Meier curve of survival probability of combined control and tylosin trials that were not provided probiotic (PB−) with and without pathogenic challenge (Sm+/Sm−). Control groups had significantly higher survival probabilities than tylosin-treated groups. Unchallenged (Sm−) groups survived better than challenged groups (Sm+). (c) Unchallenged (Sm−) control bees provided probiotic (PB+) survived better than unchallenged tylosin-treated bees given probiotic (PB+), though these results are similar to those for bees not given probiotic (see Fig. S5 in the supplemental material). (d) Following pathogen challenge (Sm+), probiotics improved survival probabilities; that is, control PB+ survived better than control PB−, and tylosin-treated PB+ did much better than tylosin-treated PB− (for each combined survival data plot, Cox proportional hazards mixed effects model [by trial]). *, P < 0.05; **, P < 0.01; ***, P < 0.001.
FIG 4
FIG 4
Impact of tylosin tartrate on growth of bee gut microbiota isolates. Suspensions of bacterial isolates were serially diluted and spotted onto triplicate plates of either CBA alone or CBA with tylosin tartrate (2.5 or 25 μg/ml). After incubation, colonies were counted and viable cell counts calculated. Viable CFU counts were then log10 transformed, and the percent change in viability from the control to selective platings was calculated. Bifidobacterium and Firm-5 (Lactobacillus nr. melliventris) did not grow at either tylosin tartrate concentration. Gilliamella isolates marked with a letter have been identified to the species level (c, G. apicola; s, G. apis).
FIG 5
FIG 5
Stability of defined community at 5 days postinoculation. Bees were allowed to emerge on a frame and either placed directly in a cup cage (uninoculated [UI]) or first fed 5 μl of a defined community inoculum before caging (defined community [DC]) at an of OD600 of 1. Bees were fed sterile sucrose and gamma irradiated pollen until day 5, when DNA was prepared from dissected guts. (a) Bar plot of uninoculated workers and those fed cocultured defined community as assessed by 16S V4 metabarcoding. Uninoculated bees were overwhelmingly (>90%) infected with Staphylococcus. (b) Log10 16S gene copies as assessed by qPCR. ***, P < 0.0001, Wilcoxon.
FIG 6
FIG 6
CFU of the bacterial pathogen Serratia marcescens KZ11 (kanamycin resistant) per plated bee gut. (a) Recovered colonies of S. marcescens strain KZ11 from either uninoculated bees (UI), those infected with E. coli, or the full defined community (DC). (b) Recovered colonies of S. marcescens KZ11 from either uninoculated bees (UI), those infected with Lactobacillus nr. melliventris wkB8 and 10 (F5), F5 and S. alvi (F5/Snd), or the full defined community (DC). *, P < 0.05; ***, P < 0.001, post hoc pairwise comparisons using Tukey and Kramer (Nemenyi) test with Tukey distribution approximation for independent samples following Kruskal-Wallis.

References

    1. Calderone NW. 2012. Insect pollinated crops, insect pollinators and US agriculture: trend analysis of aggregate data for the period 1992–2009. PLoS One 7:e37235. doi: 10.1371/journal.pone.0037235. - DOI - PMC - PubMed
    1. Raymann K, Moran NA. 2018. The role of the gut microbiome in health and disease of adult honey bee workers. Curr Opin Insect Sci 26:97–104. doi: 10.1016/j.cois.2018.02.012. - DOI - PMC - PubMed
    1. Zheng H, Powell JE, Steele MI, Dietrich C, Moran NA. 2017. Honeybee gut microbiota promotes host weight gain via bacterial metabolism and hormonal signaling. Proc Natl Acad Sci U S A 114:4775–4780. doi: 10.1073/pnas.1701819114. - DOI - PMC - PubMed
    1. Schwarz RS, Moran NA, Evans JD. 2016. Early gut colonizers shape parasite susceptibility and microbiota composition in honey bee workers. Proc Natl Acad Sci U S A 113:9345–9350. doi: 10.1073/pnas.1606631113. - DOI - PMC - PubMed
    1. Horak RD, Leonard SP, Moran NA. 2020. Symbionts shape host innate immunity in honeybees: symbionts shape honey bee immunity. Proc R Soc Lond B Biol Sci 287:20201184. - PMC - PubMed

Publication types