. 2021 Aug 11;87(17):e0069821.
doi: 10.1128/AEM.00698-21. Epub 2021 Aug 11.

Limitation of Microbial Processes at Saturation-Level Salinities in a Microbial Mat Covering a Coastal Salt Flat

Affiliations

Limitation of Microbial Processes at Saturation-Level Salinities in a Microbial Mat Covering a Coastal Salt Flat

Dimitri V Meier et al. Appl Environ Microbiol. .

Abstract

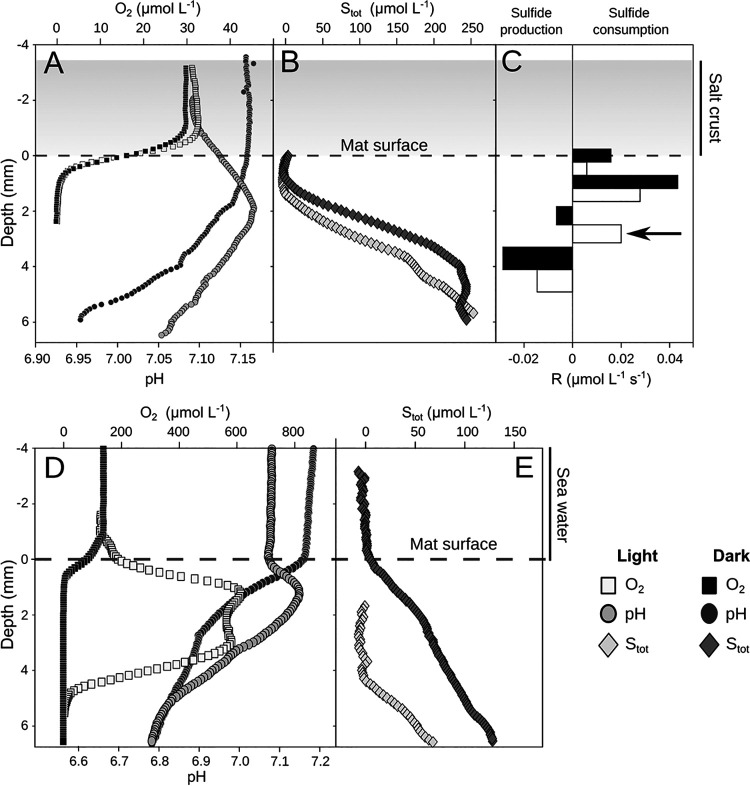
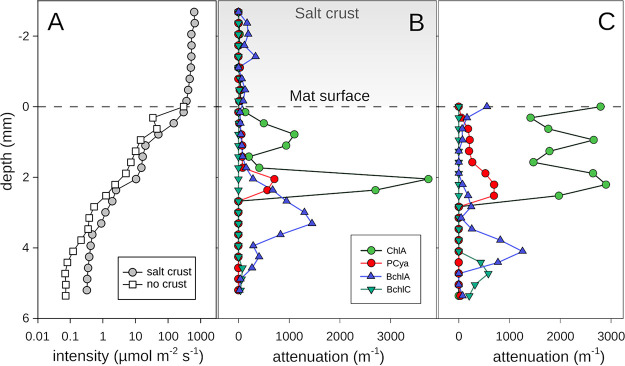
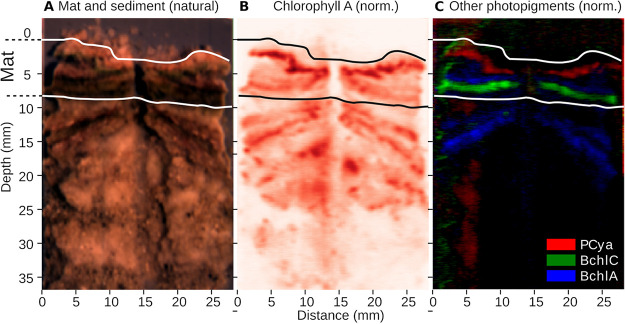
Hypersaline microbial mats are dense microbial ecosystems capable of performing complete element cycling and are considered analogs of early Earth and hypothetical extraterrestrial ecosystems. We studied the functionality and limits of key biogeochemical processes, such as photosynthesis, aerobic respiration, and sulfur cycling, in salt crust-covered microbial mats from a tidal flat at the coast of Oman. We measured light, oxygen, and sulfide microprofiles as well as sulfate reduction rates at salt saturation and in flood conditions and determined fine-scale stratification of pigments, biomass, and microbial taxa in the resident microbial community. The salt crust did not protect the mats against irradiation or evaporation. Although some oxygen production was measurable at salinities of ≤30% (wt/vol) in situ, at saturation-level salinity (40%), oxygenic photosynthesis was completely inhibited and only resumed 2 days after reducing the porewater salinity to 12%. Aerobic respiration and active sulfur cycling occurred at low rates under salt saturation and increased strongly upon salinity reduction. Apart from high relative abundances of Chloroflexi, photoheterotrophic Alphaproteobacteria, Bacteroidetes, and Archaea, the mat contained a distinct layer harboring filamentous Cyanobacteria, which is unusual for such high salinities. Our results show that the diverse microbial community inhabiting this salt flat mat ultimately depends on periodic salt dilution to be self-sustaining and is rather adapted to merely survive salt saturation than to thrive under the salt crust. IMPORTANCE Due to their abilities to survive intense radiation and low water availability, hypersaline microbial mats are often suggested to be analogs of potential extraterrestrial life. However, even the limitations imposed on microbial processes by saturation-level salinity found on Earth have rarely been studied in situ. While abundance and diversity of microbial life in salt-saturated environments are well documented, most of our knowledge on process limitations stems from culture-based studies, few in situ studies, and theoretical calculations. In particular, oxygenic photosynthesis has barely been explored beyond 5 M NaCl (28% wt/vol). By applying a variety of biogeochemical and molecular methods, we show that despite abundance of photoautotrophic microorganisms, oxygenic photosynthesis is inhibited in salt-crust-covered microbial mats at saturation salinities, while rates of other energy generation processes are decreased several-fold. Hence, the complete element cycling required for self-sustaining microbial communities only occurs at lower salt concentrations.

Keywords: biofilm biology; element cycles and biogeochemical processes; extremophiles/extremophily; microbial communities; microbiology of unexplored habitats; primary and secondary production; uncultured microbes.


Figures

FIG 1
FIG 1
Overview of the sabkha near Shannah, Oman, and the salt covered microbial mats in February 2018. (A) Image of the sampling site in the salt-crust-covered tidal flat. (B) A core including sediment, microbial mat, salt crust, and salt-saturated water. (C) Depth profile of porewater salinity. Squares indicate average values from three cores, and error bars indicate standard deviation. (D) Light intensity measured over the course of a day with a PAR sensor. (E) A piece of microbial mat cleaned from the salt and with layers partially scraped off. (F) Scheme of mat layers based on observations of color and texture. (G) Representative microsensor profiles of O2 concentrations in the mats measured during the sampling campaign (at 30% salinity). Profiles were measured in the field and in sampled cores with artificial and natural illumination. Sunrise and sunset times are indicated to consider differences in light intensity.
FIG 2
FIG 2
Spectral irradiance at different depths in the salt crusts and mats. Spectra in the mats with salt crust (A) and in mats after a simulated flood event (B). Note the low attenuation of light within the salt layers (blue traces at top) in panel A. The depth distribution of the irradiance spectra was normalized to the value at the mat surface. The depth layers are color-coded to approximately correspond to the determined mat layers (Fig. 1F) from orange at the mat surface to gray-green at the bottom of the mat. The spectral traces show the specific absorption of photopigments as well as the overall attenuation of irradiance by the sediment matrix.
FIG 3
FIG 3
Depth profiles of O2, pH, and total sulfur (Stot) of mats sampled in January 2019. Representative steady state profiles of O2 (squares) and pH (circles) in a salt covered mat (A), representative steady state profiles of Stot in a salt covered mat (B), local conversion rates of Stot in a salt covered mat (arrow indicates sulfide consumption due to anoxygenic photosynthesis) (C), representative steady state profiles of O2 (squares) and pH (circles) 3 days after inundation with seawater (D), and profiles of Stot 3 days after inundation with seawater (E). Note the order of magnitude difference in O2 concentrations between salt-covered (A) and flooded mats (D).
FIG 4
FIG 4
Sulfate reduction rates (SRR), determined by the 35S method, in mats covered by a salt crust (black circles) and in mats after a simulated flood event (white circles). The dashed line indicates an approximate delineation between mat and sediment. Considering the slightly varying mat thickness, the peak of sulfate reduction might lie in the lowest mat layer or in the sediment directly underneath the mat.
FIG 5
FIG 5
Photosynthetically active radiation intensity profile and photopigment abundances estimated from absorbance peaks. (A) Integrated photosynthetically active radiation intensity profile within the salt crust and the mat. Photopigment abundances estimated from the absorbance peaks in the attenuation spectra in the salt crust and mats underneath (B) and in mats after a simulated flood event (C). Pigment abbreviations in panels B and C are as follows: ChlA, chlorophyll a; Pcya, phycocyanin; BchlA, bacteriochlorophyll a; BchlC, bacteriochlorophyll c.
FIG 6
FIG 6
The distribution of photopigments across the cross-section of a core with the mat and underlying sediment. Photopigment distribution was assessed using hyperspectral imaging. The upper and lower limits of the mat are indicated by horizontal lines. Note that thickness varies between 5 and 8 mm. (A) Natural color-rendering derived from the rectified hyperspectral image. (B) Abundance estimates of chlorophyllic pigments based on spectral derivative analysis as a false-color map. Chlorophyllic pigments detected below the mat likely represent debris of phototrophic microorganisms, as supported by presence of chlorophyll degradation products (see Fig. S5 in the supplemental material), absence of phycocyanin (C), and phototrophic cells (see Fig. S6 in the supplemental material) in lower mat samples, as well as no light penetrating to these depths (Fig. 5A). (C) Group-specific pigments phycocyanin (Cyanobacteria) and bacteriochlorophylls a (purple bacteria, e.g., Rhodovibrio) and c (Chloroflexi) as composite color map.
FIG 7
FIG 7
Microbial community composition as determined by 16S rRNA gene amplicon sequencing. The relative amplicon sequence abundances were multiplied by total cell counts per gram sediment obtained via fluorescence microscopy (see Fig. S7 in the supplemental material) as follows: (Cell number/g sediment)taxon = (Relative sequence abundance)taxon × (Total cell numbers/g sediment). (A) The composition of the total microbial community shown for two to three replicates per layer (exception layer 4 to 5 mm). In the sample name, the roman number indicates the mat patch replicate and the arabic number indicated the layer from “0” being the surface orange layer to “4” being the bottom gray layer. (B) Estimated cell numbers of photoautotrophs (Cyanobacteria), sulfate-reducing bacteria (all Deltaproteobacteria), and sulfur-oxidizing bacteria in each layer. Full data on relative sequence abundances is provided in File S1 in the supplemental material.

References

    1. Bolhuis H, Cretoiu MS, Stal LJ. 2014. Molecular ecology of microbial mats. FEMS Microbiol Ecol 90:335–350. 10.1111/1574-6941.12408. - DOI - PubMed
    1. Wong H, Ahmed-Cox A, Burns B. 2016. Molecular ecology of hypersaline microbial mats: current insights and new directions. Microorganisms 4:6. 10.3390/microorganisms4010006. - DOI - PMC - PubMed
    1. Krumbein WE, Gorbushina AA, Holtkamp-Tacken E. 2004. Hypersaline microbial systems of sabkhas: examples of life’s survival in “extreme” conditions. Astrobiology 4:450–459. 10.1089/ast.2004.4.450. - DOI - PubMed
    1. O'Malley-James JT, Greaves JS, Raven JA, Cockell CS. 2013. Swansong biospheres: refuges for life and novel microbial biospheres on terrestrial planets near the end of their habitable lifetimes. Int J Astrobiol 12:99–112. 10.1017/S147355041200047X. - DOI
    1. Wentworth SJ, Morris PA. 2003. Evaporites, water, and life, part 1. Introduction. Astrobiology 3:581–582. 10.1089/153110703322610663. - DOI - PubMed

Publication types

LinkOut - more resources