. 2021 Sep;42(13):4102-4121.
doi: 10.1002/hbm.25541. Epub 2021 Jun 23.

Proof-of-concept evidence for trimodal simultaneous investigation of human brain function

Affiliations

Proof-of-concept evidence for trimodal simultaneous investigation of human brain function

Matthew Moore et al. Hum Brain Mapp. 2021 Sep.

Abstract

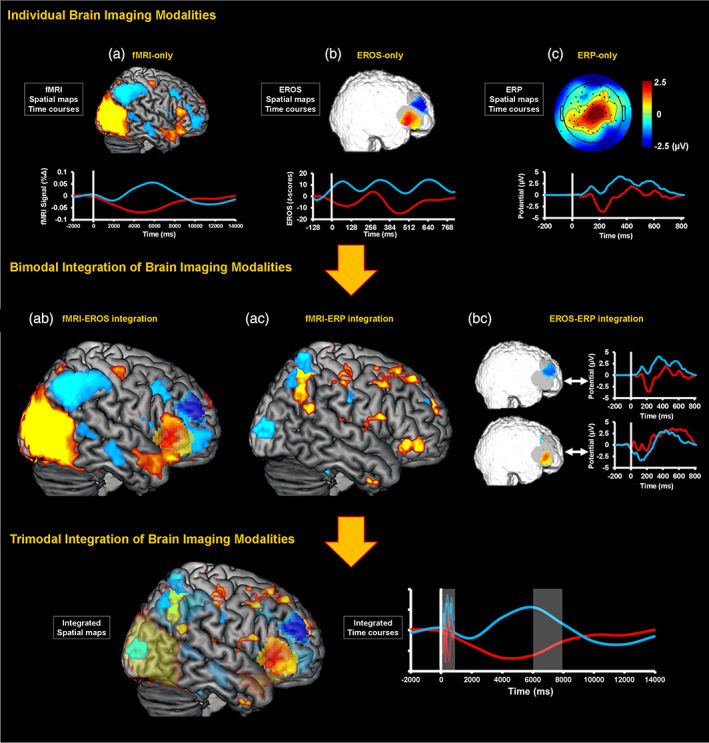
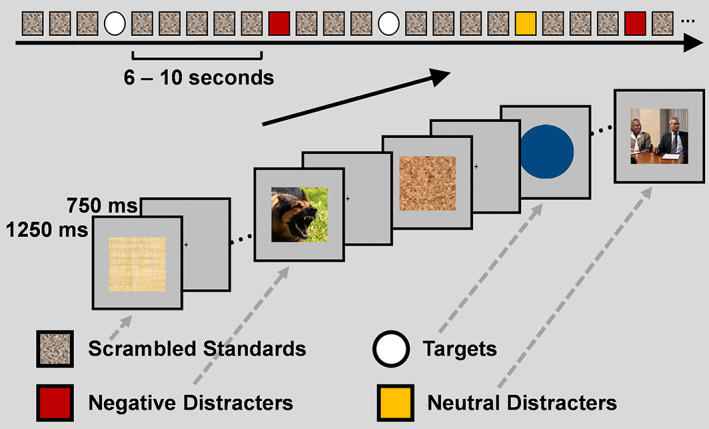
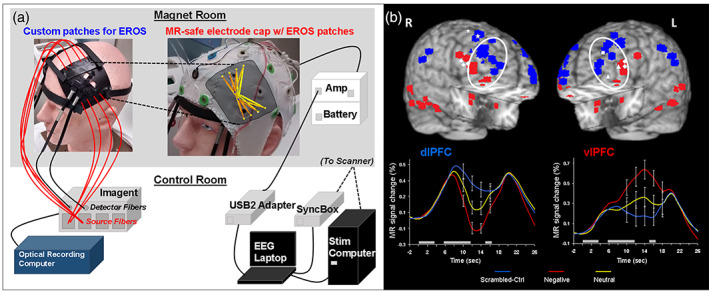
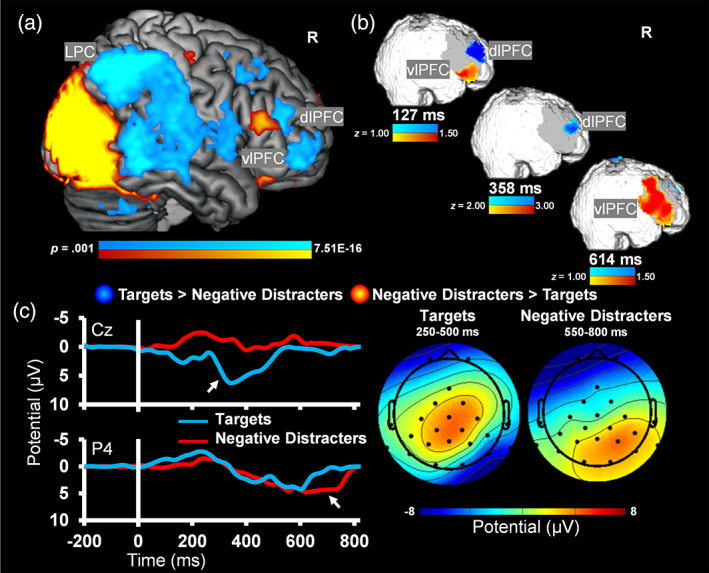
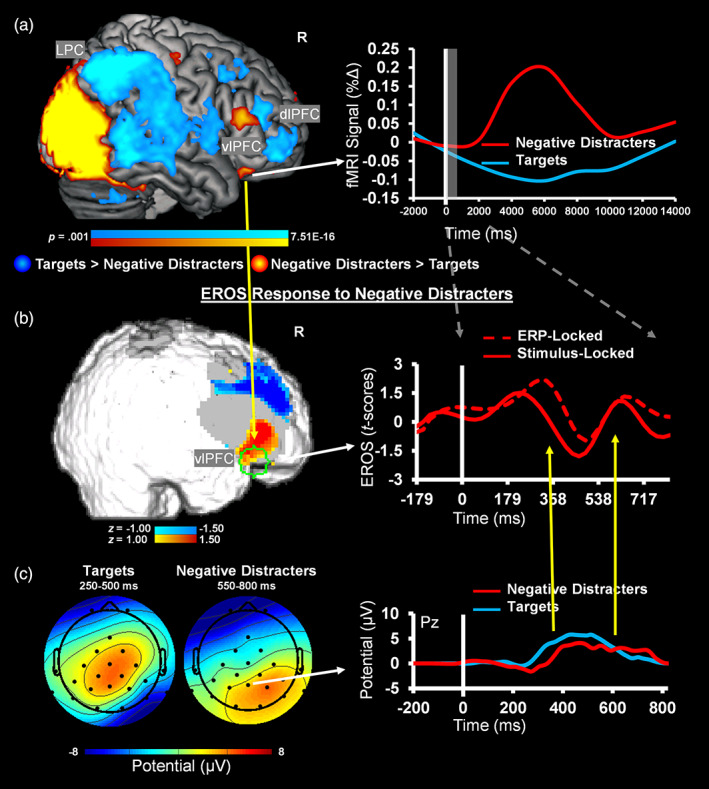
The link between spatial (where) and temporal (when) aspects of the neural correlates of most psychological phenomena is not clear. Elucidation of this relation, which is crucial to fully understand human brain function, requires integration across multiple brain imaging modalities and cognitive tasks that reliably modulate the engagement of the brain systems of interest. By overcoming the methodological challenges posed by simultaneous recordings, the present report provides proof-of-concept evidence for a novel approach using three complementary imaging modalities: functional magnetic resonance imaging (fMRI), event-related potentials (ERPs), and event-related optical signals (EROS). Using the emotional oddball task, a paradigm that taps into both cognitive and affective aspects of processing, we show the feasibility of capturing converging and complementary measures of brain function that are not currently attainable using traditional unimodal or other multimodal approaches. This opens up unprecedented possibilities to clarify spatiotemporal integration of brain function.

Keywords: data fusion; event-related optical signal (EROS); event-related potentials (ERPs); functional magnetic resonance imaging (fMRI); multimodal neuroimaging; simultaneous recording.


Conflict of interest statement

The authors declare no conflicts of interest.

Figures

FIGURE 1
FIGURE 1
Integration of multimodal data. First, signal from functional magnetic resonance imaging (fMRI), event‐related optical signals (EROS), and event‐related potentials (ERPs) can be extracted and analyzed individually in relation to cognitive processes, behaviors, or individual differences (top panel). Note the differences in the spatial and temporal scales of the fMRI, EROS, and ERP signals. For display purposes, the EROS data were downsampled with a resampling factor of 4. Second, pairs of brain imaging modalities can be analyzed together to identify associations between brain signals (middle panel), and the combined information can be examined in relation to the activity of interest. Third, all three brain imaging modalities can be integrated together (bottom panel), by linking the emergent information from the integrated pairs of modalities, and/or by jointly analyzing spatiotemporal features across all three modalities. Illustrations of fMRI (A), ERP (C), and data integrations (AC, BC, and bottom panel) include adaptations from Moore et al. (2019), with permission. For consistency across imaging modalities, integration data from the right hemisphere is featured here at a lower threshold. Notably, the right hemisphere regions shown are homologous to the fMRI–ERP integration results identified in Moore et al. (2019)
FIGURE 2
FIGURE 2
Diagram of the emotional oddball task. Participants detected rare “oddball” target stimuli presented in a string of standard (scrambled) and distracter (emotional and neutral) pictures. Participants pressed a button with their right index finger to all target stimuli, and their left index finger to all frequent (i.e., scrambled pictures) and infrequent (i.e., emotional and neutral pictures) stimuli. Adapted from Moore et al. (2019), with permission
FIGURE 3
FIGURE 3
(a) Diagram of the trimodal imaging equipment with frontal event‐related optical signals (EROS) coverage. In the functional magnetic resonance imaging (fMRI) scanner, EROS, and event‐related potential (ERP) data were recorded using bilateral patches (top left), used to apply optical fibers over lateral PFC, and a MR‐compatible electrode cap (top right). The optical detector fibers were applied to the scalp using prisms, to allow for tangential orientation such that the electrode cap could be placed over the patch, and the optical emitter fibers were threaded through the mesh of the electrode cap. Optical fibers were connected to the ISS Imagent unit placed in the scanner's control room, which input to the acquisition computer running optical recording software (bottom left). The ERP signal was acquired using the Brain Products BrainAmp MR Plus and USB2 Adapter, sending the signal to the acquisition laptop. The ERP acquisition also recorded the clock signal from the MR scanner via the SyncBox, and TR and event markers via a parallel port cable bringing signals from the MRI scanner and stimulus computer (bottom right). For the trimodal helmet version, the optical arrays covered the same locations as well as parietal cortex (not shown), and curved optical fibers replaced the prisms. (b) Dorso‐ventral dissociation of brain activation in response to emotional distraction guiding the placement of EROS patches. Peak activation voxels from ventral (VAS) areas showing increased (red) and dorsal (DES) areas showing decreased (blue) activity to negative distraction are displayed on anatomical images, based on their locations identified across fMRI studies of emotional distraction, including with emotional oddball tasks (reviewed in Iordan et al., 2013). The white diamonds and triangles mark peak voxels from areas involved in coping with emotional distraction. The line graphs show the typical time course of activity in dorsal (dlPFC) and ventral (vlPFC) regions. Emotional distraction produced the most disrupting effect on activity in dlPFC, while producing the most enhancing effect in vlPFC. These regions were therefore targeted for EROS recording using the lateral PFC patches shown in the left panel. The white ovals illustrate the relative location of the patches over the lateral PFC. The gray boxes above the x‐axes indicate the onset and duration of the working memory task's phases: memoranda, distracters, and probes. L, Left; R, Right; dlPFC, dorsolateral prefrontal cortex; vlPFC, ventrolateral PFC. Adapted from Dolcos and McCarthy (2006) (Copyright 2006 Society for Neuroscience) and Iordan et al. (2013), with permission
FIGURE 4
FIGURE 4
Converging evidence from simultaneous trimodal recordings. Dorso‐ventral dissociations typically observed in the functional magnetic resonance imaging (fMRI) data 6–8 s poststimulus onset (a) were first identified by event‐related optical signals (EROS) as early as < 150 ms post‐onset (b). Event‐related potentials (ERPs) captured similar temporal dissociations for targets and distracters, but at posterior electrode locations (c); see also the topographic maps. Notably, the peak differential sensitivity to targets (250–500 ms) and distracters (550–800 ms) corresponds to known ERP components: P300 and LPP. The ERP plots illustrate the locations for which P300 and LPP were maximal. R, right; dlPFC, dorsolateral prefrontal cortex; vlPFC, ventrolateral PFC; LPC, lateral parietal cortex
FIGURE 5
FIGURE 5
Evidence for Integration of functional magnetic resonance imaging (fMRI) and event‐related potential (ERP) information for analysis of event‐related optical signals (EROS) data. (a) fMRI peak sensitivity for the contrast of negative distracters versus targets was used to define a spatial region of interest (ROI, delineated in green on Panel (b)), and (c) P300 latencies from electrode Pz, which served as a common location for P300 amplitudes across conditions, were used to adjust the time‐locking of the EROS data, trial‐by‐trial, to extract spatially and temporally informed EROS data. (b) Adjusting the time‐locking of fMRI‐informed EROS data based on ERP latency yielded increased EROS amplitude to negative distracters compared to baseline (brain map shows ~76 ms before the P300 peak following negative distracters), while also showing temporal richness evident in modulations within time‐windows similar to ERPs. For display purposes, the EROS data were downsampled with a resampling factor of 5. R, right; dlPFC, dorsolateral prefrontal cortex; vlPFC, ventrolateral PFC; LPC, lateral parietal cortex

References

    1. Ahmadi, M., & Quiroga, R. Q. (2013). Automatic denoising of single‐trial evoked potentials. NeuroImage, 66, 672–680. 10.1016/j.neuroimage.2012.10.062 - DOI - PubMed
    1. Anticevic, A., Repovs, G., & Barch, D. M. (2010). Resisting emotional interference: Brain regions facilitating working memory performance during negative distraction. Cognitive, Affective, & Behavioral Neuroscience, 10(2), 159–173. 10.3758/CABN.10.2.159 - DOI - PMC - PubMed
    1. Bénar, C. G., Schön, D., Grimault, S., Nazarian, B., Burle, B., Roth, M., … Anton, J. L. (2007). Single‐trial analysis of oddball event‐related potentials in simultaneous EEG‐fMRI. Human Brain Mapping, 28(7), 602–613. 10.1002/hbm.20289 - DOI - PubMed
    1. Braver, T. S. (2012). The variable nature of cognitive control: A dual mechanisms framework. Trends in Cognitive Sciences, 16(2), 106–113. 10.1016/j.tics.2011.12.010 - DOI - PMC - PubMed
    1. Bressler, S. L., & Menon, V. (2010). Large‐scale brain networks in cognition: Emerging methods and principles. Trends in Cognitive Sciences, 14(6), 277–290. 10.1016/j.tics.2010.04.004 - DOI - PubMed

Publication types