. 2021 Aug 15;32(17):1565-1578.
doi: 10.1091/mbc.E20-11-0695. Epub 2021 Jun 23.

Quantitative live-cell PALM reveals nanoscopic Faa4 redistributions and dynamics on lipid droplets during metabolic transitions of yeast

Affiliations

Quantitative live-cell PALM reveals nanoscopic Faa4 redistributions and dynamics on lipid droplets during metabolic transitions of yeast

Santosh Adhikari et al. Mol Biol Cell. .

Abstract

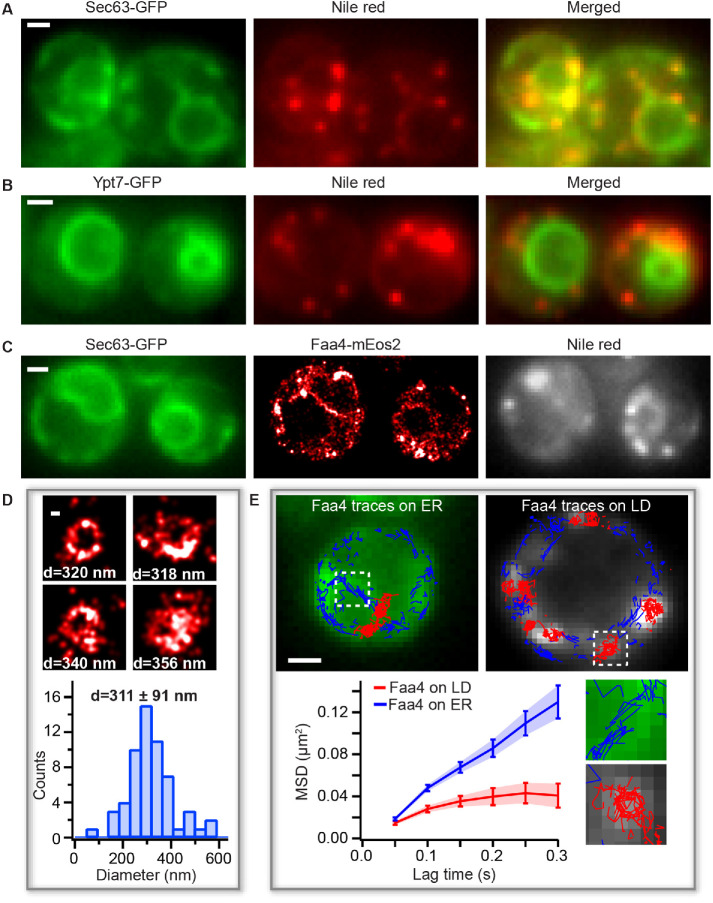
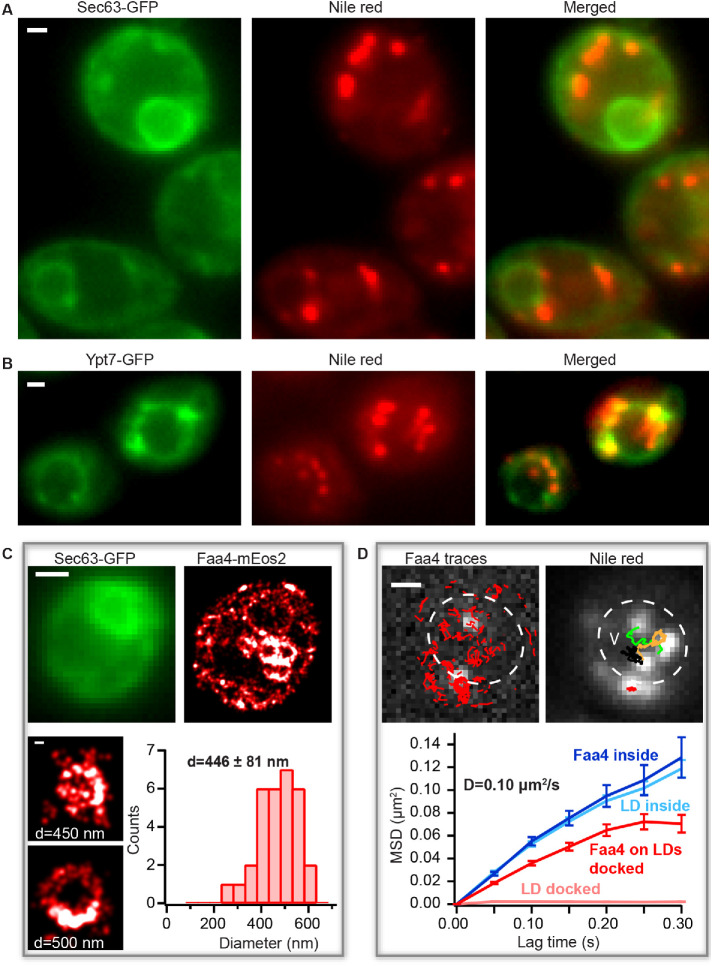
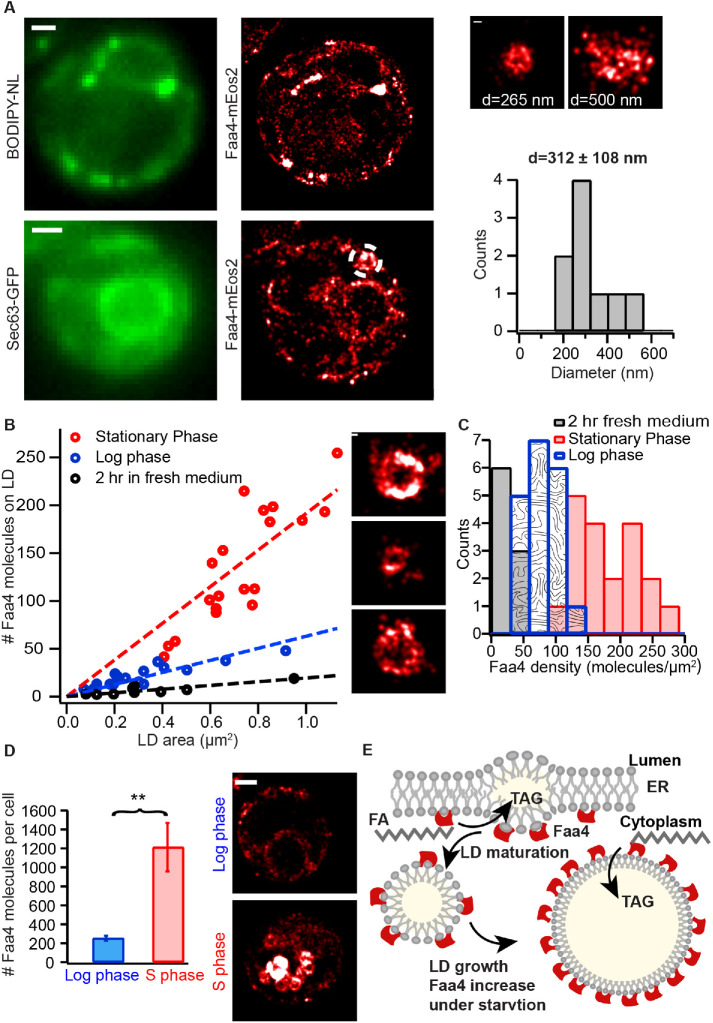
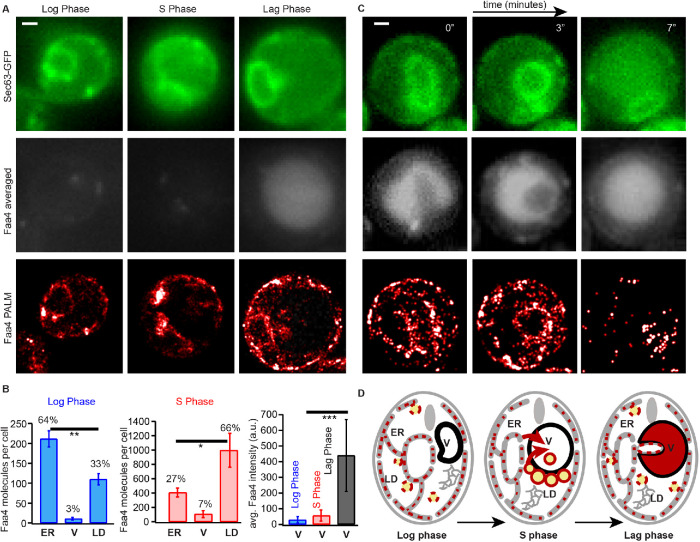
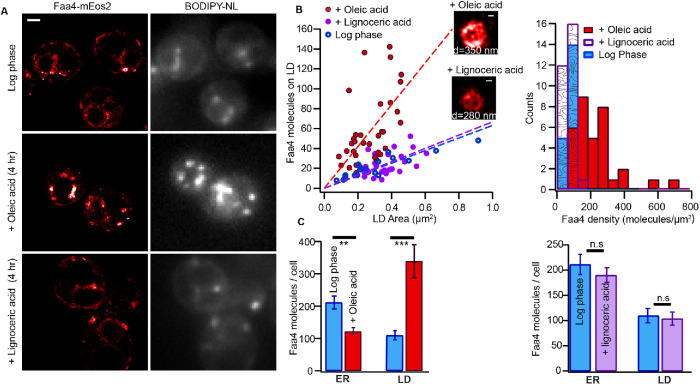
Lipid droplets (LDs) are dynamic organelles for lipid storage and homeostasis. Cells respond to metabolic changes by regulating the spatial distribution of LDs and enzymes required for LD growth and turnover. The small size of LDs precludes the observation of their associated enzyme densities and dynamics with conventional fluorescence microscopy. Here we employ quantitative photo-activated localization microscopy to study the density of the fatty acid (FA) activating enzyme Faa4 on LDs in live yeast cells with single-molecule sensitivity and 30 nm resolution. During the log phase LDs colocalize with the endoplasmic reticulum (ER) where their emergence and expansion are mediated by the highest observed Faa4 densities. During transition to the stationary phase, LDs with a ∼2-fold increased surface area translocate to the vacuolar surface and lumen and exhibit a ∼2.5-fold increase in Faa4 density. The increased Faa4 density on LDs further suggests its role in LD expansion, is caused by its ∼5-fold increased expression level, and is specific to exogenous FA chain-lengths. When lipolysis is induced by refreshed medium, Faa4 shuttles through ER- and lipophagy to the vacuole, where it may activate FAs for membrane expansion and degrade Faa4 to reset its cellular abundance to levels in the log phase.


Figures

FIGURE 1:
FIGURE 1:
PALM reveals LD sizes and Faa4 dynamics in living cells. (A) The conventional fluorescence images of Sec63-GFP (left), Nile red (middle), and merged (right) show that LDs are colocalized with the ER in the log phase. (B) The conventional fluorescence image of Ypt7-GFP (left), Nile red (middle), and merged (right) indicate that LDs are not localized to the vacuole. (C) Conventional image of Sec63-GFP (left), PALM image of Faa4-mEos2 (middle), and conven­tional image of LDs stained with Nile red (right) visualize Faa4-mEos2 localizations at the ER and in dense spots that colocalize with LDs. (D) Representative images of superresolved LDs and histogram of LD diameters with a mean of 311 ± 91 nm (N = 58 LDs from 25 cells). Error represents the SD of all LD sizes. (E) Single-molecule tracking of Faa4-mEos2 superimposed on Sec63-GFP (left) and Nile red (right) reveals traces on the ER (blue) and on LDs (red). The MSD of Faa4 traces on the ER (N = 3 cells,1270 traces longer than three frames) and on LDs (N = 8 LDs from three cells, 280 traces longer than three frames) exhibit free diffusion of Faa4 at shorter lag times but confinement on LDs at longer lag times. Scale bars: 1 μm; D: 100 nm.
FIGURE 2:
FIGURE 2:
Faa4 redistribution and LD dynamics during the transition to the stationary phase. (A) The conventional fluorescence images of Sec63-GFP (left), Nile red (middle), and merged (right) show LDs not colocalized with the ER during the stationary phase. (B) Conventional fluorescence images of Ypt7-GFP (left), Nile red (middle), and merged (right) reveal LDs either docked to or inside the vacuole. (C) Sec63-GFP (top, left) visualizes the ER. PALM image of Faa4-mEos2 (top, right) reveals Faa4 localized to the ER and to LDs. Representative superresolved images (bottom) of LDs with an increased mean diameter of 446 ± 81 nm (N = 31 LDs from 10 cells). Error is calculated from the SD of all LD diameters. (D) The single-molecule traces (red) superimposed on single-molecule signals (white) of Faa4-mEos2 show confined diffusion along the surface of immobile LDs at the vacuole and free diffusion on diffusing LDs inside the vacuole (left). SPT of LDs with the conventional fluorescence signal from Nile red reveals immobile LDs at the vacuole and free diffusion of LDs inside (right). The MSD of Faa4-mEos2 (N = 140 traces from 3 LDs) and LDs (N = 425 traces from 3 LDs) exhibit a similar slope with D = 0.10 µm2/s inside the vacuole (bottom). LDs on the vacuole are immobile while the MSD of Faa4 indicates free diffusion with confinement at longer lag times on the surface of LDs as in the log phase (bottom). Scale bars: 1 μm; zoom in C: 100 nm.
FIGURE 3:
FIGURE 3:
Quantitative live-cell PALM reveals a ∼2.5-fold density increase of Faa4 on LDs for their expansion during the stationary phase. (A) In the lag phase single Faa4-mEos2 molecules are localized to LDs visualized with BODIPY-NL (top) and to the ER visualized with Sec63-GFP (bottom). The diameter of LDs with a mean of 312 ± 108 nm (N = 9 LDs from four cells) is similar to LDs in the log phase (right). (B) The quantified number of Faa4 molecules on individual LDs linearly correlates with their surface area for each growth phase. The larger slope of LDs in the stationary phase compared with log and lag phases indicates an increase in Faa4 density on LDs during the stationary phase. The insets show PALM images of LDs in the stationary (top), log (middle), and lag phase (bottom). (C) The histograms of Faa4 densities on LDs shows a roughly 2.5-fold increase of Faa4 density on LDs in the stationary phase compared with the log phase. (D) The total number of Faa4 molecules per cell in the stationary phase is roughly fivefold higher (p = 0.0033, t test) compared with the lag phase and explains the increased Faa4 density on LDs. Error bars are the SE of the mean calculated using N = 9 cells for each case. The representative superresolution images of Faa4-mEos2 exhibit dense localizations on LDs in the stationary phase and overall much less localizations of Faa4 on the ER and on few emerging LDs in the log phase. (E) A model for LD expansion mediated by a higher density of Faa4 on the LD surface. Scale bars: 1 μm; zooms: 100 nm. Asterisks indicate statistical significance from t test (**p ≤ 0.005).
FIGURE 4:
FIGURE 4:
Subcellular Faa4 distribution on the ER, LDs, and the vacuole is coupled to the growth phase. (A) Sec63-GFP fluorescence in the log (top, left), stationary (top, middle) and lag phase (top, right) visualizes the ER. The averaged Faa4-mEos2 signal in the log (middle, left), stationary (middle, middle), and lag (middle, right) phases reveals an intense and diffuse Faa4 signal from the circular vacuolar region only in the lag phase. Faa4-mEos2 is similarly localized to the ER and the LDs in the log and lag phase (bottom) but mostly forms dense coats on LDs in the stationary phase. (B) The quantification of the absolute number and the percentage of Faa4 molecules that colocalized with ER, vacuole and LDs in the log (N = 14 cells) and stationary phase (N = 7 cells). Error bars represent the SE of the mean. The quantification of the average intensity counts per pixel inside the vacuole reveal that Faa4 is predominately localized to the vacuole after 2 h of dilution in fresh medium (lag phase) (N = 5 cells). (C) Time lapse shows how a portion of the Sec63-GFP signal is progressively taken inside the averaged Faa4-mEos2 signal, which indicates that a part of the ER is taken inside vacuole after 30 min of dilution in fresh medium. (D) Schematics showing localization and redistribution of Faa4 among the ER, LDs, and the vacuole in the log, stationary and lag phase. Scale bars: 1 μm. Asterisks indicate statistical significance from t test (*p ≤ 0.05, **p ≤ 0.005, ***p ≤ 0.0005).
FIGURE 5:
FIGURE 5:
The subcellular distribution of Faa4 and density on LDs is dependent on the carbon chain length of exogenously added fatty acids. (A) Faa4-mEos2 PALM and BODIPY-NL image of yeast cells grown to log phase (top). Faa4 is localized to the ER and to a few LDs as confirmed by the BODIPY-NL signal. In the presence of oleic acid (C18), a higher number of LDs per cell is observed and Faa4 predominately localizes to LDs (middle). The Faa4 and LD distribution in the presence of lignoceric acid (C24) resembles that of the log phase (bottom). (B) Area of individual LDs vs. the number of Faa4 molecules on LDs surface from cells in the log phase and in the presence of oleic acid and lignoceric acid (left). Histogram of surface densities of Faa4 on individual LDs (right). (C) Quantification of the number of Faa4 molecules per cell localized to the ER and LDs in the log phase (N = 14 cells) and in the presence of oleic acid (left) (N = 20 cells) and in the presence of lignoceric acid (right) (N = 17 cells). Error bars represent the SE of the mean. Scale bar: 1 μm; zooms: 100 nm. Asterisks indicate statistical significance from t test (**p ≤ 0.005, ***p ≤ 0.0005).

References

    1. Adhikari S, Moscatelli J, Smith EM, Banerjee C, Puchner EM (2019). Single-molecule localization microscopy and tracking with red-shifted states of conventional BODIPY conjugates in living cells. Nat Commun 10, 3400. - PMC - PubMed
    1. Adhikari S, Banerjee C, Moscatelli J, Puchner EM (2020). Conventional BODIPY conjugates for live-cell super-resolution microscopy and single-molecule tracking. J Vis Exp JoVE 160, e60590. - PMC - PubMed
    1. Annibale P, Scarselli M, Kodiyan A, Radenovic A (2010). Photoactivatable fluorescent protein mEos2 displays repeated photoactivation after a long-lived dark state in the red photoconverted form. J Phys Chem Lett 1, 1506–1510.
    1. Annibale P, Vanni S, Scarselli M, Rothlisberger U, Radenovic A (2011). Quantitative photo activated localization microscopy: unraveling the effects of photoblinking. PLoS One 6. - PMC - PubMed
    1. Ashrafi K, Farazi TA, Gordon JI (1998). A role for Saccharomycescerevisiae fatty acid activation protein 4 in regulating protein N-myristoylation during entry into stationary phase. J Biol Chem 273, 25864–25874. - PubMed

Publication types

MeSH terms

LinkOut - more resources