. 2021 Jun 22;118(25):e2022495118.
doi: 10.1073/pnas.2022495118.

Monocarboxylate transporter antagonism reveals metabolic vulnerabilities of viral-driven lymphomas

Affiliations

Monocarboxylate transporter antagonism reveals metabolic vulnerabilities of viral-driven lymphomas

Emmanuela N Bonglack et al. Proc Natl Acad Sci U S A. .

Abstract

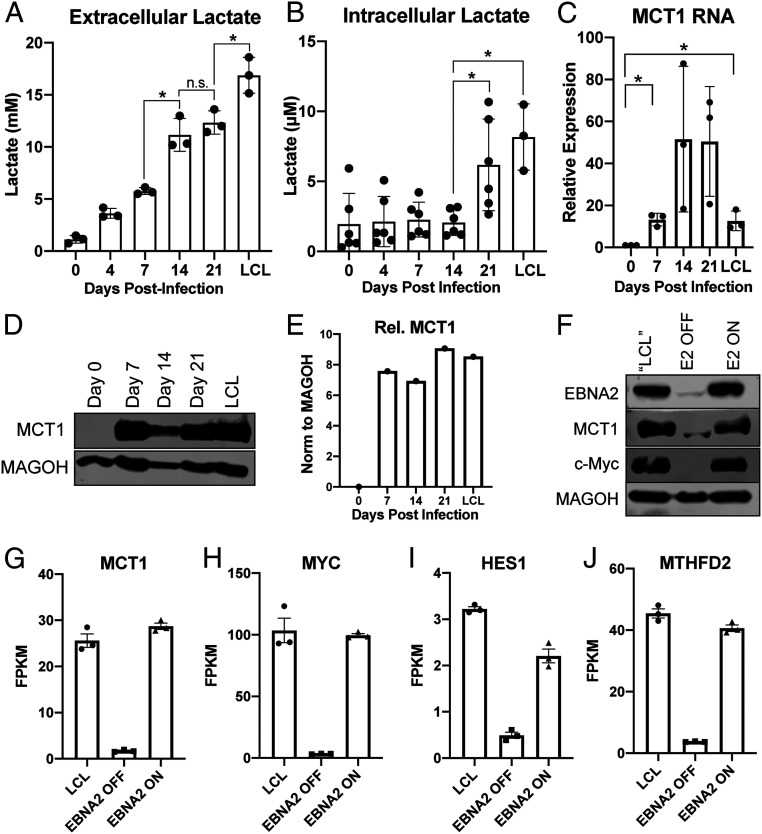
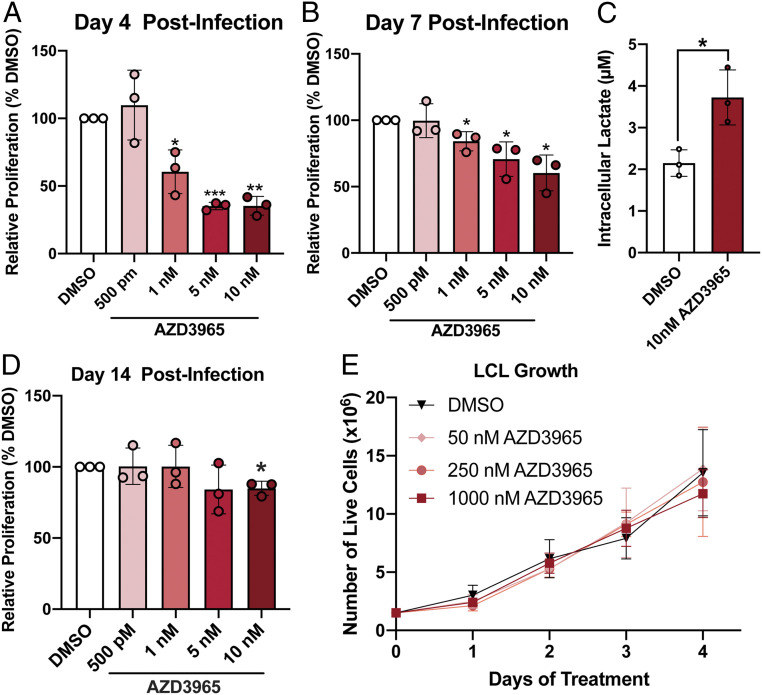
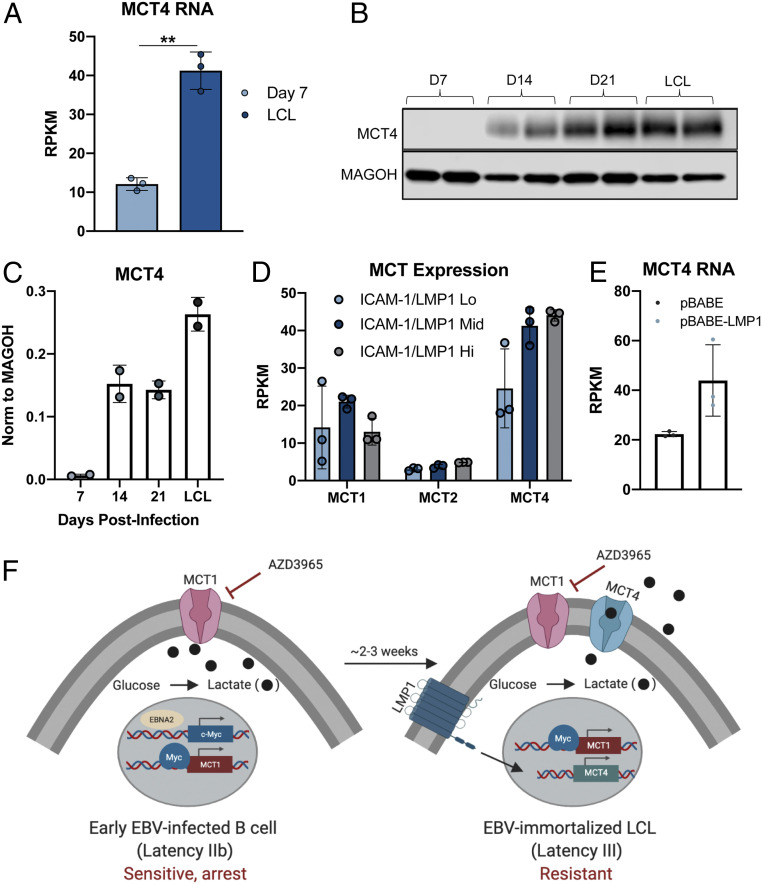
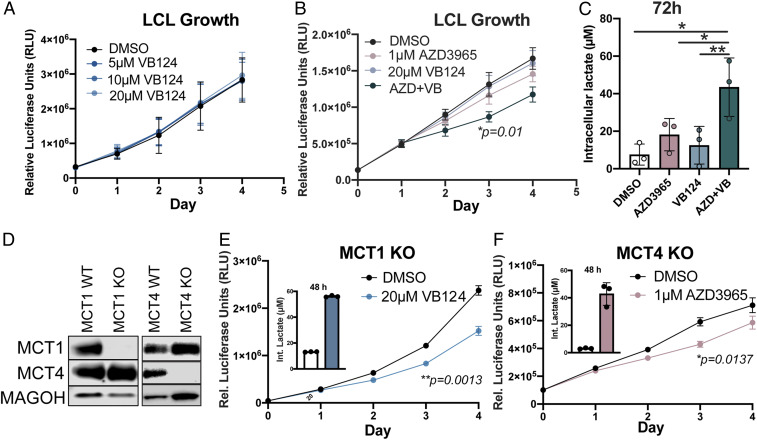
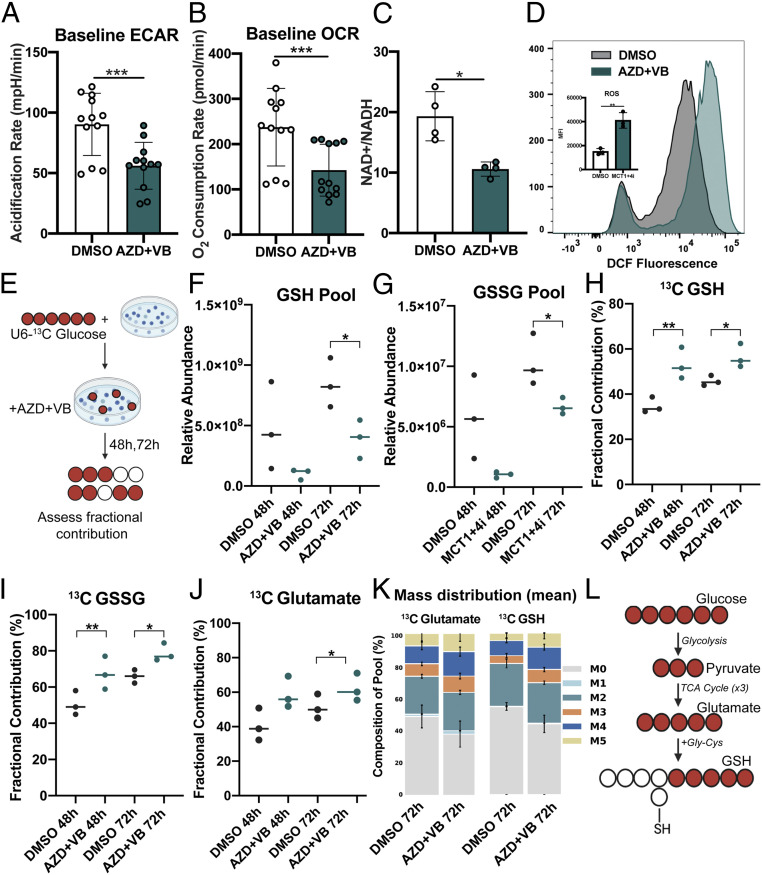
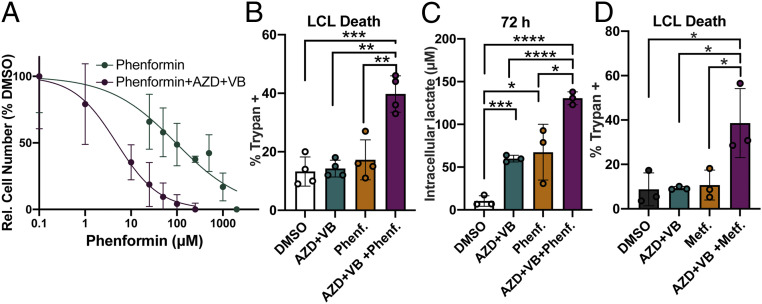
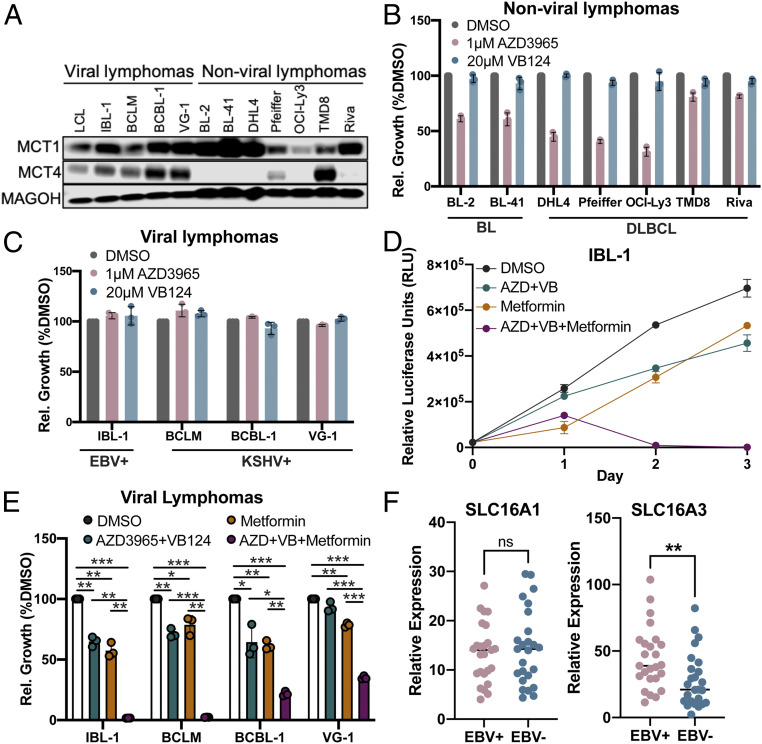
Epstein-Barr virus (EBV) is a ubiquitous herpesvirus that typically causes asymptomatic infection but can promote B lymphoid tumors in the immune suppressed. In vitro, EBV infection of primary B cells stimulates glycolysis during immortalization into lymphoblastoid cell lines (LCLs). Lactate export during glycolysis is crucial for continued proliferation of many cancer cells-part of a phenomenon known as the "Warburg effect"- and is mediated by monocarboxylate transporters (MCTs). However, the role of MCTs has yet to be studied in EBV-associated malignancies, which display Warburg-like metabolism in vitro. Here, we show that EBV infection of B lymphocytes directly promotes temporal induction of MCT1 and MCT4 through the viral proteins EBNA2 and LMP1, respectively. Functionally, MCT1 was required for early B cell proliferation, and MCT4 up-regulation promoted acquired resistance to MCT1 antagonism in LCLs. However, dual MCT1/4 inhibition led to LCL growth arrest and lactate buildup. Metabolic profiling in LCLs revealed significantly reduced oxygen consumption rates (OCRs) and NAD+/NADH ratios, contrary to previous observations of increased OCR and unaltered NAD+/NADH ratios in MCT1/4-inhibited cancer cells. Furthermore, U-13C6-glucose labeling of MCT1/4-inhibited LCLs revealed depleted glutathione pools that correlated with elevated reactive oxygen species. Finally, we found that dual MCT1/4 inhibition also sensitized LCLs to killing by the electron transport chain complex I inhibitors phenformin and metformin. These findings were extended to viral lymphomas associated with EBV and the related gammaherpesvirus KSHV, pointing at a therapeutic approach for targeting both viral lymphomas.

Keywords: Epstein–Barr virus; cancer metabolism; lactate export; monocarboxylate transporter; viral lymphoma.


Conflict of interest statement

The authors declare no competing interest.

Figures

Fig. 1.
Fig. 1.
EBV infection of human B cells leads to an increase in lactate transport through MCT1. (A) Extracellular (n = 3) and (B) Intracellular (n = 6) lactate concentration during EBV-infected B cell immortalization. Extracellular concentration was obtained from the supernatant of CD19+-isolated B cells at a concentration of 1 × 10⁶/mL and corrected to cell-free growth medium lactate concentrations. Intracellular lactate concentration is per 12,500 cells. (C) MCT1 RNA (n = 3) and (D) protein levels during EBV-infected B cell immortalization. MAGOH is a loading control used because its expression does not change during B cell outgrowth. (E) Quantitation of MCT1 protein levels from D, normalized to MAGOH. (F) Immunoblot of EBNA2, MCT1, and c-Myc in P493-6 cells at the “LCL” state with stable EBNA2 expression, EBNA2 OFF in the absence of β-estradiol, and EBNA2 ON with EBNA2 expression regained. (GJ) RNA-seq data showing MCT1, c-Myc, HES1, and MTHFD2 expression in P493-6 B cells (n = 3). FPKM = fragments per kilobase of transcript per million mapped reads. All statistical significance was determined by a paired Student’s t test, in which *P < 0.05 and n.s. (not significant) is P ≥ 0.05.
Fig. 2.
Fig. 2.
MCT1 inhibition leads to growth arrest and lactate buildup in early EBV-infected B cells. (A) Bulk PBMCs (n = 3) were treated with AZD3965 immediately following EBV infection, and CD19+ B cell proliferation was based on CellTrace Violet dilution as determined by flow cytometry 4 d later. Cell counts were bead normalized. (B) Bulk PBMCs (n = 3) were treated at 4 d postinfection and after 3 d in media. CD19+ B cell proliferation assessed at day 7 postinfection as in A. (C) CD19-purified B cells (n = 3) were treated at 4 d postinfection and intracellular lactate assessed 3 d later at day 7 postinfection. (D) Same as B, except proliferation was assessed at 14 d postinfection. (E) Growth curve of LCLs (n = 3) treated with varying concentrations of AZD3965. LCL growth was determined by daily assessment of trypan blue exclusion. Statistical significance determined was by a paired Student’s t test. *P < 0.05, **P < 0.01, and ***P < 0.001.
Fig. 3.
Fig. 3.
EBV-infected B cells acquire resistance to MCT1 inhibition during B cell transformation due to MCT4 induction. (A) Queried RNA-seq data of MCT4 expression in EBV-infected B cells (n = 3) at 7 d postinfection and LCL (37). RPKM = reads per kilobase of transcript per million mapped reads. (B) Western blot of MCT4 in CD19+-purified B cells during EBV-mediated B cell immortalization. MAGOH = loading control. (C) Quantification of B (n = 2). (D) MCT expression from RNA-seq of LCLs sorted by the LMP1 proxy, ICAM-1, status. (E) Queried RNA-seq data of MCT4 expression in DG75 cells (n = 3) transfected with LMP1. Statistical significance was determined by paired Student’s t test. **P < 0.01. (F) Schematic representation of MCT1 inhibitor sensitivity during EBV-mediated B lymphocyte immortalization. Created with https://biorender.com/.
Fig. 4.
Fig. 4.
Dual MCT1/4 inhibition reduces LCL growth and increases intracellular lactate. (A) Growth curve of LCLs (n = 3) treated with varying concentrations of VB124. Growth was determined by CellTiter Glo. (B) Growth curve of LCLs (n = 3) treated with either DMSO, 1 µM AZD3965, 20 µM VB124, or 1 µM AZD3965 + 20 µM VB124. Growth was assessed as in A. Statistical significance was determined for day 3 of treatment. (C) Intracellular lactate concentration (per 12,500 cells) at 72 h of LCLs (n = 3) treated with either DMSO, 1 µM AZD3965, 20 µM VB124, or 1 µM AZD3965 + 20 µM VB124. (D) Western blot representation of CRISPR-Cas9–mediated MCT1- and MCT4-knockout LCLs. MAGOH = loading control. (E) MCT1-knockout LCL growth (n = 3) over time and intracellular lactate concentration at 48 h following treatment with 20 µM VB124. Statistical significance was calculated at day 3. (F) MCT4-knockout LCL growth (n = 3) over time and intracellular lactate concentration at 48 h following treatment with 1 µM AZD3965. Statistical significance was calculated at day 3. Statistical significance was determined by paired Student’s t test in which *P < 0.05 and **P < 0.01.
Fig. 5.
Fig. 5.
Dual MCT1/4 inhibition elicits broad changes in LCL metabolism. (A) Seahorse assay showing ECAR and (B) OCR of LCLs (n = 4) in triplicate. AZD + VB = 1 µM AZD3965 + 20 µM VB124. Phenf. = 10 µM Phenformin. (C) NAD+/NADH ratio of LCLs (n = 4) treated for 48 h. (D) FACS histograms and mean fluorescence intensity quantitation of treated LCLs (n = 3) treated with 1 µM AZD3965 + VB124 and stained with 2′,7′-dichlorodihydrofluorescein diacetate (H2-DCFDA). (E) Schematic of experimental workflow for glucose labeling and inhibitor treatment in LCLs. (FJ) Metabolic analysis with U-13C6–glucose tracing of GSH or GSSG glutathione and glutamate in LCLs (n = 3) treated with either DMSO or MCT1 + MCT4 inhibitors for 48 or 72 h. Cells were cultured in the presence of U-13C6–glucose–supplemented growth medium. Fractional contribution = % 13C-labeled GSH or GSSG relative to pool size. Pool = Relative abundance of GSH or GSSH in sample, as determined by liquid chromatography-mass spectrometry (LC-MS). (K) Mass distribution of 13C-glutathione (reduced) isotopologues. (L) Schematic of flow from glucose to glutathione. All statistical significance was determined using paired Student’s t test in which *P < 0.05, **P < 0.01, and ***P < 0.001.
Fig. 6.
Fig. 6.
MCT1/4 inhibition renders LCLs more susceptible to killing by ETC complex I inhibitors phenformin and metformin. (A) Phenformin IC50 curve generated after 72-h treatment of LCLs (n = 3) with either phenformin or phenformin plus 1 µM AZD3965 and 20 µM VB124. Relative cell number was determined by CellTiter Glo luminescence assay. Relative luminescence values (in relative luciferase units) were normalized to DMSO to obtain %DMSO. (B) LCL death (n = 3) was determined by trypan blue staining after 72 h of treatment with either DMSO, 1 µM AZD3965 + 20 µM VB124 (AZD + VB), 10 µM phenformin (Phenf.), or 1 µM AZD3965 + 20 µM VB124 + 10 µM phenformin (AZD + VB + Phenf.). (C) Intracellular lactate concentration (per 12,500 cells) at 72 h of LCLs treated as in B. (D) LCL death (n = 3) in cells treated with DMSO, 1 µM AZD3965 + 20 µM VB124 (AZD + VB), 2 mM metformin (Metf.), or 1 µM AZD3965 + 20 µM VB124 + 2 mM phenformin (AZD + VB + Metf.), was determined by trypan blue staining after 72 h. All statistical significance was determined by a paired Student’s t test. *P < 0.05, **P < 0.01, ***P < 0.001, and ****P < 0.0001.
Fig. 7.
Fig. 7.
EBV+ and KSHV+ lymphoma cell lines are sensitized to killing by metformin upon dual MCT1/4 inhibition. (A) Western blot of MCT1 and MCT4 protein expression in viral (EBV+ or KSHV+) and nonviral (BL or DLBCL) lymphoma cell lines. MAGOH = loading control. (B) Relative cell growth (normalized to DMSO) in nonviral and, in (C), viral lymphoma cell lines. Cell growth was determined by CellTiter Glo luminescence. (D) Growth over time of the EBV + IBL-1 cell line (n = 3), after treatment with DMSO, 1 µM AZD3965 + 20 µM VB124 (AZD + VB), 2 mM Metformin (Metformin), or 1 µM AZD3965 + 20 µM VB124 +2 mM Metformin (AZD + VB + Metformin). The error bars smaller than the line symbols were automatically excluded by graphing software. (E) Relative cell growth of viral lymphoma cell lines at 48 h posttreatment as in D. IBL-1 = EBV+, KSHV− AIDS immunoblastic lymphoma, BCBL-1 = EBV−, KSHV + PEL, VG-1 = EBV−, KSHV+ PEL, BCLM = EBV−, KSHV+ PEL. Statistical significance was determined by a one-tailed paired Student’s t test where *P < 0.05, **P < 0.01, and ***P < 0.001. (F) Relative expression of SLC16A1 (MCT1) and SLC16A3 (MCT4) in EBV-positive (EBV+) and EBV-negative (EBV−) human DLBCL biopsies. RNA-seq comparisons were evaluated by Wilcoxon rank sum test; **P < 0.01, ns (not significant) P ≥ 0.05.

References

    1. Babcock G. J., Decker L. L., Volk M., Thorley-Lawson D. A., EBV persistence in memory B cells in vivo. Immunity 9, 395–404 (1998). - PubMed
    1. Nikitin P. A., et al. ., An ATM/Chk2-mediated DNA damage-responsive signaling pathway suppresses Epstein-Barr virus transformation of primary human B cells. Cell Host Microbe 8, 510–522 (2010). - PMC - PubMed
    1. McFadden K., et al. ., Metabolic stress is a barrier to Epstein-Barr virus-mediated B-cell immortalization. Proc. Natl. Acad. Sci. U.S.A. 113, E782–E790 (2016). - PMC - PubMed
    1. Shannon-Lowe C., Rickinson A. B., Bell A. I., Epstein-Barr virus-associated lymphomas. Philos. Trans. R. Soc. Lond. B Biol. Sci. 372, 20160271 (2017). - PMC - PubMed
    1. Price A. M., Luftig M. A., To be or not IIb: A multi-step process for Epstein-Barr virus latency establishment and consequences for B cell tumorigenesis. PLoS Pathog. 11, e1004656 (2015). - PMC - PubMed

Publication types

MeSH terms