. 2021 Sep;58(9):e13877.
doi: 10.1111/psyp.13877. Epub 2021 Jun 23.

EEG power spectral dynamics associated with listening in adverse conditions

Affiliations

EEG power spectral dynamics associated with listening in adverse conditions

Matthew G Wisniewski et al. Psychophysiology. 2021 Sep.

Abstract

Adverse listening conditions increase the demand on cognitive resources needed for speech comprehension. In an exploratory study, we aimed to identify independent power spectral features in the EEG useful for studying the cognitive processes involved in this effortful listening. Listeners performed the coordinate response measure task with a single-talker masker at a 0-dB signal-to-noise ratio. Sounds were left unfiltered or degraded with low-pass filtering. Independent component analysis (ICA) was used to identify independent components (ICs) in the EEG data, the power spectral dynamics of which were then analyzed. Frontal midline theta, left frontal, right frontal, left mu, right mu, left temporal, parietal, left occipital, central occipital, and right occipital clusters of ICs were identified. All IC clusters showed some significant listening-related changes in their power spectrum. This included sustained theta enhancements, gamma enhancements, alpha enhancements, alpha suppression, beta enhancements, and mu rhythm suppression. Several of these effects were absent or negligible using traditional channel analyses. Comparison of filtered to unfiltered speech revealed a stronger alpha suppression in the parietal and central occipital clusters of ICs for the filtered speech condition. This not only replicates recent findings showing greater alpha suppression as listening difficulty increases but also suggests that such alpha-band effects can stem from multiple cortical sources. We lay out the advantages of the ICA approach over the restrictive analyses that have been used as of late in the study of listening effort. We also make suggestions for moving into hypothesis-driven studies regarding the power spectral features that were revealed.

Keywords: ERSP; cocktail party; degraded speech; informational masking; oscillation.


Figures

FIGURE 1
FIGURE 1
Depiction of a typical trial in the CRM task with an example waveform of combined CRM sentences. Listeners’ task was to report the color and number of the “Baron” sentence after the retention interval. CRM sentence onset, and the mean times of CRM offset and microphone recording onset are marked
FIGURE 2
FIGURE 2
ERSP generated by averaging across all participants, conditions, and channels. Scalp maps display relative power at several time–frequency points of interest. Scalp maps are scaled differently so as to display relative power across the scalp effectively. The scales are omitted from scalp maps for figure clarity. See supplemental materials to view ERSPs at each channel with equal dB scale
FIGURE 3
FIGURE 3
Spectra for ICs within each cluster along with average scalp maps. The number of subjects contributing to each cluster and the number of ICs are given. Thin gray lines represent individual IC spectra. Thick colored lines represent the mean spectrum for a cluster. The dotted line is a reference for 10 Hz
FIGURE 4
FIGURE 4
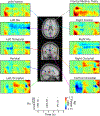
Mean locations of IC dipoles for each cluster are shown as spheres inside a standard Montreal Neurological Institute brain image. ERSPs corresponding to each IC cluster correspond to the average across all trials in the experiment. ERSPs are masked to reflect significant perturbations from baseline (fdr corrected across time–frequency points, p < .05)
FIGURE 5
FIGURE 5
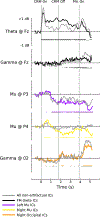
Traces of relative power for theta (4–8 Hz) at electrode Fz, gamma (30–50 Hz) at electrode Fz, mu (8–30 Hz) at electrodes P3 and P4, and gamma (30–50 Hz) at electrode O2. Each panel represents the relative power trace for a backprojected cluster of ICs and for backprojected non-artifactual ICs for individuals contributing to that respective cluster. Time points showing significant perturbations from baseline (p < .05; fdr corrected within trace) are highlighted underneath these traces by points having the same color as relative power traces
FIGURE 6
FIGURE 6
ERSPs for each cluster of ICs in filtered and unfiltered CRM listening conditions. Difference images are also shown. In difference images, the outer pixels of time–frequency regions showing significant differences are highlighted with white outlines

References

    1. Albouy P, Weiss A, Baillet S, & Zatorre RJ (2017). Selective entrainment of theta oscillations in the dorsal stream causally enhances auditory working memory performance. Neuron, 94, 193–206. 10.1016/j.neuron.2017.03.015 - DOI - PubMed
    1. Alhanbali S, Dawes P, Millman RE, & Munro KJ (2019). Measures of listening effort are multidimensional. Ear and Hearing, 40(5), 1084–1097. 10.1097/AUD.0000000000000697 - DOI - PMC - PubMed
    1. Başar E (2012). A review of alpha activity in integrative brain function: Fundamental physiology, sensory coding, cognition and pathology. International Journal of Psychophysiology, 86, 1–24. 10.1016/j.ijpsycho.2012.07.002 - DOI - PubMed
    1. Başar E, & Güntekin B (2012). A short review of alpha activity in cognitive processes and in cognitive impairment. International Journal of Psychophysiology, 86, 25–38. 10.1016/j.ijpsycho.2012.07.001 - DOI - PubMed
    1. Bertoli S, & Bodmer D (2014). Novel sounds as a psychophysiological measure of listening effort in older listeners with and without hearing loss. Clinical Neurophysiology, 125, 1030–1041. 10.1016/j.clinph.2013.09.045 - DOI - PubMed

Publication types