. 2021 Jun 22;35(12):109274.
doi: 10.1016/j.celrep.2021.109274.

A genome-wide library of MADM mice for single-cell genetic mosaic analysis

Affiliations

A genome-wide library of MADM mice for single-cell genetic mosaic analysis

Ximena Contreras et al. Cell Rep. .

Abstract

Mosaic analysis with double markers (MADM) offers one approach to visualize and concomitantly manipulate genetically defined cells in mice with single-cell resolution. MADM applications include the analysis of lineage, single-cell morphology and physiology, genomic imprinting phenotypes, and dissection of cell-autonomous gene functions in vivo in health and disease. Yet, MADM can only be applied to <25% of all mouse genes on select chromosomes to date. To overcome this limitation, we generate transgenic mice with knocked-in MADM cassettes near the centromeres of all 19 autosomes and validate their use across organs. With this resource, >96% of the entire mouse genome can now be subjected to single-cell genetic mosaic analysis. Beyond a proof of principle, we apply our MADM library to systematically trace sister chromatid segregation in distinct mitotic cell lineages. We find striking chromosome-specific biases in segregation patterns, reflecting a putative mechanism for the asymmetric segregation of genetic determinants in somatic stem cell division.

Keywords: Mosaic Analysis with Double Markers (MADM); functional gene analysis; genetic mosaic; genomic imprinting; lineage; single cell; sister chromatid Segregation Pattern; stem cell.


Conflict of interest statement

Declaration of interests The authors declare no competing interests.

Figures
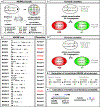
Figure 1.
Figure 1.. Extension of MADM to all 19 mouse autosomes
(A) Summary of the MADM principle. For MADM, two chimeric split marker genes containing partial coding sequences of EGFP and tdT are inserted into identical genomic loci of homologous chromosomes. Following Cre-recombinase-mediated interchromosomal (trans) recombination during mitosis, the split marker genes are reconstituted and functional green and red fluorescent proteins expressed. As a result, green GFP+, red tdT+, and yellow GFP+/tdT+ cells appear sparsely, due to an inherently low stochastic interchromosomal recombination rate, within the genetically defined cell population expressing Cre recombinase. Introduction of a mutant allele distal to the MADM cassette results in a genetic mosaic with homozygous mutant cells labeled in one color (e.g., green GFP+) and homozygous wild-type sibling cells in the other (e.g., red tdT+). Heterozygous cells appear in yellow (GFP+/tdT+). (B) Expansion of MADM to all mouse autosomes. Transgenic mice with MADM cassettes inserted close to the centromere have been generated for all 19 mouseautosomes. The directionality (forward, centromere-telomere; reverse, telomere-centromere) of marker gene transcription is indicated. (C) MADM labeling scheme for cassettes inserted in forward direction. MADM experiments involving forward cassettes require that the mutant allele of acandidate gene must be linked to the T-G MADM cassette in order for mutant cells to be labeled in green upon a G2-X MADM event. (D) MADM labeling scheme for cassettes inserted in reverse direction. MADM experiments involving reverse cassettes require that the mutant allele of a candidate gene must be linked to the G-T MADM cassette in order for mutant cells to be labeled in green upon a G2-X MADM event. (E) Generation of recombinant MADM chromosomes. To genetically link a mutant allele of a candidate gene of interest to the corresponding chromosome containing the T-G MADM cassette (i.e., forward orientation), it is necessary to first cross mice bearing the T-G MADM cassette with mice bearing the mutant allele. Resulting F1 transheterozygous offspring are then backcrossed to mice homozygous for the T-G MADM cassette. In F2, recombinant offspring emerge from meiotic recombination events in the germline. These F2 recombinants now contain both the MADM cassette (in homozygous configuration) and the mutant allele linked on the same chromosome. For experimental MADM mice, F2 recombinants are crossed with mice bearing the G-T MADM cassette and a Cre driver of interest. (F) Calculation of predicted meiotic recombination frequency. The probability for meiotic recombination resulting in the linkage of the MADM cassette with the mutant allele can be estimated by the genetic distance of the MADM cassette to the location of the mutant allele divided by two. See also Figures S1–S4 and Table S1.
Figure 2.
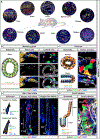
Figure 2.. MADM labeling pattern in different organs and stem cell niches
(A) Overview of MADM labeling (green, GFP; red, tdT; yellow, GFP/tdT) in MADM-19GT/TG in combination with Hprt-Cre at P21. Diverse tissues/organs including eye, brain, lung, spinal cord, kidney, spleen, liver, heart, and thymus are illustrated. (B) Schematic (left) and MADM labeling (middle/right; green, GFP; red, tdT; yellow, GFP/tdT) in mammary gland of lactating MADM-19GT/TG;HprtCre/+ female at 4 months of age. Basal/myoepithelial (middle) and luminal (right) cells are stained with antibodies against K14 and K8 (white), respectively. (C) Schematic (left) MADM labeling (right; green, GFP; red, tdT; yellow, GFP/tdT) in MADM-19GT/TG;HprtCre/+ pancreas, acinus, and duct, at P21. Epithelial cells are visualized by antibody staining against b-catenin (white; b-Cat). Acinar cells are identified by the presence of intracellular secretory granules. (D) Schematic (left) and MADM labeling (middle/right; green, GFP; red, tdT; yellow, GFP/tdT) in telogen (middle) and anagen (right) hair follicles in MADM-19GT/TG;HprtCre/+ at P21 (telogen) and P28 (anagen). Bu, bulge; 2° HG, secondary hair germ; SG, sebaceous gland; IRS, inner root sheath; CP, companion layer; ORS, outer root sheath; Mx, matrix. (E) Schematic (left) and MADM labeling (right; green, GFP; red, tdT; yellow, GFP/tdT) in small intestine in MADM-19GT/TG;HprtCre/+ at P21. Epithelial cells are visualized by antibody staining against β-catenin (white; β-Cat). Asterisk marks a Paneth cell, identified by the presence of intracellular granules. TAC, transit-amplifying cell; LGR5, leucine-rich repeat-containing G-protein coupled receptor 5. Nuclei were stained using DAPI. Scale bar: 50 μm (A) and 20 μm (B–E). See also Figures S5–S8.
Figure 3.
Figure 3.. Apc-tumor model at single-cell resolution using the MADM-18 line
(A) Schematic representation of MADM labeling (green, GFP; red, tdT) and respective cellular genotypes in wild-type MADM-18GT/TG;HprtCre/+ mice. (B and C) P-H3 staining (white) in small intestine in MADM-18GT/TG;HprtCre/+ mice at 3 months of age. (B) Overview of unicolor (monoclonal) green wild-type crypt-villus units with insets highlighting non-proliferative villus epithelium (i) and a proliferative cell within the crypt (white arrow) (ii); (C) overview and unicolor (monoclonal) red wild-type crypt-villus units with insets highlighting non-proliferative villus epithelium (iii) and a proliferating cell within the crypt (iv). (D) Quantification of the percentage of intestinal structures displaying MADM labeling. Data obtained from n = 3 male MADM-18GT/TG;HprtCre/+ mice at 3 months of age. (E) Schematic representation of MADM labeling (green, GFP; red, tdT) and respective cellular genotypes in genetic mosaic MADM-18GT/TG,Apc;HprtCre/+ mice. (F) P-H3 staining (white) in small intestine in male MADM-18GT/TG,Apc;HprtCre/+ mice at 3 months of age with insets highlighting a proliferating adenoma cell at the boundary to the non-proliferative villus epithelium (white arrow) (i), proliferating adenoma cells within the tumor (white arrows) (ii), non-proliferative normal villus epithelium (iii), and proliferative cells within a normal crypt compartment (iv). (G) Quantification of the percentage of intestinal structures displaying MADM labeling. Green Apc−/− cells display 100% transformation and tumor initiation, whereas red wild-type cells solely give rise to normal crypt-villus-units. Data obtained from n = 3 male MADM-18GT/TG,Apc;HprtCre/+ mice at 3 months of age. (H and I) Summary of MADM labeling in small intestine of control MADM-18GT/TG;HprtCre/+ (H) and genetic mosaic MADM-18GT/TG,Apc;HprtCre/+ mice (I). Note that in the mosaic, red wild-type cells give rise to normal crypt-villus units and green Apc−/− cells initiate tumor development and subepithelial invasion of adenomas. Nuclei were stained using DAPI. Scale bar: 100 μm (B, C, and F) and 25 μm (i–iv).
Figure 4.
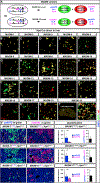
Figure 4.. MADM-induced uniparental chromosome disomy (UPD) results in paternal growth dominance in liver
(A) MADM scheme for imprinted genes. G2-X MADM events generate differentially labeled cells with near-complete UPD (cells with two copies of either the maternal [matUPD] or the paternal [patUPD] chromosome). (Top) The GT MADM cassette is inherited from the mother (M, pink) and the TG MADM cassette from the father (P, blue), and green cells show patUPD (PP) and red cells matUPD (MM). In such a scenario, imprinted maternally expressed genes are expressed at twice the normal dose and paternally expressed genes are not expressed in cells with matUPD (red). In contrast, paternally expressed genes are overexpressed by factor two and maternally expressed genes are not expressed in cells with patUPD (green). (Bottom) Reverse scheme with GT MADM cassette inherited from father and TG MADM cassette inherited from mother. Here, cells with matUPD are labeled in green and cells with patUPD in red fluorescent color. (B–U) Representative images of horizontal liver cryosections with MADM labeling (GFP, green; tdT, red) in MADM-1 (A) to MADM-19 (T and U) in combination with Hprt-Cre driver at P21. Higher resolution image (U) represents inset in (T) in left lateral lobe of liver in MADM-19. (V) (Top) Representative images (left, middle) of liver in MADM-7GT/TG;HprtCre/+ with green GFP+ patUPD and red tdT+ matUPD (left) or red tdT+ patUPD and green GFP+ matUPD (middle) at P21; and quantification (right) of absolute (cells/mm3) and relative (PP/MM) numbers of MADM-labeled cells with UPD. (Middle) Representative images (left, middle) of liver in MADM-11GT/TG;HprtCre/+ with green GFP+ patUPD and red tdT+ matUPD (left) or red tdT+ patUPD and green GFP+ matUPD (middle) at P21; and quantification (right) of absolute (cells/mm3) and relative (PP/MM) numbers of MADM-labeled cells with UPD. (Bottom) Representative images (left, middle) of liver in MADM-17GT/TG;HprtCre/+ with green GFP+ patUPD and red tdT+ matUPD (left) or red tdT+ patUPD and green GFP+ matUPD (middle) at P21; and quantification (right) of absolute (cells/mm2) and relative (PP/MM) numbers of MADM-labeled cells with UPD. Nuclei were stained using DAPI. Bars represent mean ± SEM. Data show MADM-7GT/TG;HprtCre/+ n = 6, MADM-11GT/TG;HprtCre/+ n = 5, MADM-17GT/TG;HprtCre/+ n = 6 mice. Scale bar: 200 mm.
Figure 5.
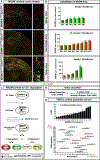
Figure 5.. Mitotic interchromosomal recombination efficiency and sister chromatid segregation patterns for all MADM reporters in cortical projection neurons
(A) Representative images of MADM-labeling pattern (green, GFP; red, tdT; yellow, GFP/tdT) in cerebral cortex in three exemplary MADM lines in combination with the Emx1-Cre driver at P21. (Top) MADM-9GT/TG;Emx1Cre/+; (middle) MADM-17GT/TG;Emx1Cre/+; (bottom) MADM-19GT/TG;Emx1Cre/+. Scale bar: 100 μm. (B) Classification of MADM lines. (Top) Sparse (< 25 cells/mm3). (Middle) Intermediate (25–100 cells/mm3). (Bottom) Dense (>100 cells/mm3). Bars represent mean ± SEM. Data show M7, M11, and M19 (n = 5); M2, M3, M5, M8–M10, and M12–M18 (n = 6); M4 and M6 (n = 8), and M1 (n = 12 mice). (C) MADM principle illustrating G2-X and G2-Z segregation patterns. Upon Cre-mediated interchromosomal recombination at the loxP site in the MADM cassettes in G2 phase of the cell cycle, recombinant chromosomes can either segregate together to the same daughter cell (G2-Z segregation; yellow, GFP/tdT and unlabeled cell) or each recombinant chromosome may segregate to distinct daughter cells (G2-X segregation; green, GFP+ and red tdT+ cell, respectively) upon mitosis. (D) Definition of yellow-green-red-index index (YGRI). The YGRI is calculated from the number of yellow cells divided by the average of green and red cells to compensate for G2-Z events that leads to labeling of only one daughter cell (yellow) and an (invisible) unlabeled cell. Note that yellow cells emerging from G1/G0 events contribute to the total number of yellow cells. (E) YGR index in neuronal lineages. (Top) YGRI for cortical projection neurons in P21 neocortex of all 19 MADM reporter lines in combination with the Emx1-Cre driver. Note that (1) YGRI varies from 1 to 10 but is never below 1 and (2) YGRIs do not correlate with the sizes of the respective MADM chromosomes. Bars represent mean ± SEM. Data show M2, M3, M5, and M7–M19 (n = 6); M4 and M6 (n = 8); and M1 (n = 12). (Bottom) YGRI ranking in correlation (red line) to recombination frequency index (RFI). Note that MADM chromosomes with a high recombination frequency do not necessarily present high YGRI and vice versa. See also Figures S1 and S9.
Figure 6.
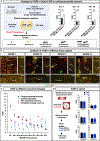
Figure 6.. Sister chromatid segregation patterns based on YGRI in Dnah11 knockout (KO) and in different somatic cell lineages
(A) (Left) Summary of YGRI analysis in selected MADM reporters with Dnah11 depletion (in iv mice). (Right) YGR index for cortical projection neurons in P21 neocortex in MADM-7, MADM-12, and MADM-18 reporter lines in combination with the Emx1-Cre driver in control and Dnah11 KO (iv) mice. Note that a decrease of YGRI to 1 would indicate random sister chromatid segregation but that the YGRI was not decreased upon Dnah11 mutation. Bars represent mean ± SEM. Data show n = 3 mice for each genotype. (B) Representative confocal microscopy images at P21 with MADM labeling (GFP, green; tdT, red) from selected MADM reporters in combination with a Nestin-Cre (cerebellum) or Emx1-Cre (cerebral cortex and hippocampal CA1 area) driver used for quantifications in Figures 5C and 6A. Arrows indicate Purkinje cells (Pcs), cortical pyramidal neurons (Pys), and CA1 pyramidal neurons (CA1 Pys). Scale bar: 100 μm. (C) YGRI for selected MADM reporters in different neuronal lineages at P21. YGRI of cortical astrocytes and hippocampal CA1 pyramidal cells derived from Emx1+ progenitors and cerebellar Purkinje cells derived from Nestin+ progenitors significantly differ from the YGRI of cortical pyramidal neurons for most MADM chromosomes analyzed. Values represent mean ± SEM. Data show pyramidal neurons (n = 6); cortical astrocytes (n = 6); CA1 pyramidal neurons M5, M7, M8, M11, M12, M16, M18, and M19 (n = 6); M10 (n = 7); M17 (n = 8); cerebellar Purkinje cells M7, M8, M11, M16, M17, and M19 (n = 3); M12 and M18 (n = 4); M10 (n = 5) and M5 (n = 6 mice). (D) (Left) White blood cell preparations from spleen in MADM reporters with Hprt-Cre at P21 were subjected to FACS. The number of green GFP+, red tdT+, and yellow GFP+/tdT+ CD3+ T cells (black) and CD19+ B cells (blue) were quantified. (Right) YGRI for six different MADM chromosomes including sparse (MADM-4), intermediate (MADM-8, MADM-15, and MADM-17), and dense (MADM-18 and MADM-19) lines. The different MADM recombinant chromosomes displayed distinct YGRI but YGRI for T cells and B cells was not significantly different for all MADM chromosomes analyzed. Bars represent mean ± SEM. Data show M8 and M18 (n = 3); M4, M17, and M19 (n = 4); M15 (n = 5 mice). Welch’s unequal variances t test, pM4 = 7.5E01, pM8 = 7.9E01, pM15 = 7.7E01, pM17 = 6.4E01, pM18 = 9.8E01, pM19 = 5.0E01.
Figure 7.
Figure 7.. Models of biased sister chromatid segregation patterns in ESCs in vitro and in mouse in vivo
(Left) Previous studies (Liu et al., 2002; Armakolas and Klar 2006) using mitotic recombination and in combination with restriction-site sensitivity for genotyping in ESC cultures reported that in ESC-derived neuroectodermal lineages no G2-X (recombinant chromosomes segregate away from each other during cell division) events could be observed. In contrast, lineages derived from endodermal stem cells showed exclusively G2-X segregation patterns. Based on these findings, it could be anticipated that in MADM there would be no red and green cells in neural lineages (e.g., in the brain), which was not the case for all MADM chromosomes. (Right) In vivo analysis of the prevalence of G2-X events (red and green cells) in comparison with total number of yellow cells (G2-Z, G1, and G0 events) for all MADM chromosomes and in several somatic cell lineages revealed a significant bias in the recombinant chromosome and thus sister chromatid segregation patterns. The segregation bias showed marked chromosome specificity that was distinct for different chromosomes in the same cell type in both brain and hematopoietic systems. The segregation bias appears also to be affected by cell type, as the level of bias was distinct for the same chromosome in different cell types.

References

    1. Ali SR, Hippenmeyer S, Saadat LV, Luo L, Weissman IL, and Ardehali R. (2014). Existing cardiomyocytes generate cardiomyocytes at a low rate after birth in mice. Proc. Natl. Acad. Sci. USA 111, 8850–8855. - PMC - PubMed
    1. Amberg N, Holcmann M, Glitzner E, Novoszel P, Stulnig G, and Sibilia M. (2015). Mouse models of nonmelanoma skin cancer. Methods Mol. Biol 1267, 217–250. - PubMed
    1. Apte MS, and Meller VH (2012). Homologue pairing in flies and mammals: gene regulation when two are involved. Genet. Res. Int 2012, 430587. - PMC - PubMed
    1. Armakolas A, and Klar AJ (2006). Cell type regulates selective segregation of mouse chromosome 7 DNA strands in mitosis. Science 311, 1146–1149. - PubMed
    1. Armakolas A, and Klar AJ (2007). Left-right dynein motor implicated in selective chromatid segregation in mouse cells. Science 315, 100–101. - PubMed

Publication types

MeSH terms

Substances

LinkOut - more resources