. 2021 Jun 22;35(12):109286.
doi: 10.1016/j.celrep.2021.109286.

Single-cell BCR and transcriptome analysis after influenza infection reveals spatiotemporal dynamics of antigen-specific B cells

Affiliations

Single-cell BCR and transcriptome analysis after influenza infection reveals spatiotemporal dynamics of antigen-specific B cells

Nimitha R Mathew et al. Cell Rep. .

Erratum in

Abstract

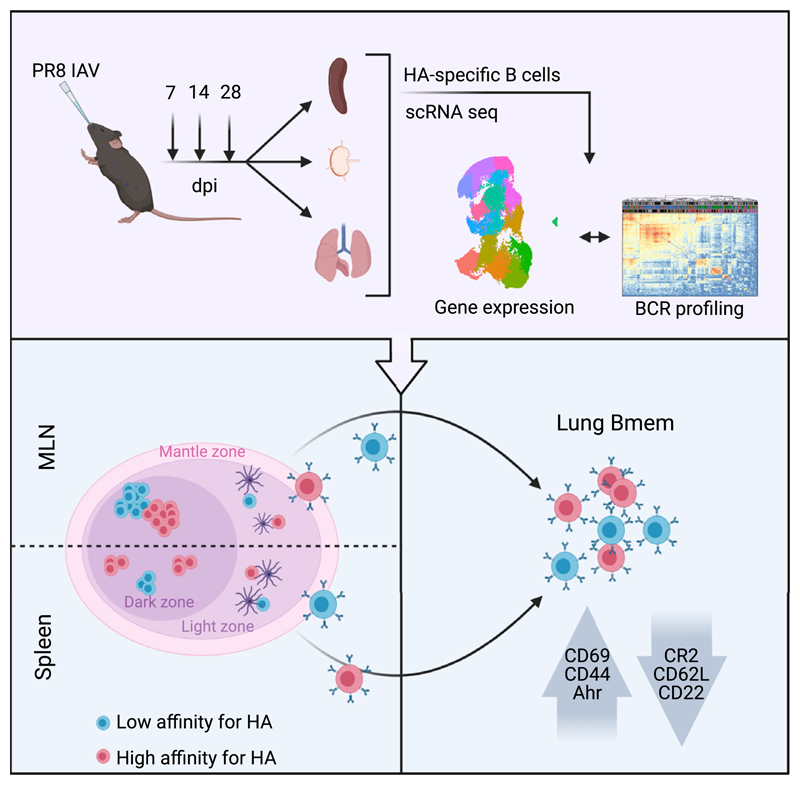
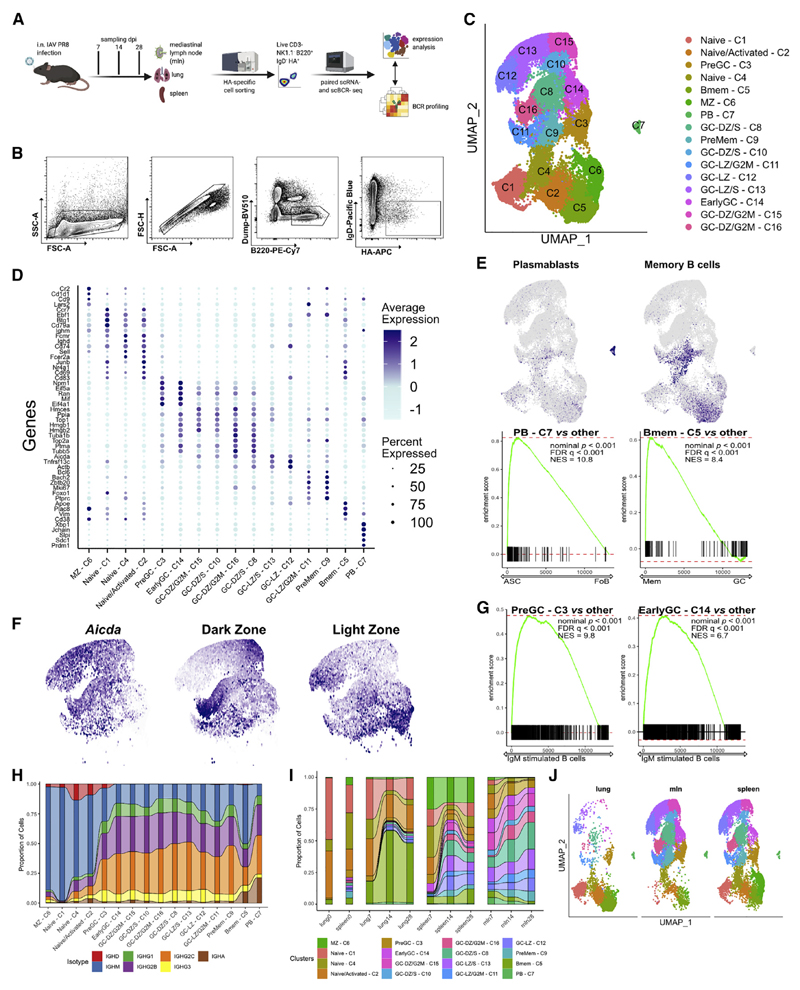
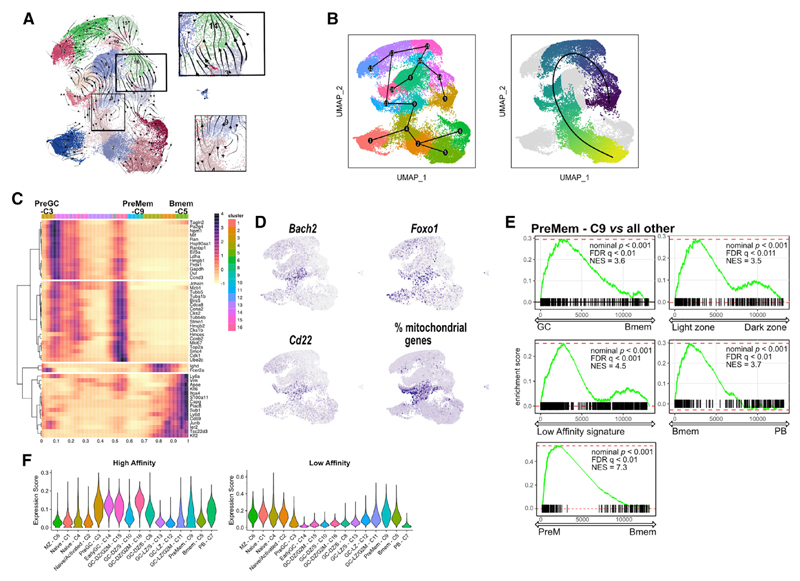
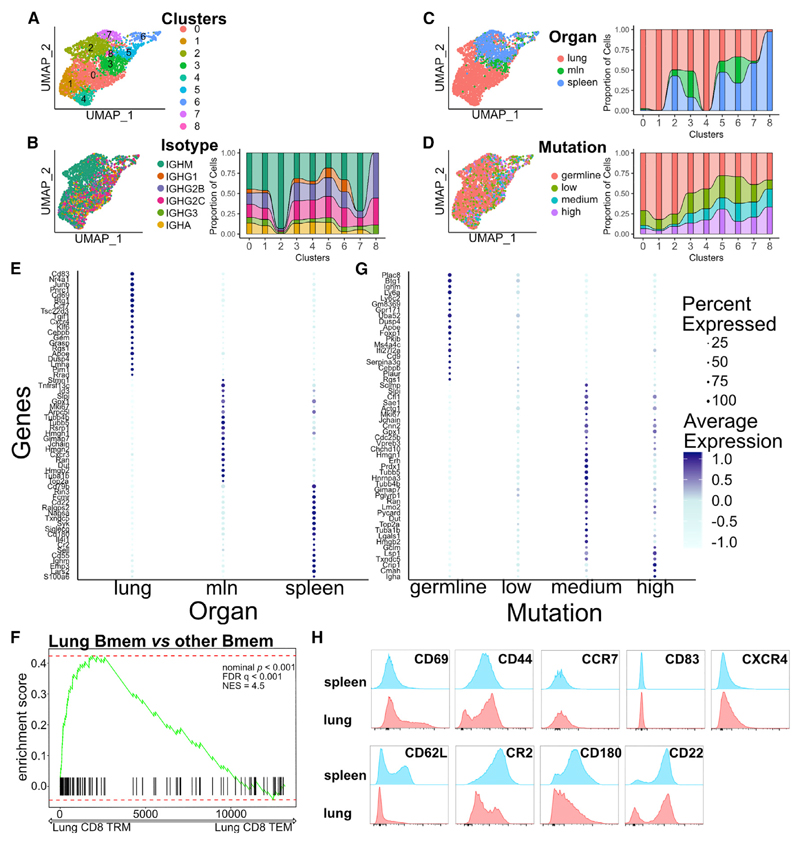
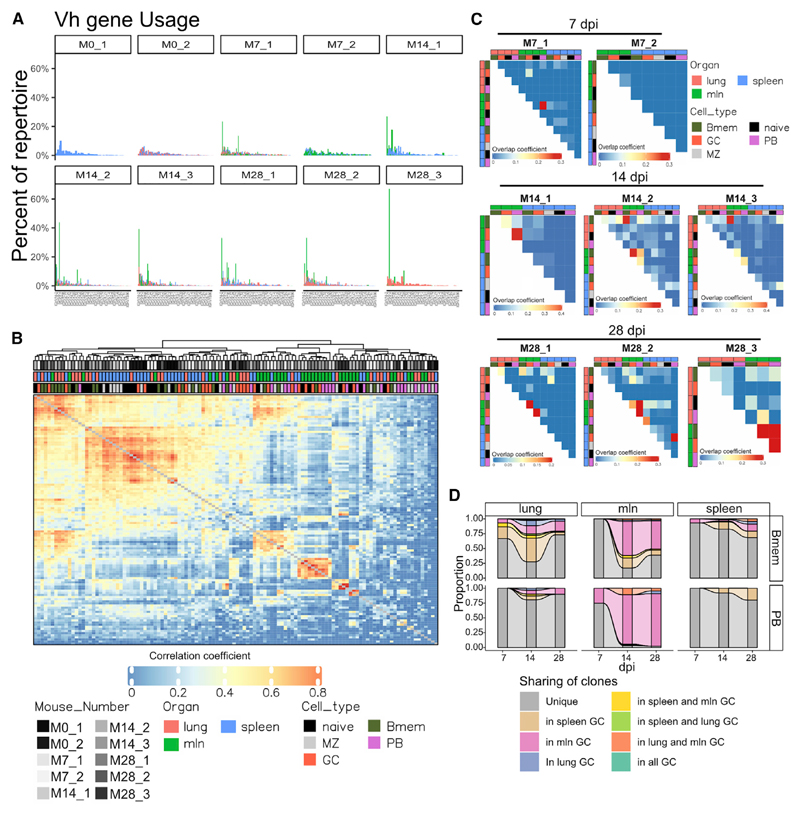
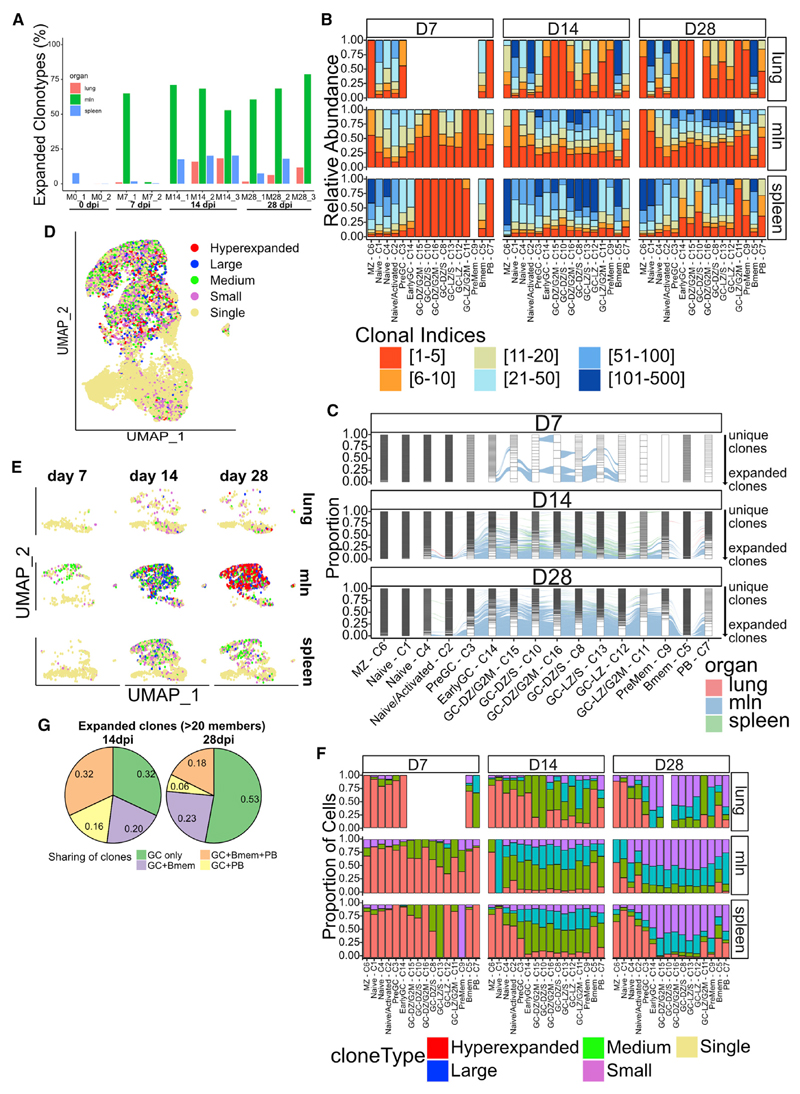
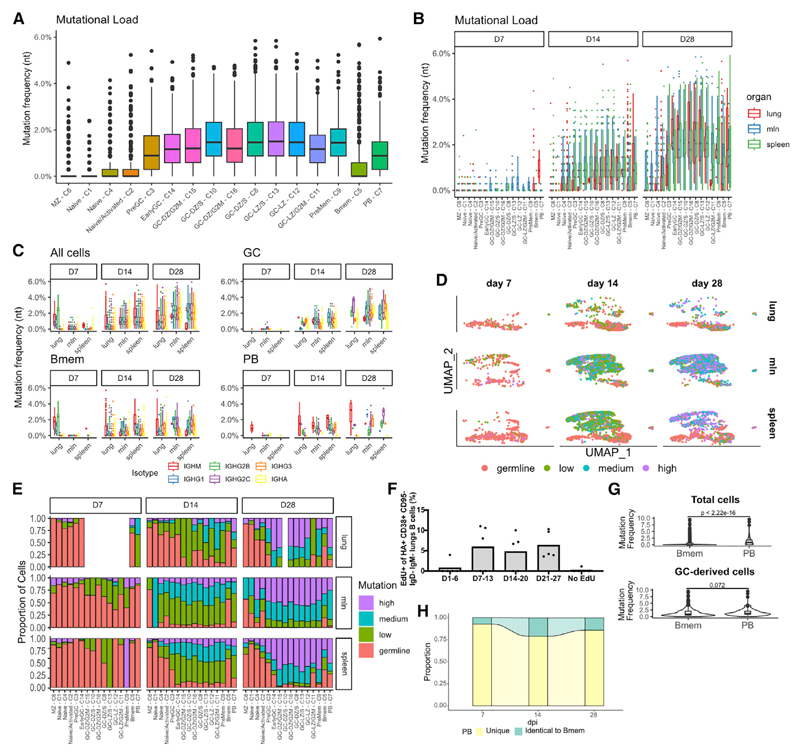
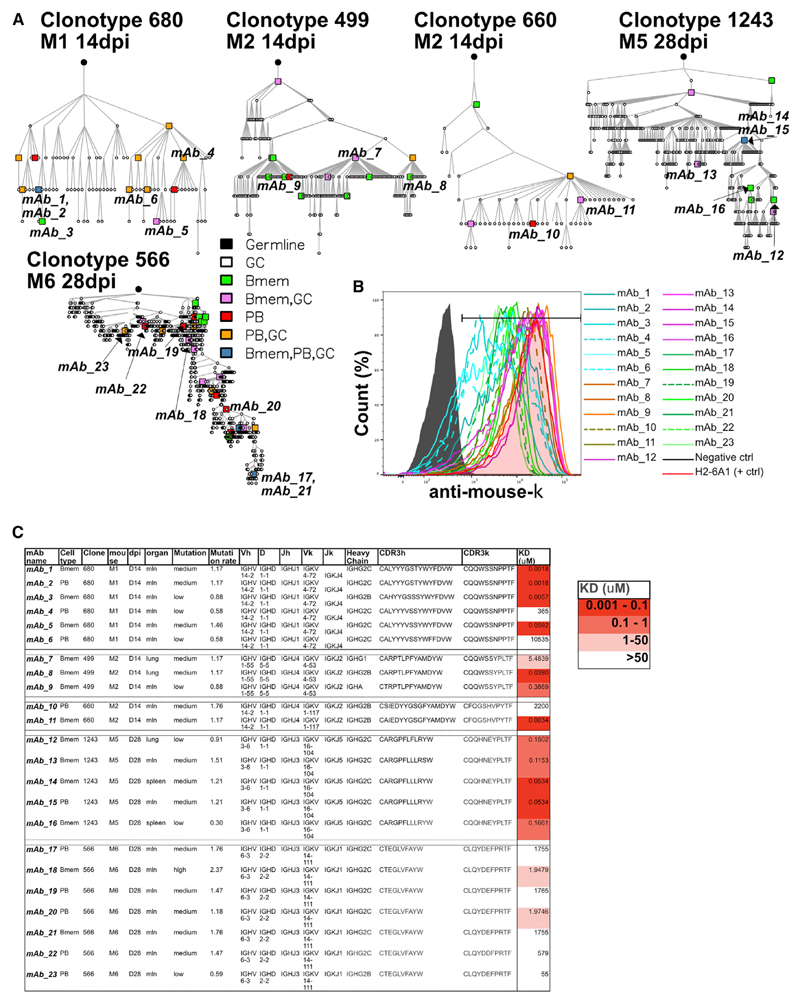
B cell responses are critical for antiviral immunity. However, a comprehensive picture of antigen-specific B cell differentiation, clonal proliferation, and dynamics in different organs after infection is lacking. Here, by combining single-cell RNA and B cell receptor (BCR) sequencing of antigen-specific cells in lymph nodes, spleen, and lungs after influenza infection in mice, we identify several germinal center (GC) B cell subpopulations and organ-specific differences that persist over the course of the response. We discover transcriptional differences between memory cells in lungs and lymphoid organs and organ-restricted clonal expansion. Remarkably, we find significant clonal overlap between GC-derived memory and plasma cells. By combining BCR-mutational analyses with monoclonal antibody (mAb) expression and affinity measurements, we find that memory B cells are highly diverse and can be selected from both low- and high-affinity precursors. By linking antigen recognition with transcriptional programming, clonal proliferation, and differentiation, these finding provide important advances in our understanding of antiviral immunity.

Keywords: B cells; antibodies; antiviral immunity; germinal center; influenza; memory B cells; single-cell BCRseq; single-cell RNA-seq.


Conflict of interest statement

Declaration of interests The authors declare no competing interests.

Figures

Graphical abstract
Graphical abstract
Figure 1
Figure 1. Dynamics of antiviral B cell response at single-cell resolution is organ specific
(A) Schematic diagram of the experimental setup of influenza infection, cell sorting, followed by scRNA-seq and BCR profiling. (B) Representative gating for the cell sorting of single HA+ IgD B cells. (C) UMAP plot of unsupervised clustering of HA-specific B cells, combining all organs and dpi. (D) Mean expression of the top-five marker genes for each cell cluster. Color intensity denotes average expression, whereas dot size is the percentage of cells expressing the gene. (E) On the top UMAP plot, as in (C), showing average expression of gene signatures associated with plasma blasts and memory B cell programs from Bhattacharya et al. (2007). On the bottom, enrichment score from GSEA comparing PB-C7s to all other clusters for antibody-secreting cell (ASC) genes versus follicular B cell (FoB) genes from Shi et al. (2015) and Bmem-C5s to all other clusters for memory genes versus GC genes from Laidlaw et al. (2020). (F) UMAP plot of GC clusters showing average expression of Aicda and gene signatures associated with dark and light zone programs from Victora et al. (2010). (G) Enrichment score from GSEA comparing PreGC-C3 and EarlyGC-C14 to all others for genes involved in B cell activation and differentiation from Fowler et al. (2015). (H) Alluvial plot showing proportion of cells with defined antibody isotype for each cluster. (I) Alluvial plot showing proportion of cells for each UMAP cluster, as in (C), divided by organ and dpi. (J) UMAP plot of infected mice divided by organ.
Figure 2
Figure 2. RNA velocity and trajectory analysis identify cluster 9 as memory B cell precursors
(A) RNA velocity, as determined by scVelo, projected onto a UMAP. Arrowheads determine predicted direction of the cell movement, and arrow size determines strength of predicted directionality. In the squares are highlighted cells moving from PreGC-C3 to earlyGC-C14 (top) and cells moving from PreMem-C9 (bottom). (B) Trajectory inference by Slingshot projected onto a UMAP with PreGC-C3 selected as the starting cluster. On the right, the same graph is shown with pseudotime coloring. Cluster PB-C7 was excluded because it was clearly disconnected from the others. (C) List of differentially expressed genes over trajectory-based pseudotime. Colors on top indicate clusters. (D) UMAP plot of GC clusters showing average expression of selected genes. (E) Enrichment score from GSEA comparing PreMem-C9 to all others for genes involved in the GC program; the LZ program; the memory cell program; a low-affinity signature, as described by Shinnakasu et al. (2016); and the PreM cluster, as defined by Laidlaw et al. (2020). (F) Violin plot showing high- and low-affinity gene expression scores by UMAP clusters, as defined by Shinnakasu et al. (2016). Data are presented as medians and interquartile ranges
Figure 3
Figure 3. Memory B cells in the lungs have a distinct transcriptional programming compared with that of spleen and mln
(A) UMAP plot of unbiased clustering of HA-specific memory B cells (C5 in Figure 1C), combining all organs and dpi. (B) UMAP plot of unbiased clustering of HA-specific memory B cells, as in (A), colored by the BCR isotype. On the right, an alluvial plot shows the proportion of cells with a defined isotype per cluster. (C) UMAP plot of unbiased clustering of HA-specific memory B cells, as in (A), colored by organ. On the right, an alluvial plot shows the proportion of cells belonging to a specific organ per cluster. (D) UMAP plot of unbiased clustering of HA-specific memory B cells, as in (A), colored by BCR mutation rate. Germline (not mutated), low (up to 1% nucleotide mutation), medium (up to 2%), and high (more than 2% mutation). On the right, an alluvial plot shows the proportion of cells with a defined mutation rate per cluster. (E) Mean expression of the top-20 marker genes for each organ for Bmems. Color intensity denotes average expression, whereas dot size shows the percentage of cells expressing the gene. (F) Enrichment score from GSEA comparing lung Bmems to all others for genes expressed by CD8 TRM. (G) Mean expression of the top-20 marker genes for cells divided by mutation rate for Bmems. Color intensity denotes average expression, whereas dot size shows the percentage of cells expressing the gene. (H) Flow cytometry histograms showing expression of the indicated genes by memory B cells (Dump B220+ CD38+ IgD IgM) in lungs and spleen. Representative results of three biological replicates with three mice each.
Figure 4
Figure 4. Memory cells broadly disseminate in several organs
(A) Percentage of cells using a specific Vh gene for each mouse, divided by organ. (B) Hierarchical clustering of Pearson’s correlation of the V gene repertoire. Each tile represents the correlation of the V gene repertoire. Color intensity indicates correlation strength. See Figure S4 for p values. (C) Overlap between B cell clones in different organ and cell types, divided by mouse. Each tile represents the overlap coefficient of clones. Color intensity indicates overlap strength. (D) Alluvial plots showing clonal origin of Bmems and PBs based on CDR3 sequence, with germline (GC independent) cells excluded from analysis. Top row shows Bmems, and bottom row shows PBs, divided by organ at each dpi. Grey bar indicates that the clones were not found in any GCs, whereas the color indicates that clonal relatives were found in GCs.
Figure 5
Figure 5. Clonal expansion in GC is organ specific
(A) Graph showing the percentage of expanded clonotypes for each mouse, divided by organ. (B) Graph showing clonal expansion for each cluster, divided by dpi and organ. Clones are ordered by their abundance for each cluster, dpi, and organ, and color indicates the repertoire space occupied by the top-X clones as shown in figure legend. (C) Alluvial plots showing clonal sharing between clusters and organs at different dpi. Each cluster is divided in several bars, representing individual clones, and the height of each represents the proportion of the clusters occupied by that clone. Connecting lines indicate the sharing of clones, with colors indicating the organ. (D) UMAP plot of infected cells for all organs and dpi, colored by clonal expansion status. Clones were defined as single (1 cell), small (between 1 and 5 cells), medium (between 6 and 20 cells), large (between 21 and 100 cells), and hyperexpanded (more than 101 cells) clones. (E) UMAP plot of infected cells divided by organ and dpi, colored by clonal expansion status. (F) Graphs showing proportion of cells for each clonal-expansion status for each cluster, divided by dpi and organ. (G) Pie charts showing the distribution of expanded clones (more than 20 cells sequenced) in different clusters. Numbers in the chart indicate frequency.
Figure 6
Figure 6. Sustained generation of highly mutated Bmems
(A) Graph showing Vh gene mutation frequency divided by UMAP clusters as in Figure 1C. Data are presented as the median and interquartile range. (B) Graphs showing Vh gene mutation frequency for each cluster, divided by dpi and organ. Data are presented as median and interquartile range. (C) Graphs showing Vh gene mutation frequency for each organ, divided by dpi and isotype. Two-way ANOVA with Tukey’s post test: for “All cells” at day 14, each isotype versus IgM, p < 0.0001; IgA versus IgG2b, p < 0.05; IgA versus IgG2c, p < 0.001; IgA versus IgG3, p < 0.01; IgG2c versus IgG1, p < 0.001. For “All cells” at day 28, each isotype versus IgM, p < 0.0001; IgA versus IgG1, p < 0.01; IgA versus IgG2b, p < 0.05; IgG2b versus IgG2c, p < 0.0001; IgG2c versus IgG3, p < 0.01; IgG2c versus IgG1, p < 0.0001; other comparisons ns. For “GC” at day 28, IgG1 versus IgM, p < 0.001; IgG2b versus IgM, p < 0.0001; IgG3 versus IgM, p < 0.01; IgG2c versus IgG1, p < 0.0001; IgG2c versus IgG2b, p < 0.0001; IgG2c versus IgG3, p < 0.0001. For “Bmem” at day 14, IgA versus IgM, p < 0.0001; IgA versus IgG2b, p < 0.0001; IgA versus IgG2c, p < 0.0001; IgA versus IgG3, p < 0.001. For “PB” at day 28, IgA versus IgM, p < 0.0001; IgA versus IgG2b, p < 0.0001; IgA versus IgG2c, p < 0.0001; IgG1 versus IgM. p < 0.01; IgG2b versus IgM, p < 0.01. All other comparisons are non-significant. Data are presented as medians and interquartile ranges. (D) UMAP plots of infected cells divided by organ and dpi, colored by mutation rate. Germline, not mutated; low, up to 1% nucleotide mutation; medium, up to 2%; and high, more than 2% mutation. (E) Graph showing proportion of cells for each mutation rate for each cluster, divided by dpi and organ. (F) Mice were infected with PR8 and injected with EdU at the indicated time windows. At day 35, mice were sacrificed, and lungs were subjected to flow cytometry. Shown is the frequency of EdU+ cells among the HA+ switched-memory-cell population. The experiment was performed once with n = 5 per group. Data are presented as means. (G) Violin plots comparing mutation frequency of total and GC-derived Bmems versus PBs. Statistical differences were tested using Student’s t test. Data are presented as medians and interquartile ranges. (H) Alluvial plot showing the proportion of PBs with a sequence identical to that of a Bmem, divided by dpi.
Figure 7
Figure 7. mAbs derived from Bmems and PBs have similar affinity for HAs
(A) Clonal trees of five selected clonal families from four mice at different dpi. Color indicates cell types, and each circle or square is a cell that was sequenced in our experiments. Where symbols are missing between junctions, it denotes an inferred member of the clonal family. Expressed mAbs are indicated by name. (B) Madin-Darby canine kidney (MDCK) cells were infected with a PR8-mcherry virus and, at 5 h after infection, were stained with mAbs and detected with anti-mouse κ. The histogram shows the binding to viral HA. (C) Characteristics of the expressed mAbs including KD value measured by BLI.

References

    1. Adachi Y, Onodera T, Yamada Y, Daio R, Tsuiji M, Inoue T, Kobayashi K, Kurosaki T, Ato M, Takahashi Y. Distinct germinal center selection at local sites shapes memory B cell response to viral escape. J Exp Med. 2015;212:1709–1723. - PMC - PubMed
    1. Allie SR, Bradley JE, Mudunuru U, Schultz MD, Graf BA, Lund FE, Randall TD. The establishment of resident memory B cells in the lung requires local antigen encounter. Nat Immunol. 2019;20:97–108. - PMC - PubMed
    1. Altman MO, Bennink JR, Yewdell JW, Herrin BR. Lamprey VLRB response to influenza virus supports universal rules of immunogenicity and antigenicity. eLife. 2015;4:e07467 - PMC - PubMed
    1. Angeletti D, Yewdell JW. Is it possible to develop a “universal” influenza virus vaccine? outflanking antibody immunodominance on the road to universal influenza vaccination Cold Spring Harb. Perspect Biol. 2018;10:a028852 - PMC - PubMed
    1. Angeletti D, Gibbs JS, Angel M, Kosik I, Hickman HD, Frank GM, Das SR, Wheatley AK, Prabhakaran M, Leggat DJ, et al. Defining B cell immunodominance to viruses. Nat Immunol. 2017;18:456–463. - PMC - PubMed

Publication types

MeSH terms